Log-Log Graph Paper
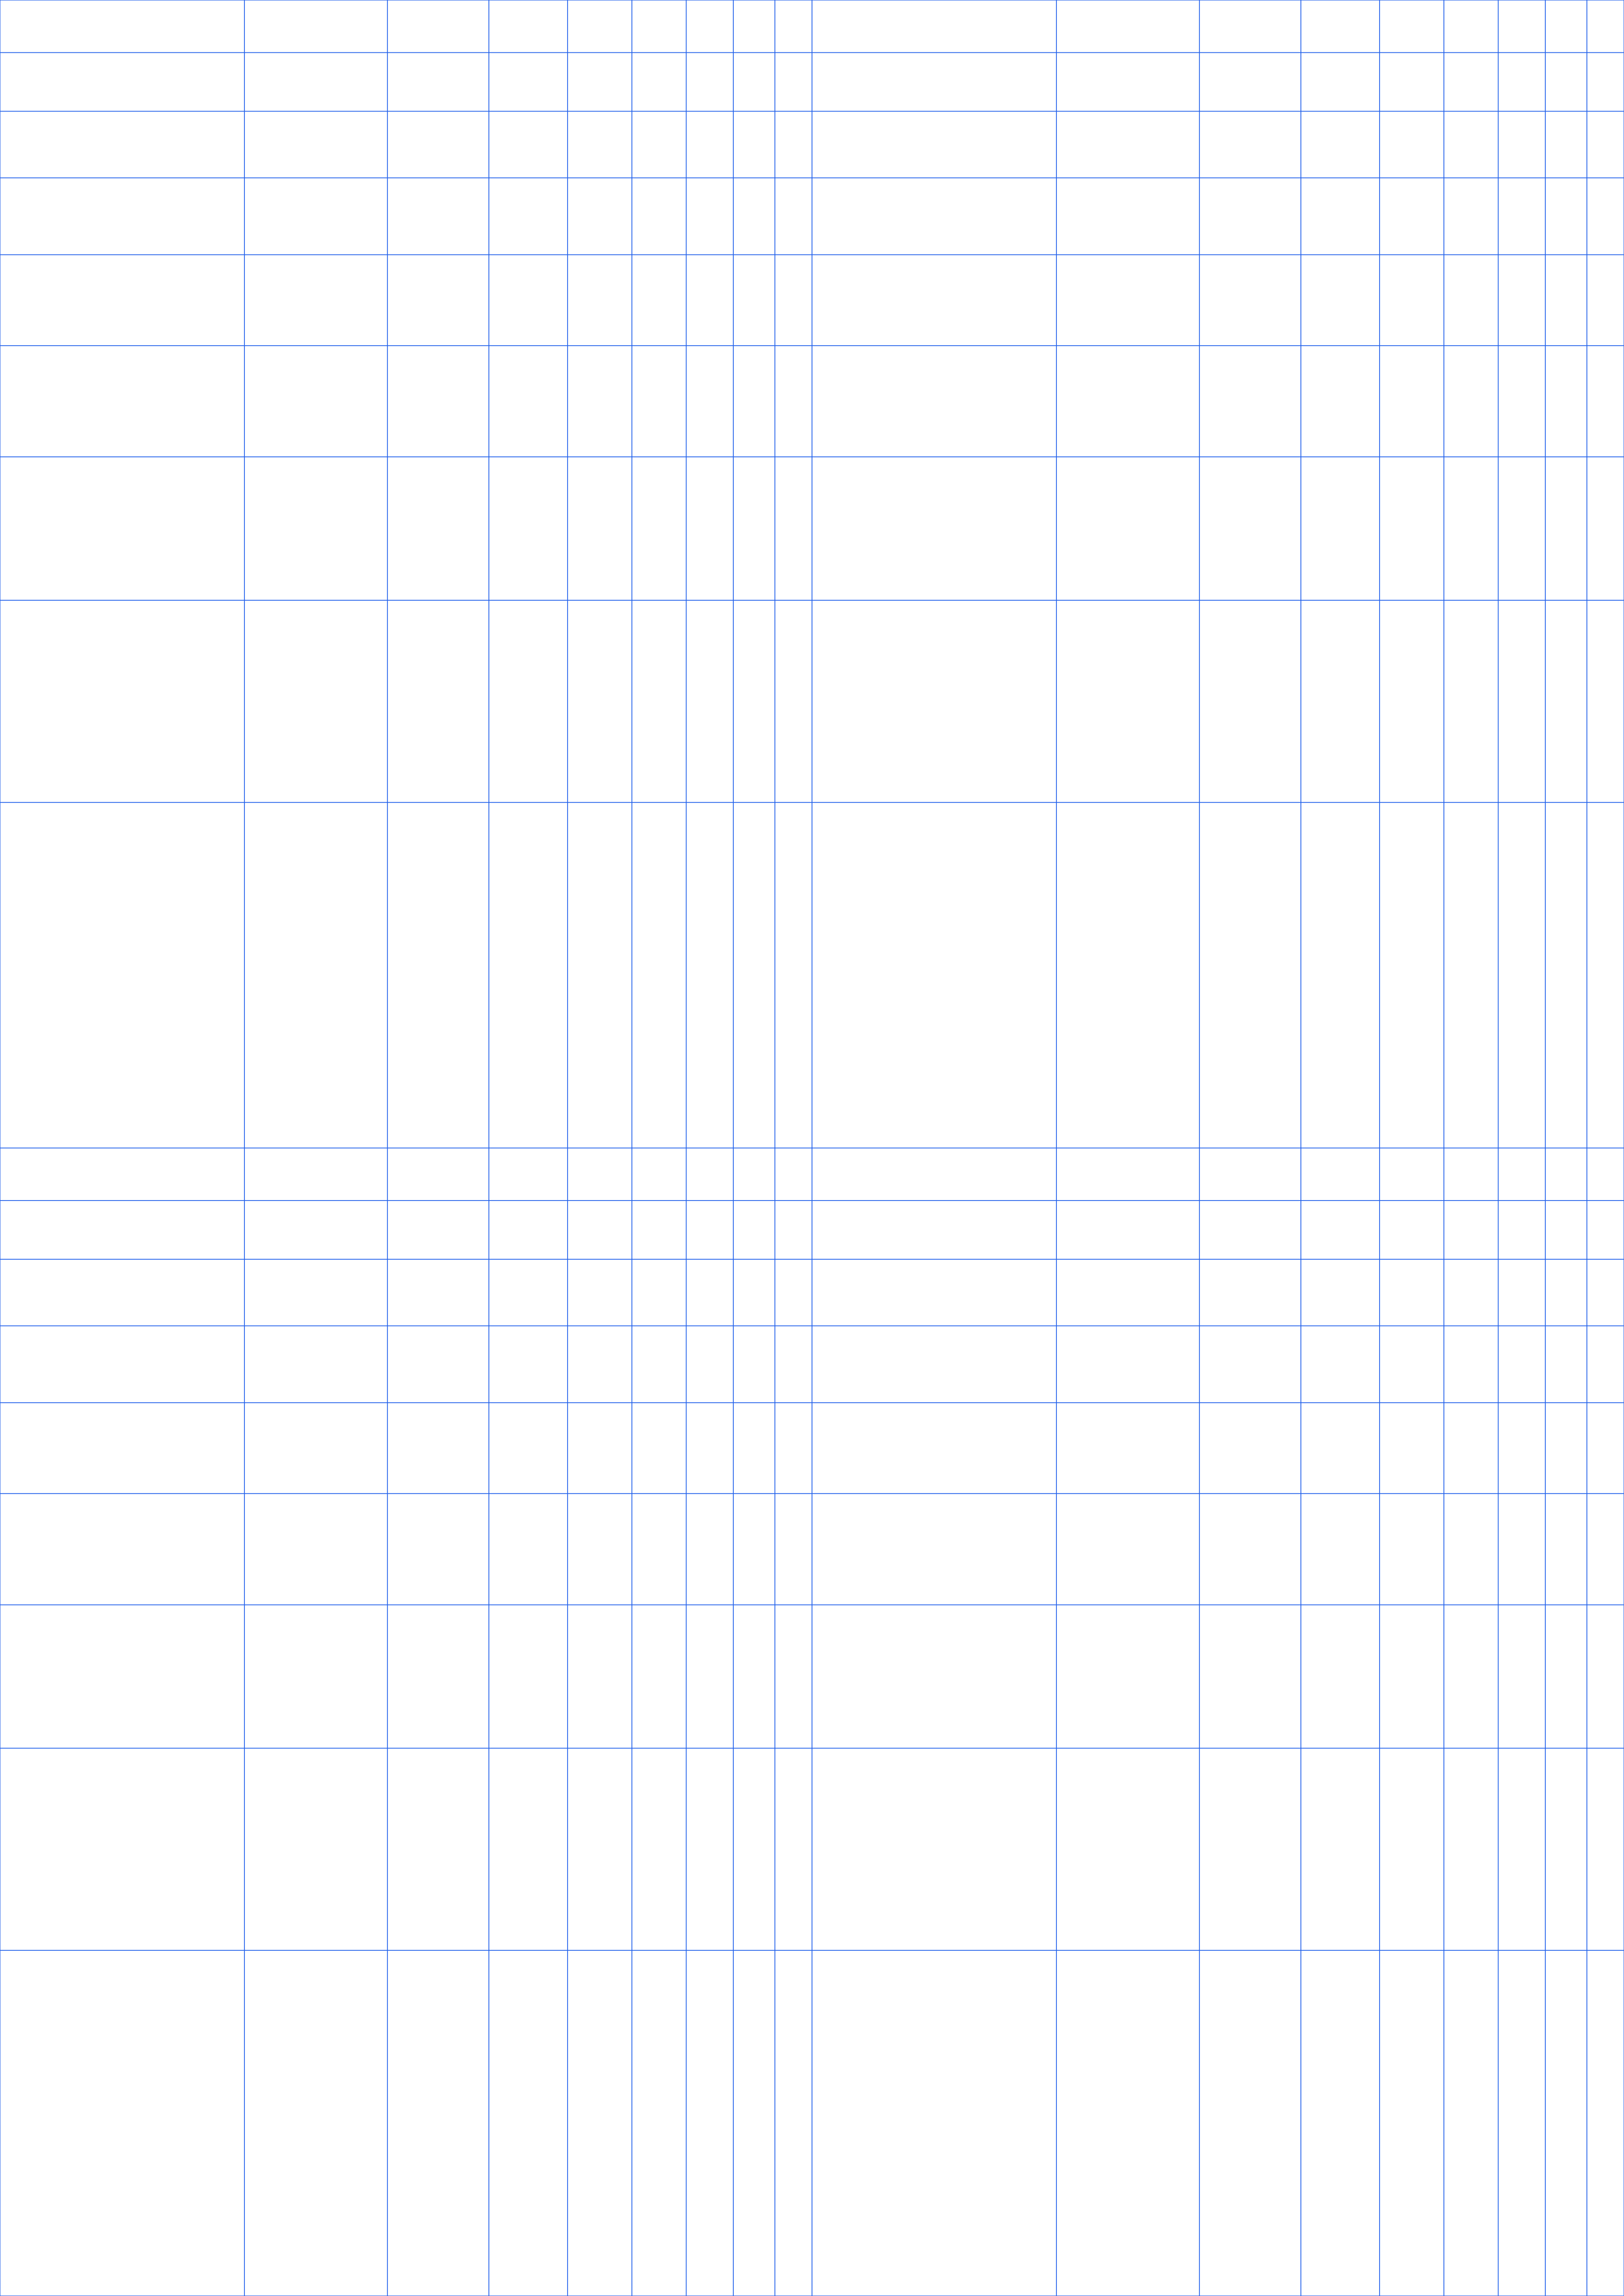
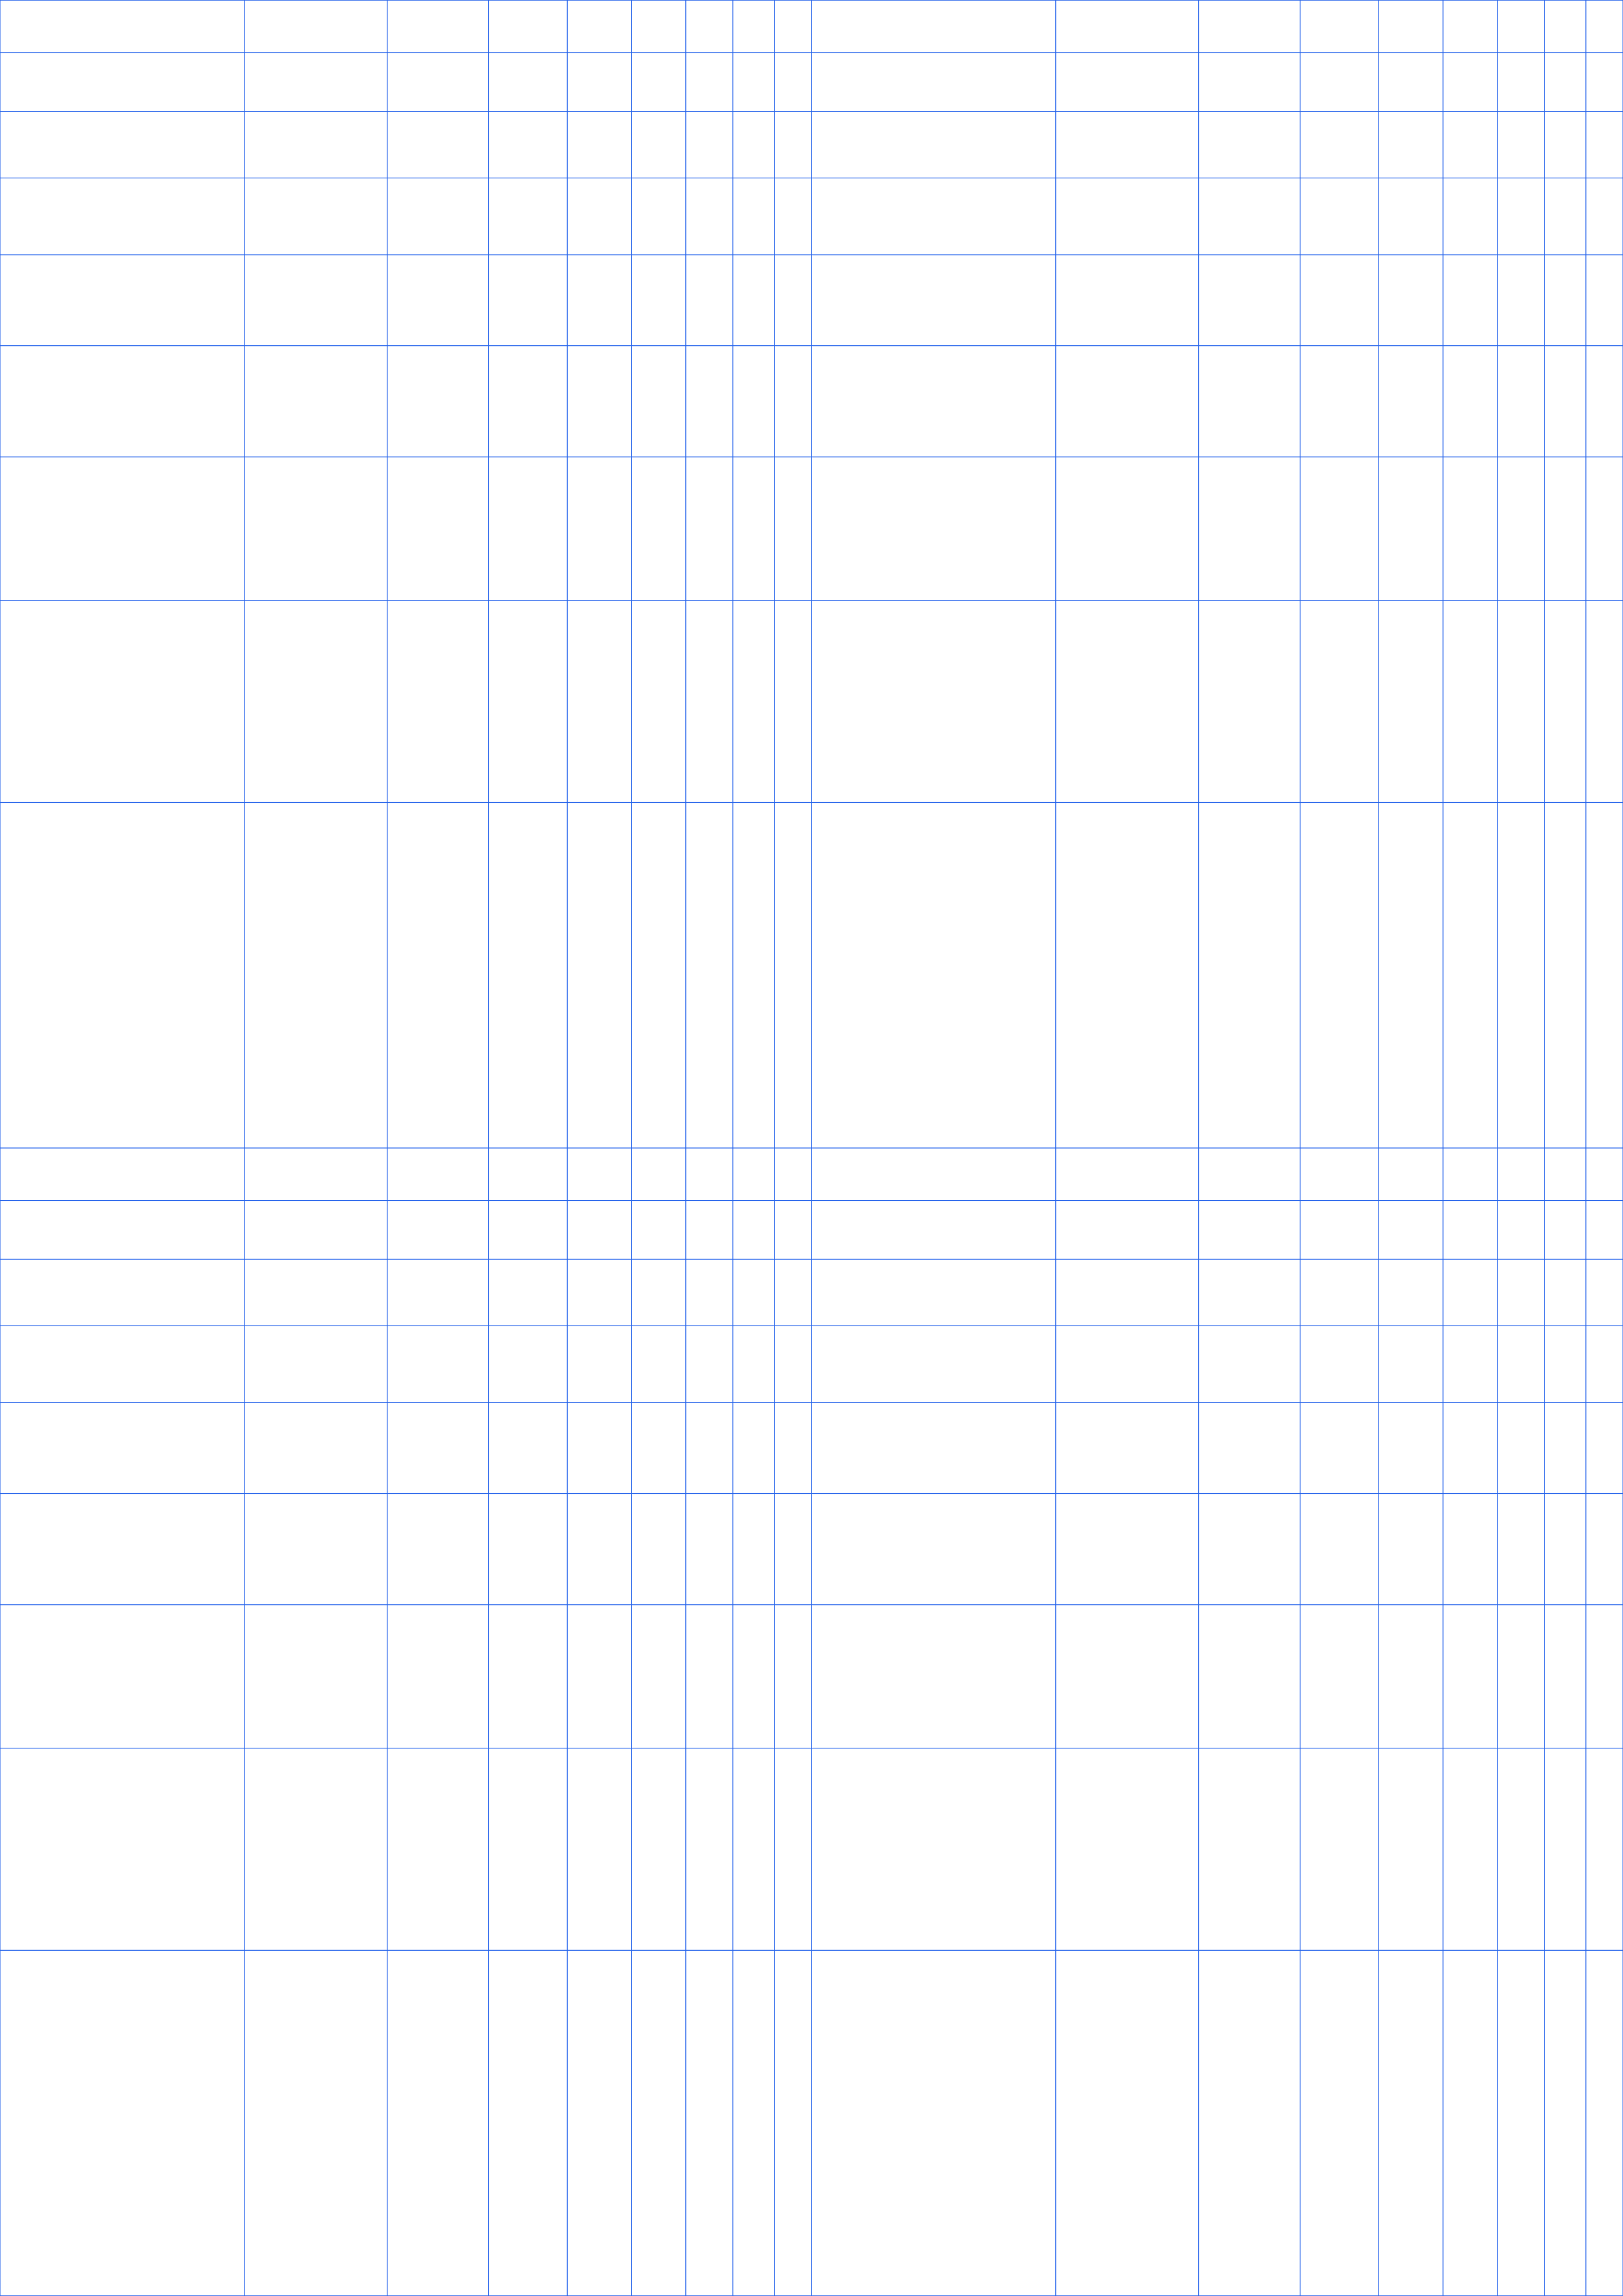
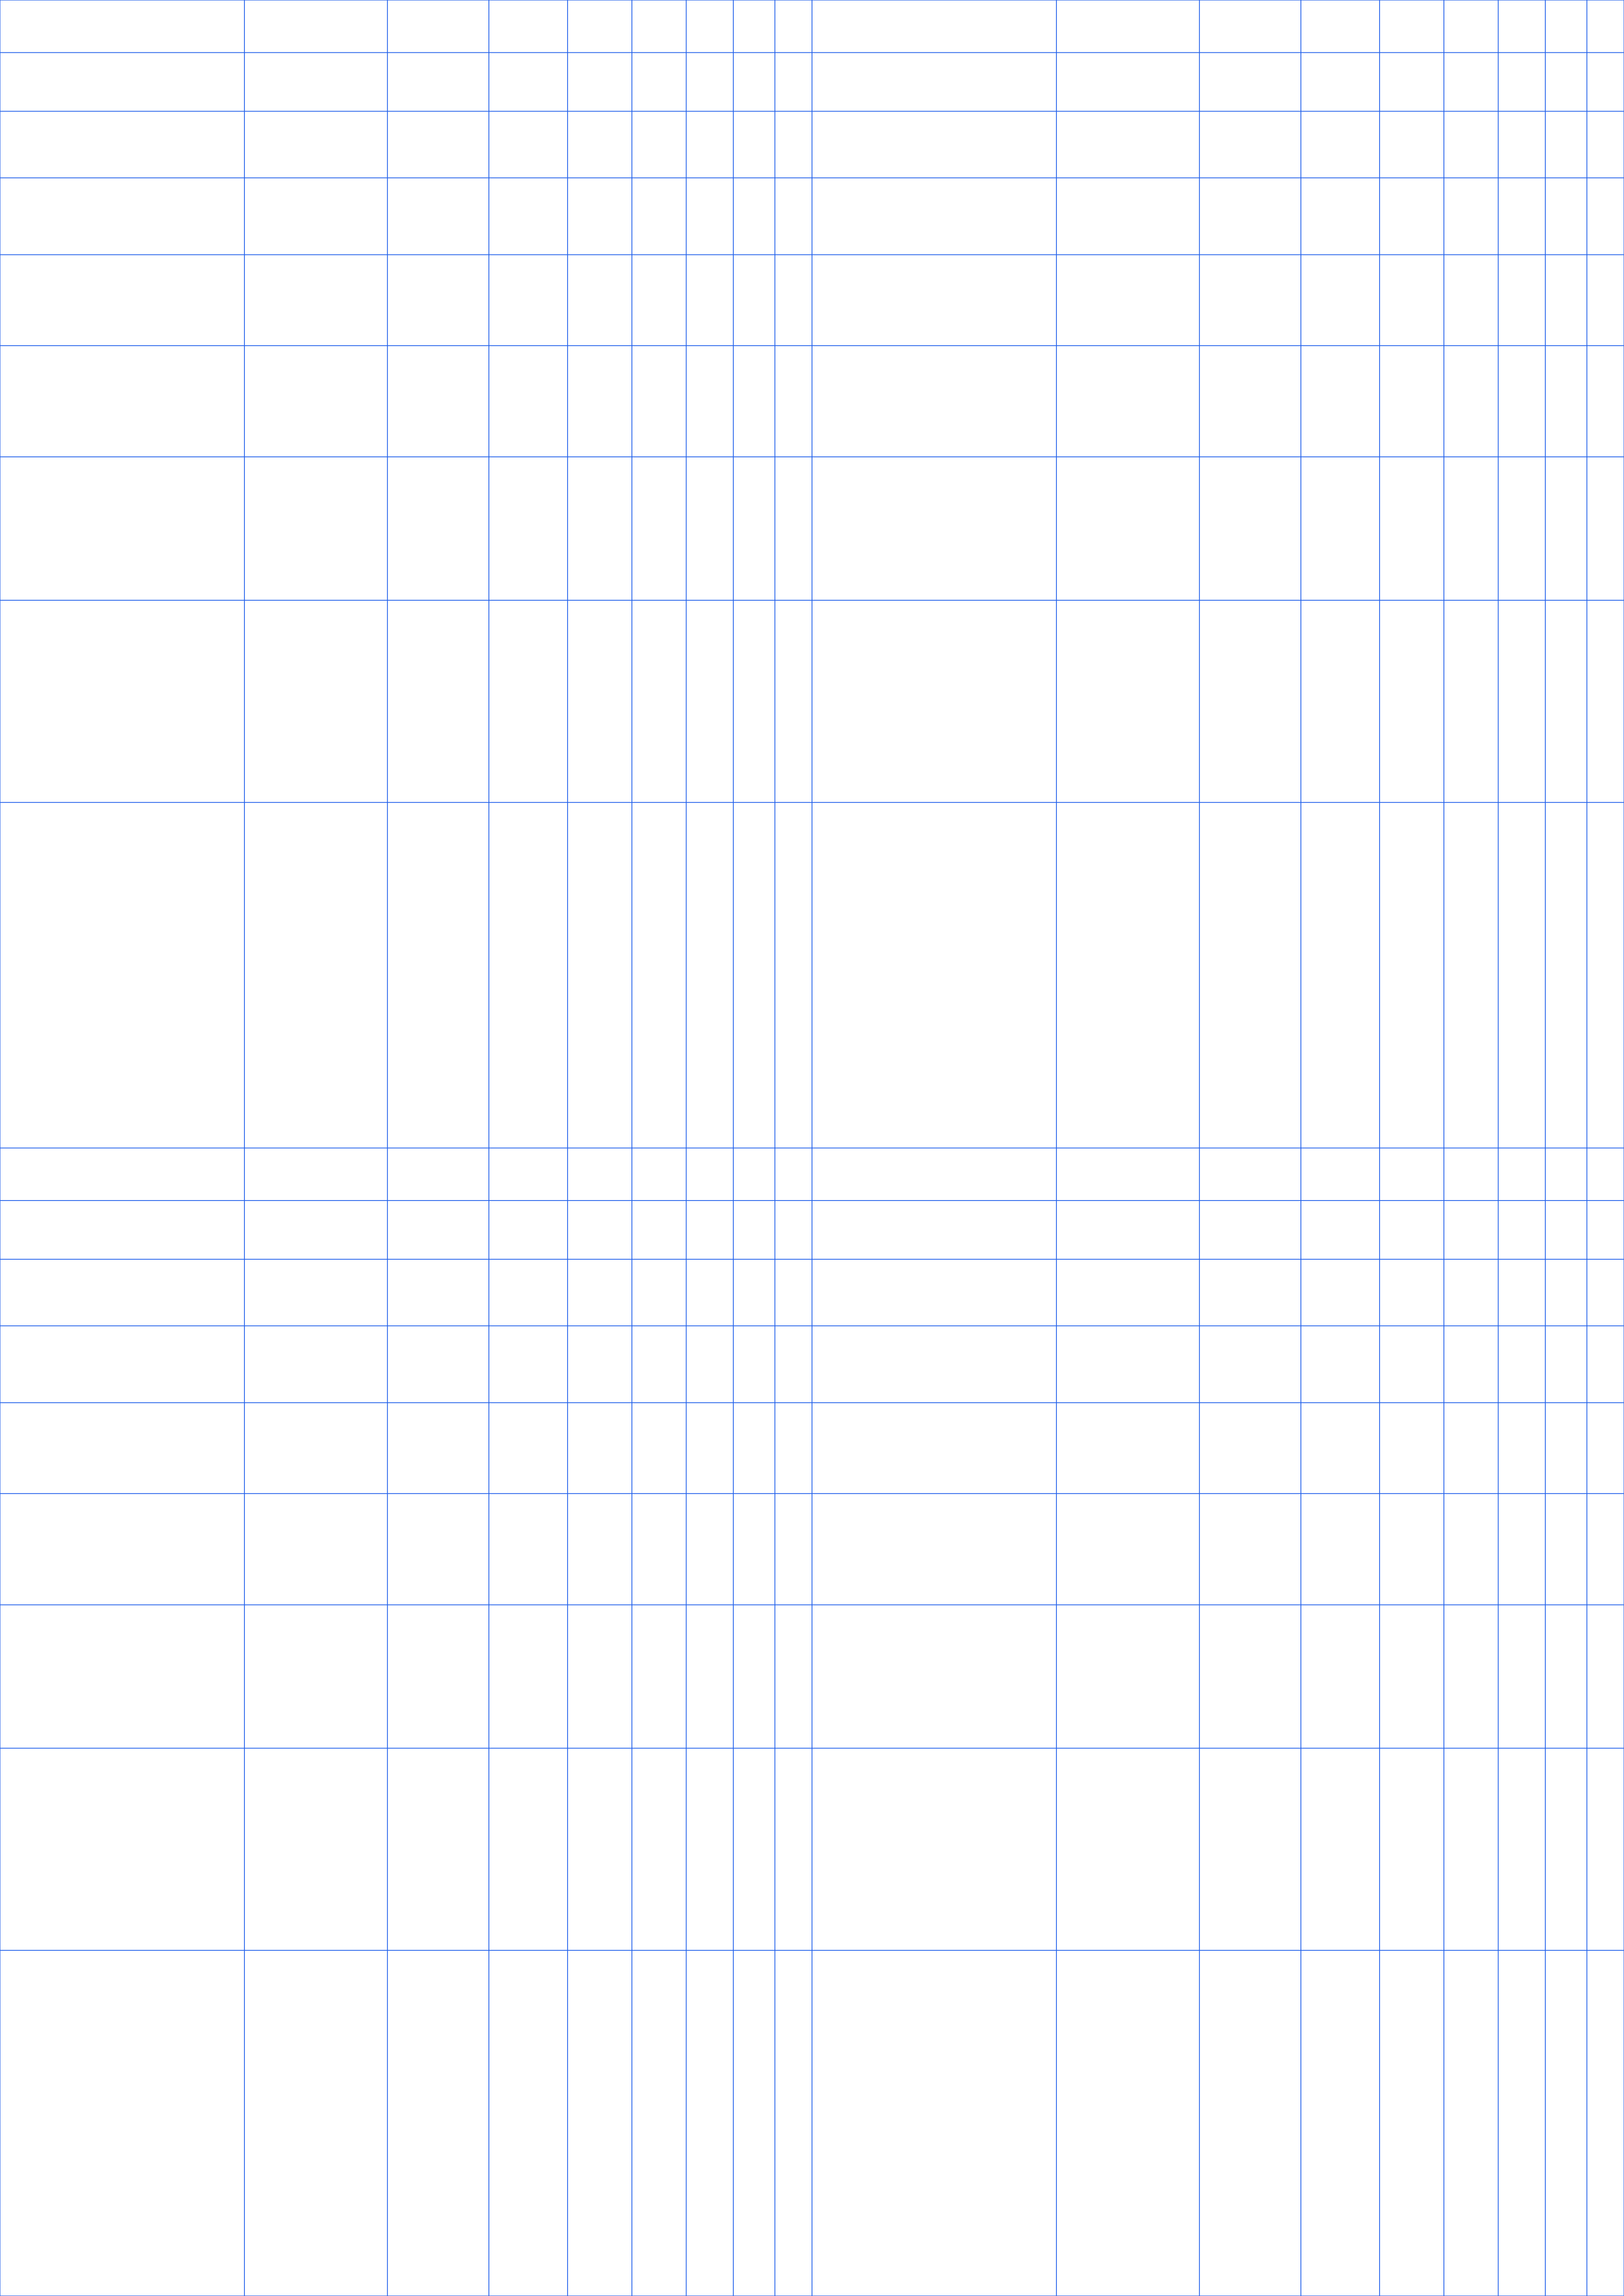
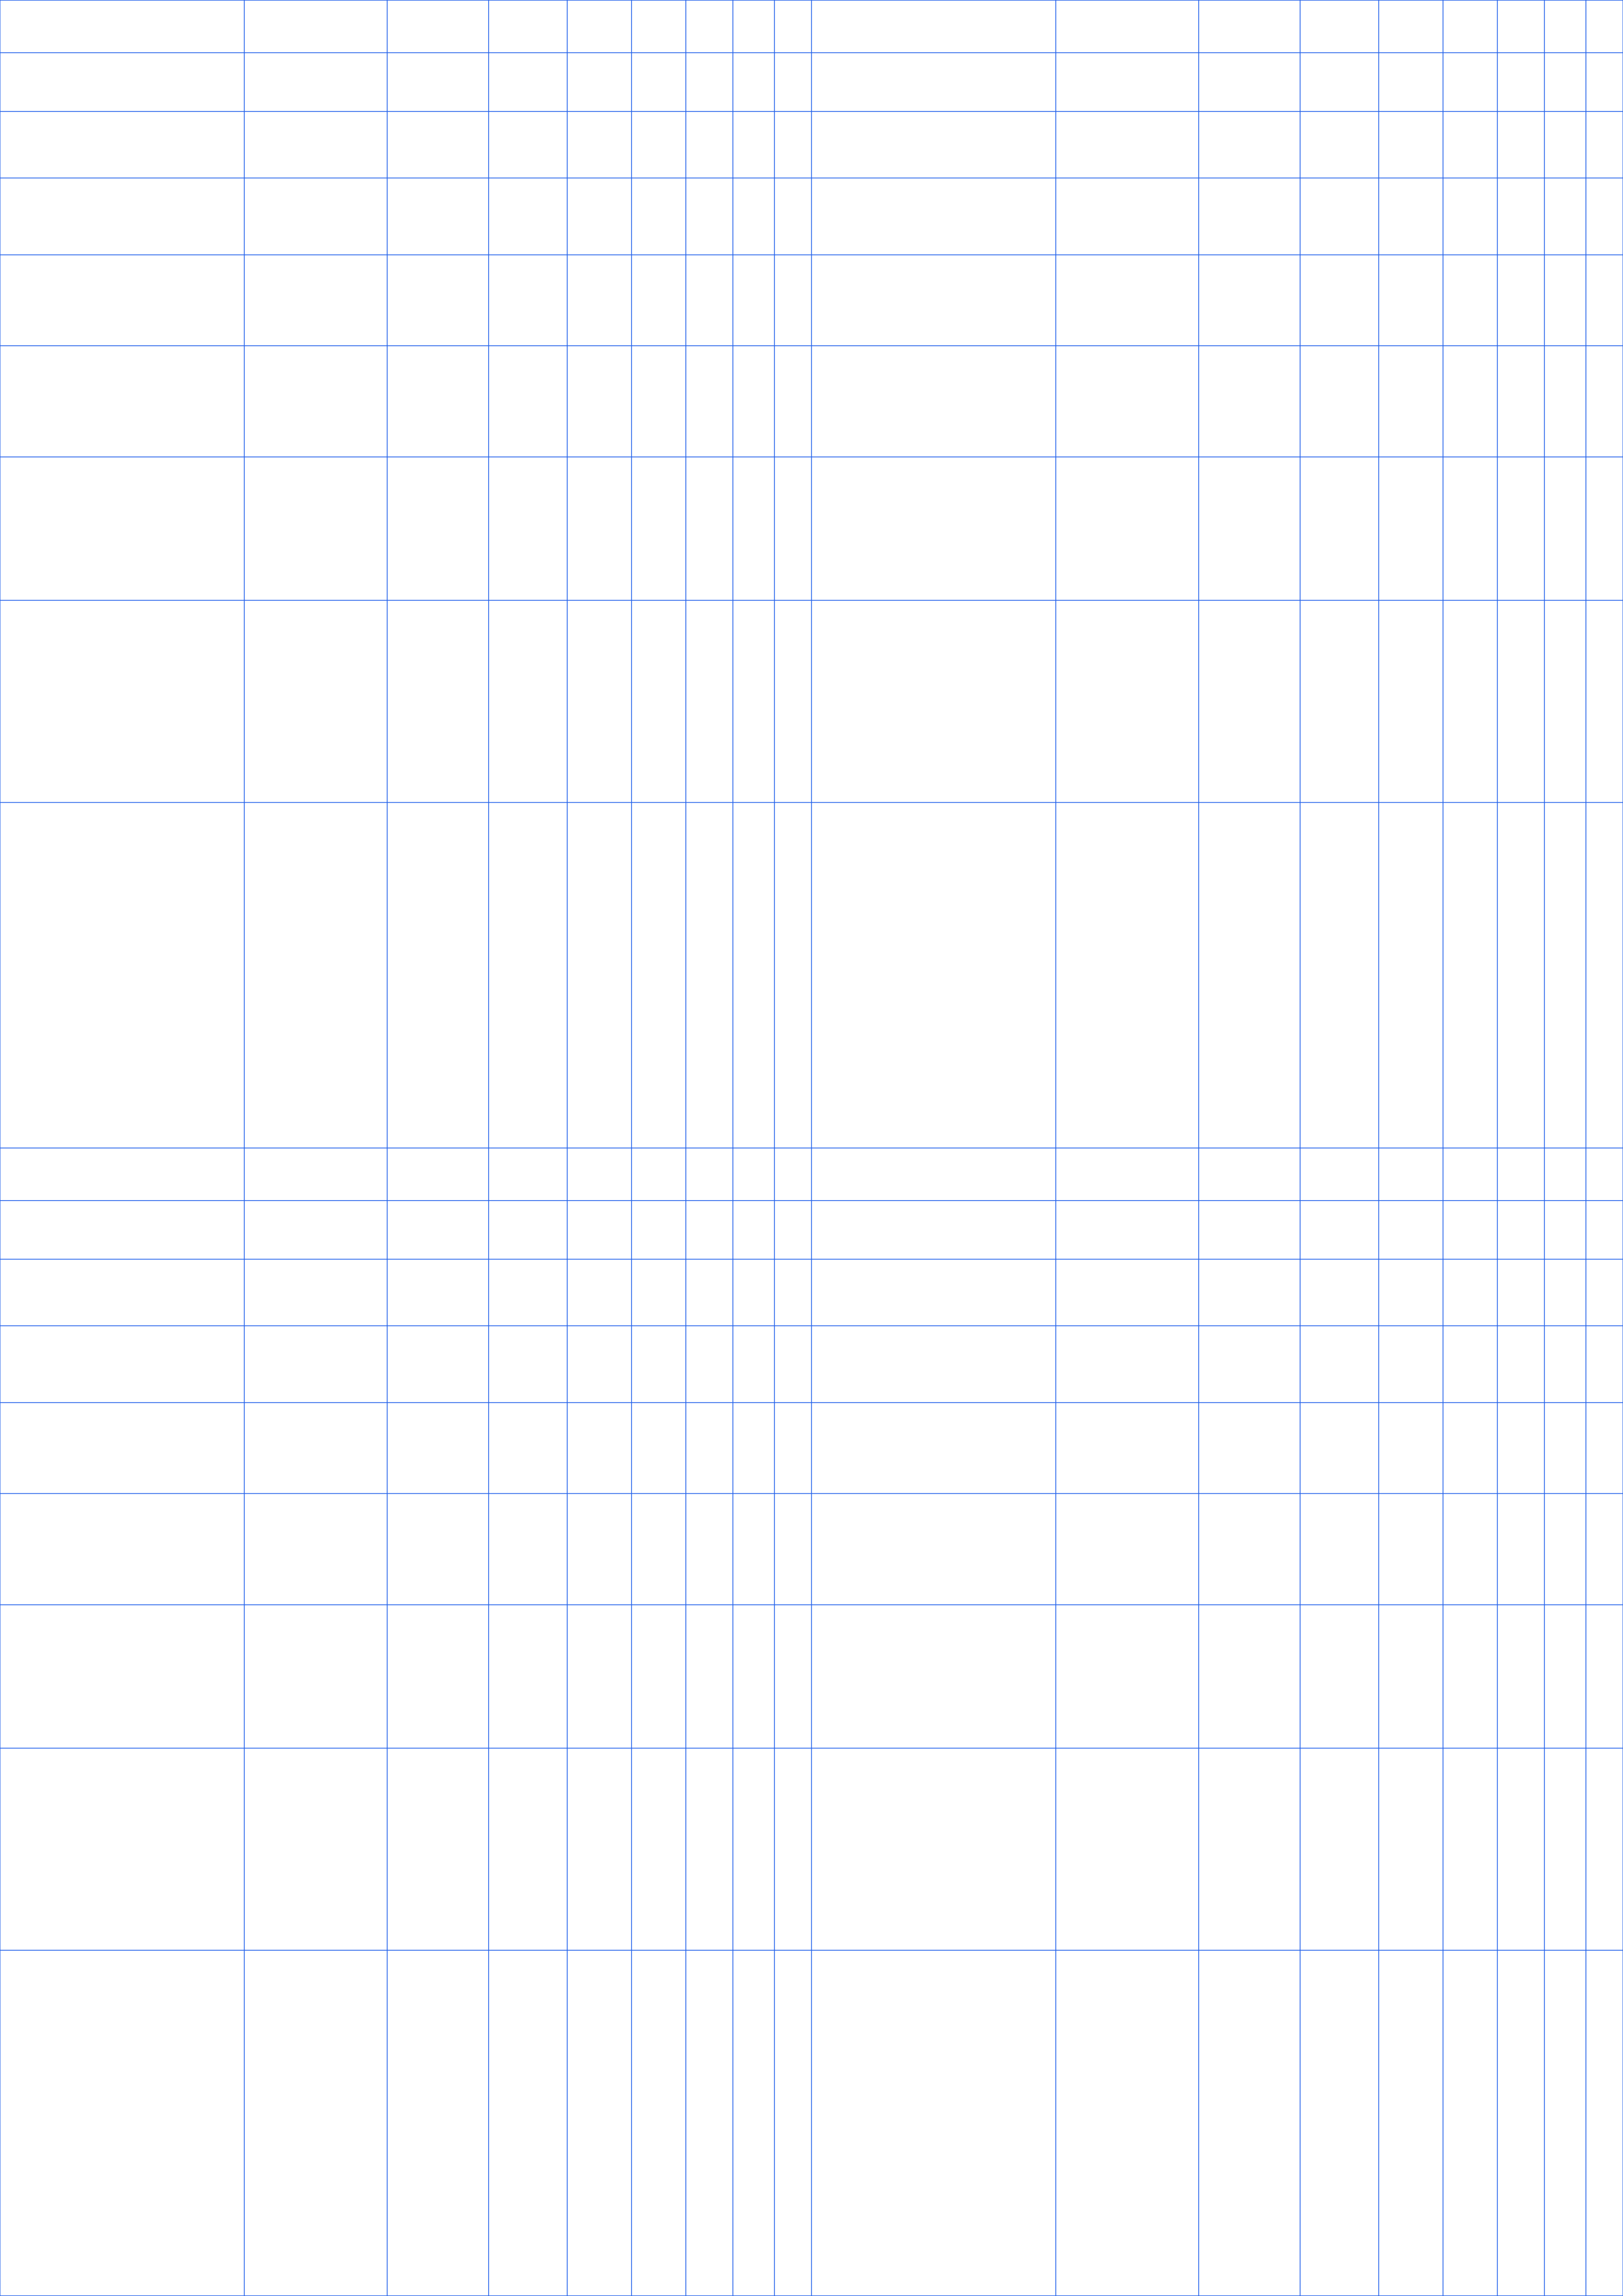
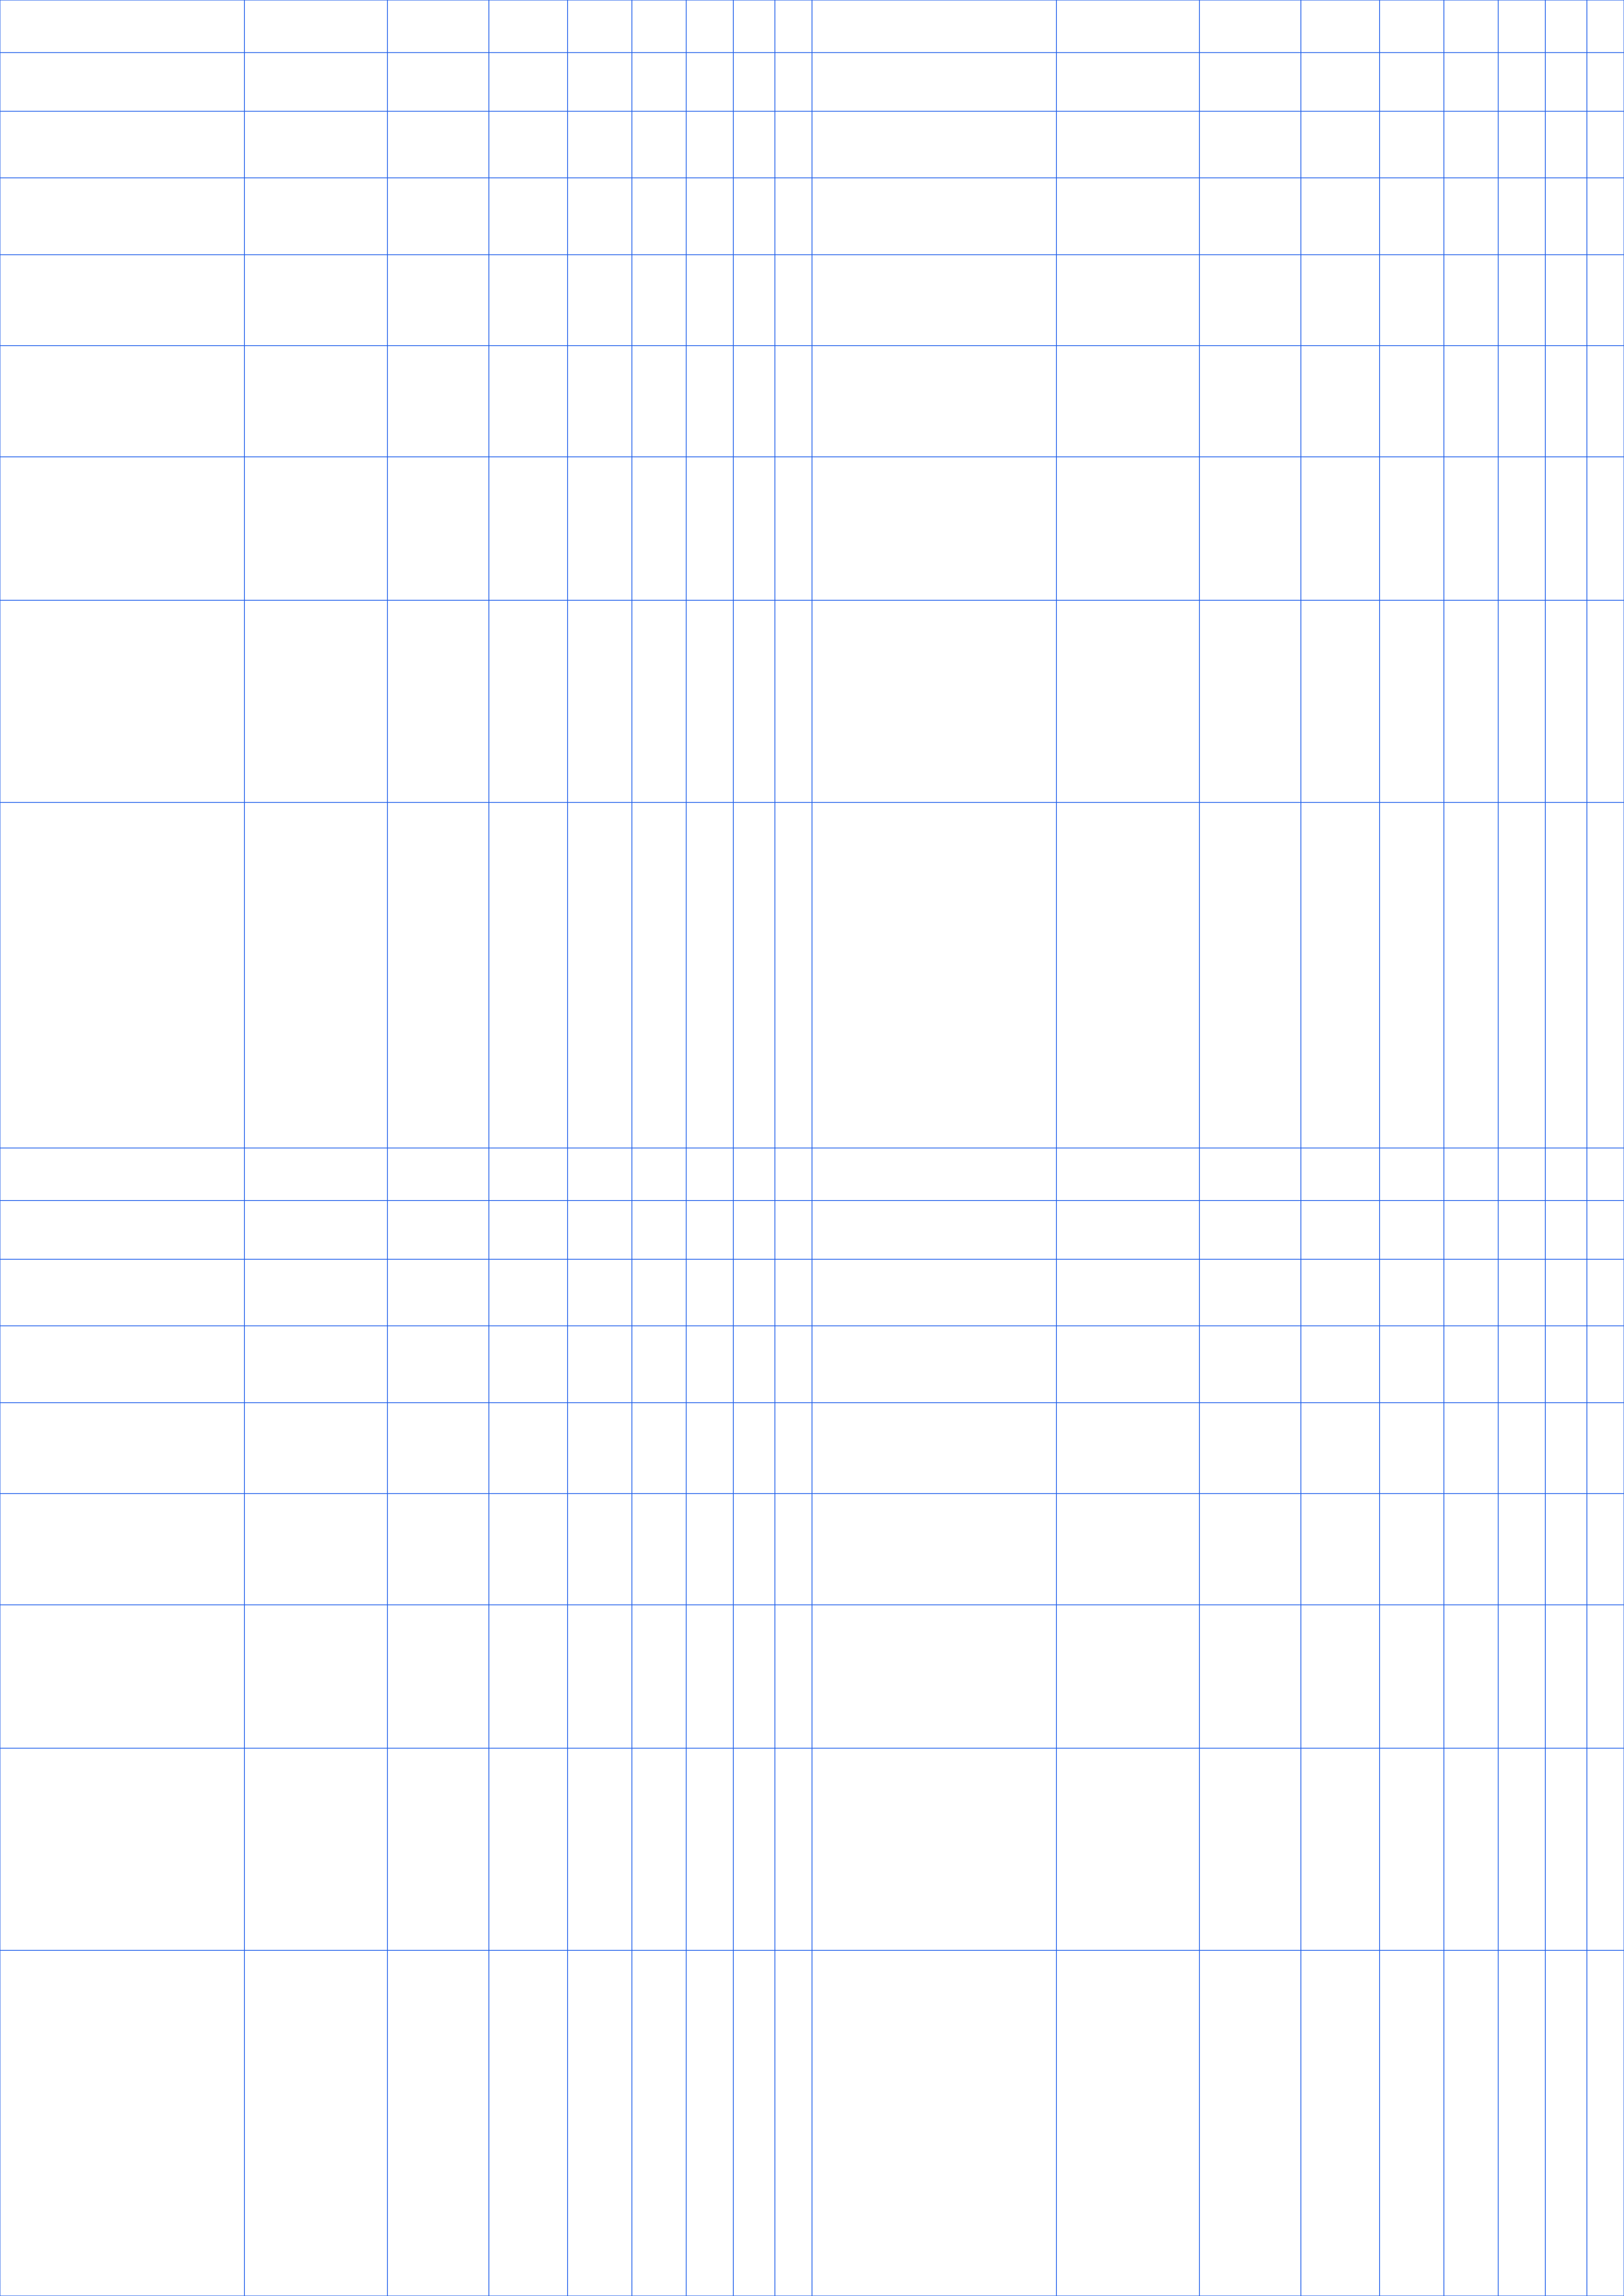
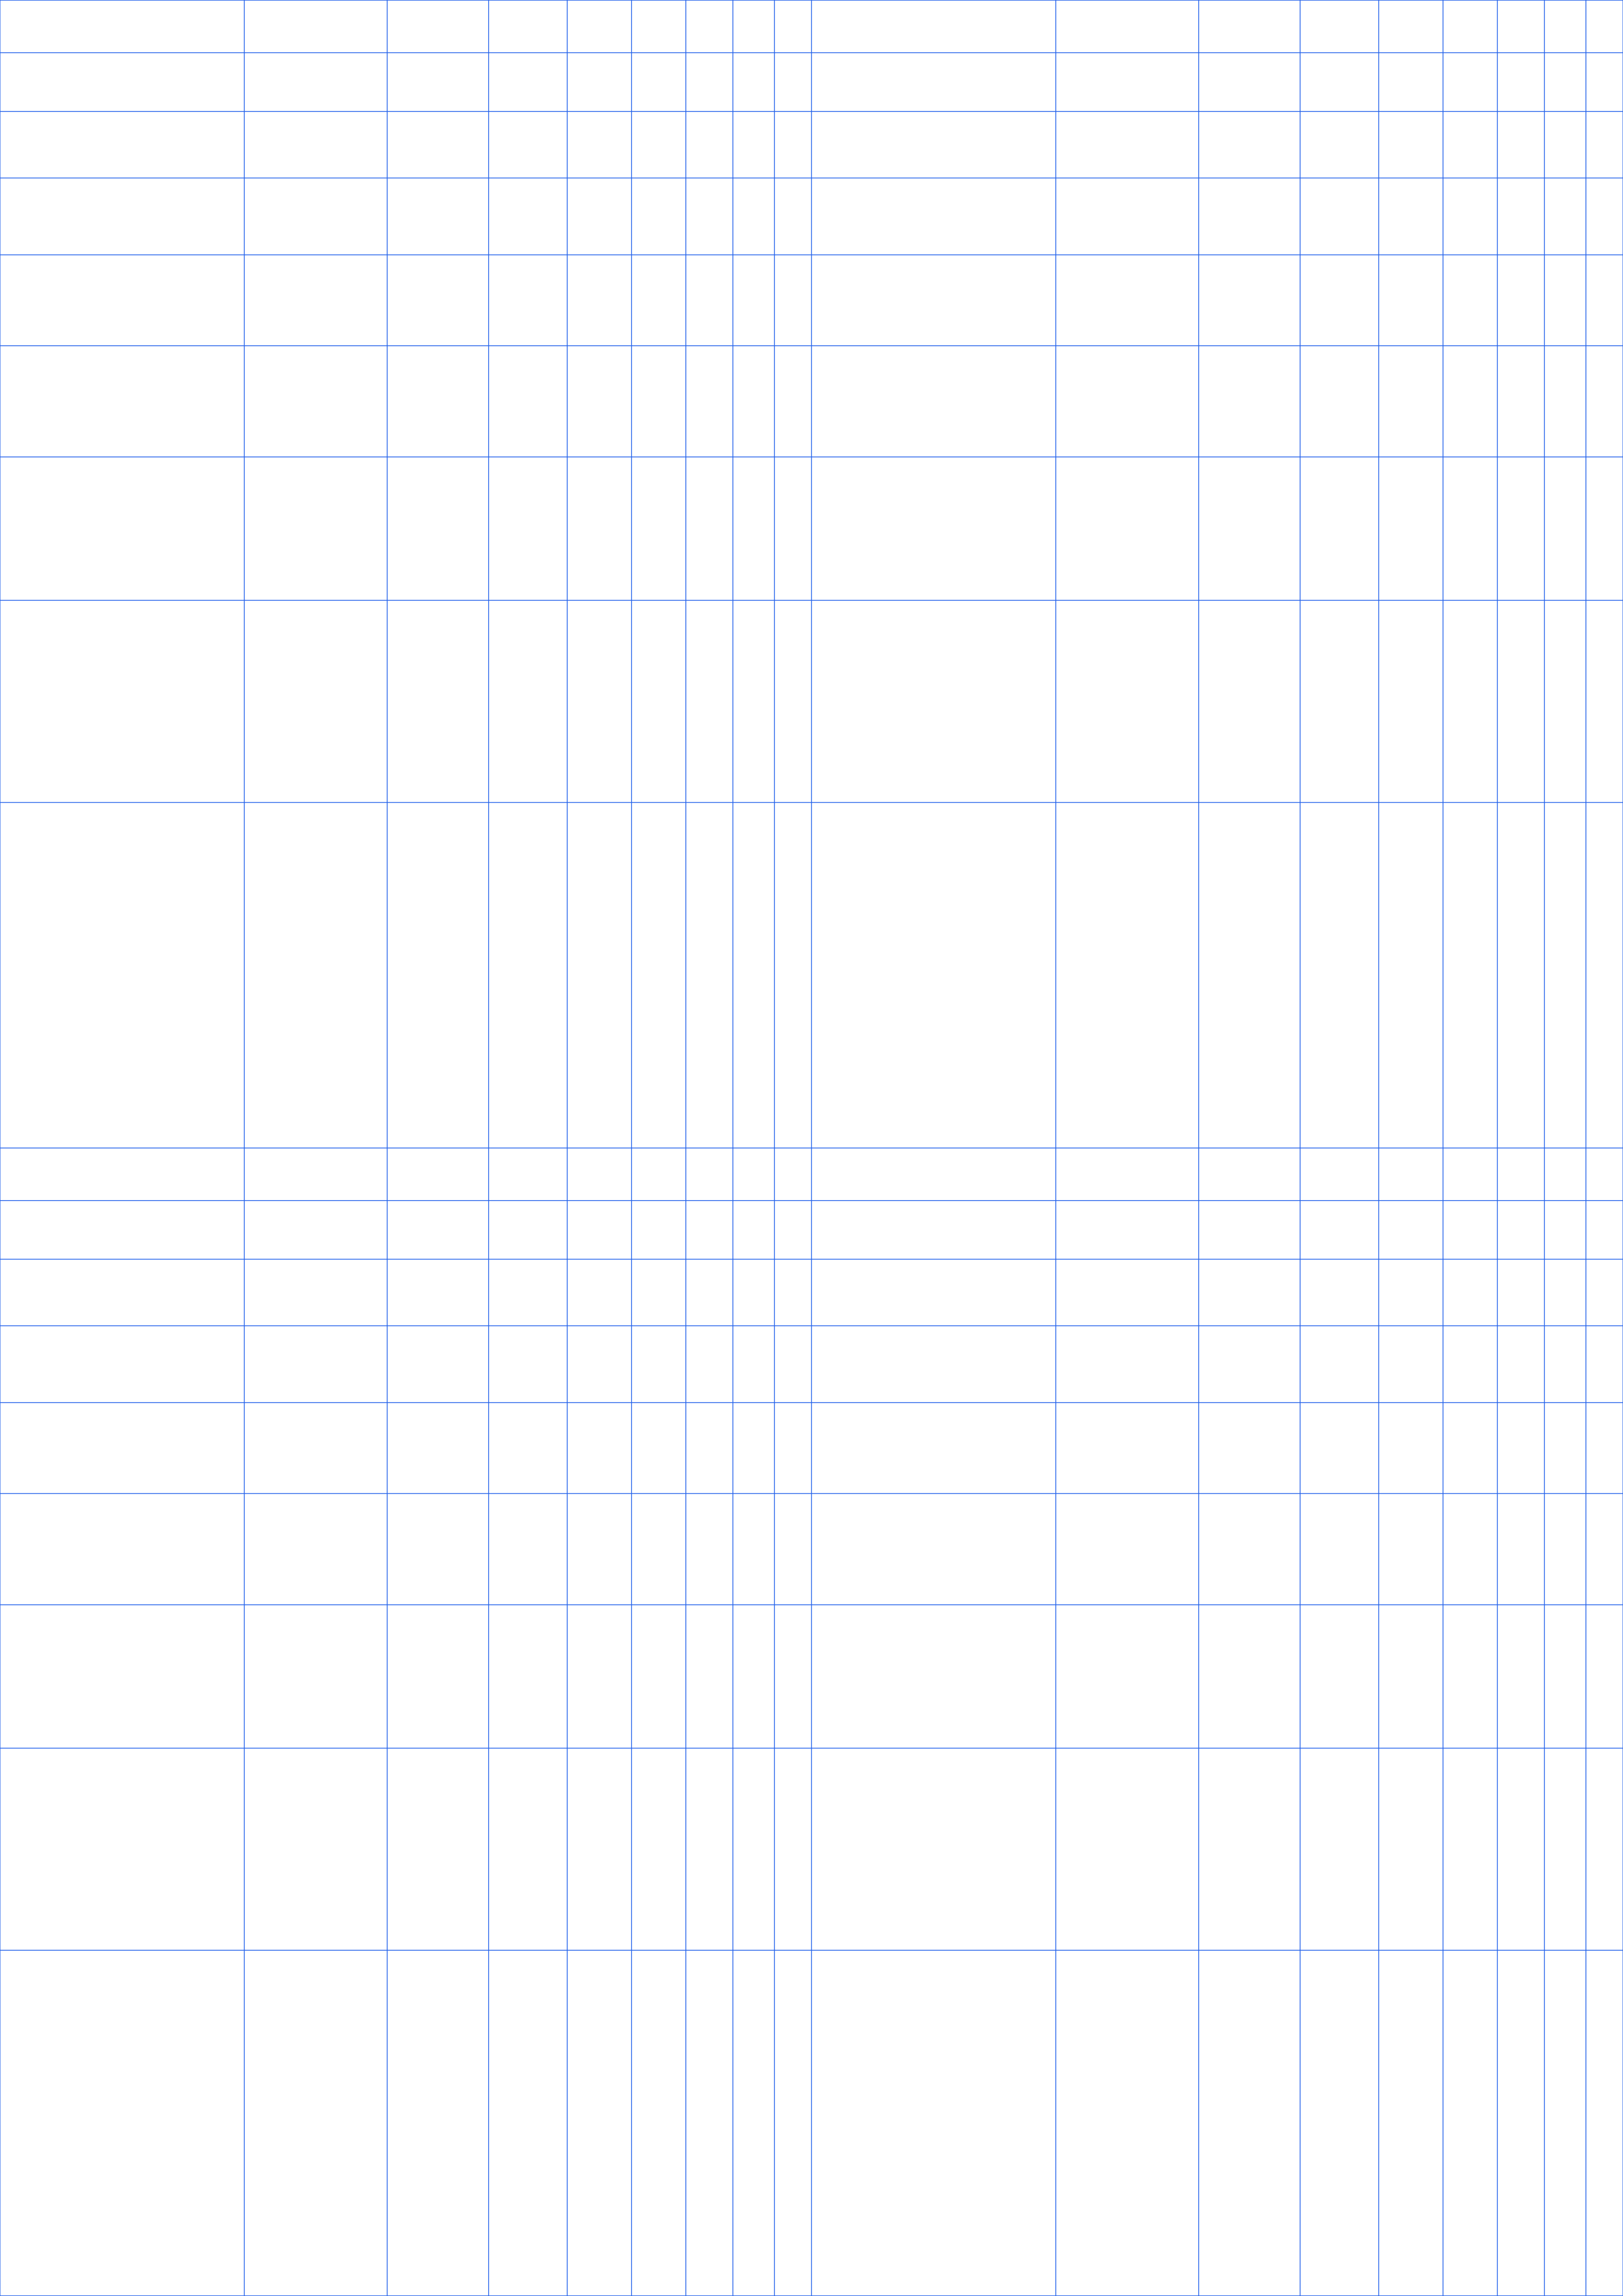
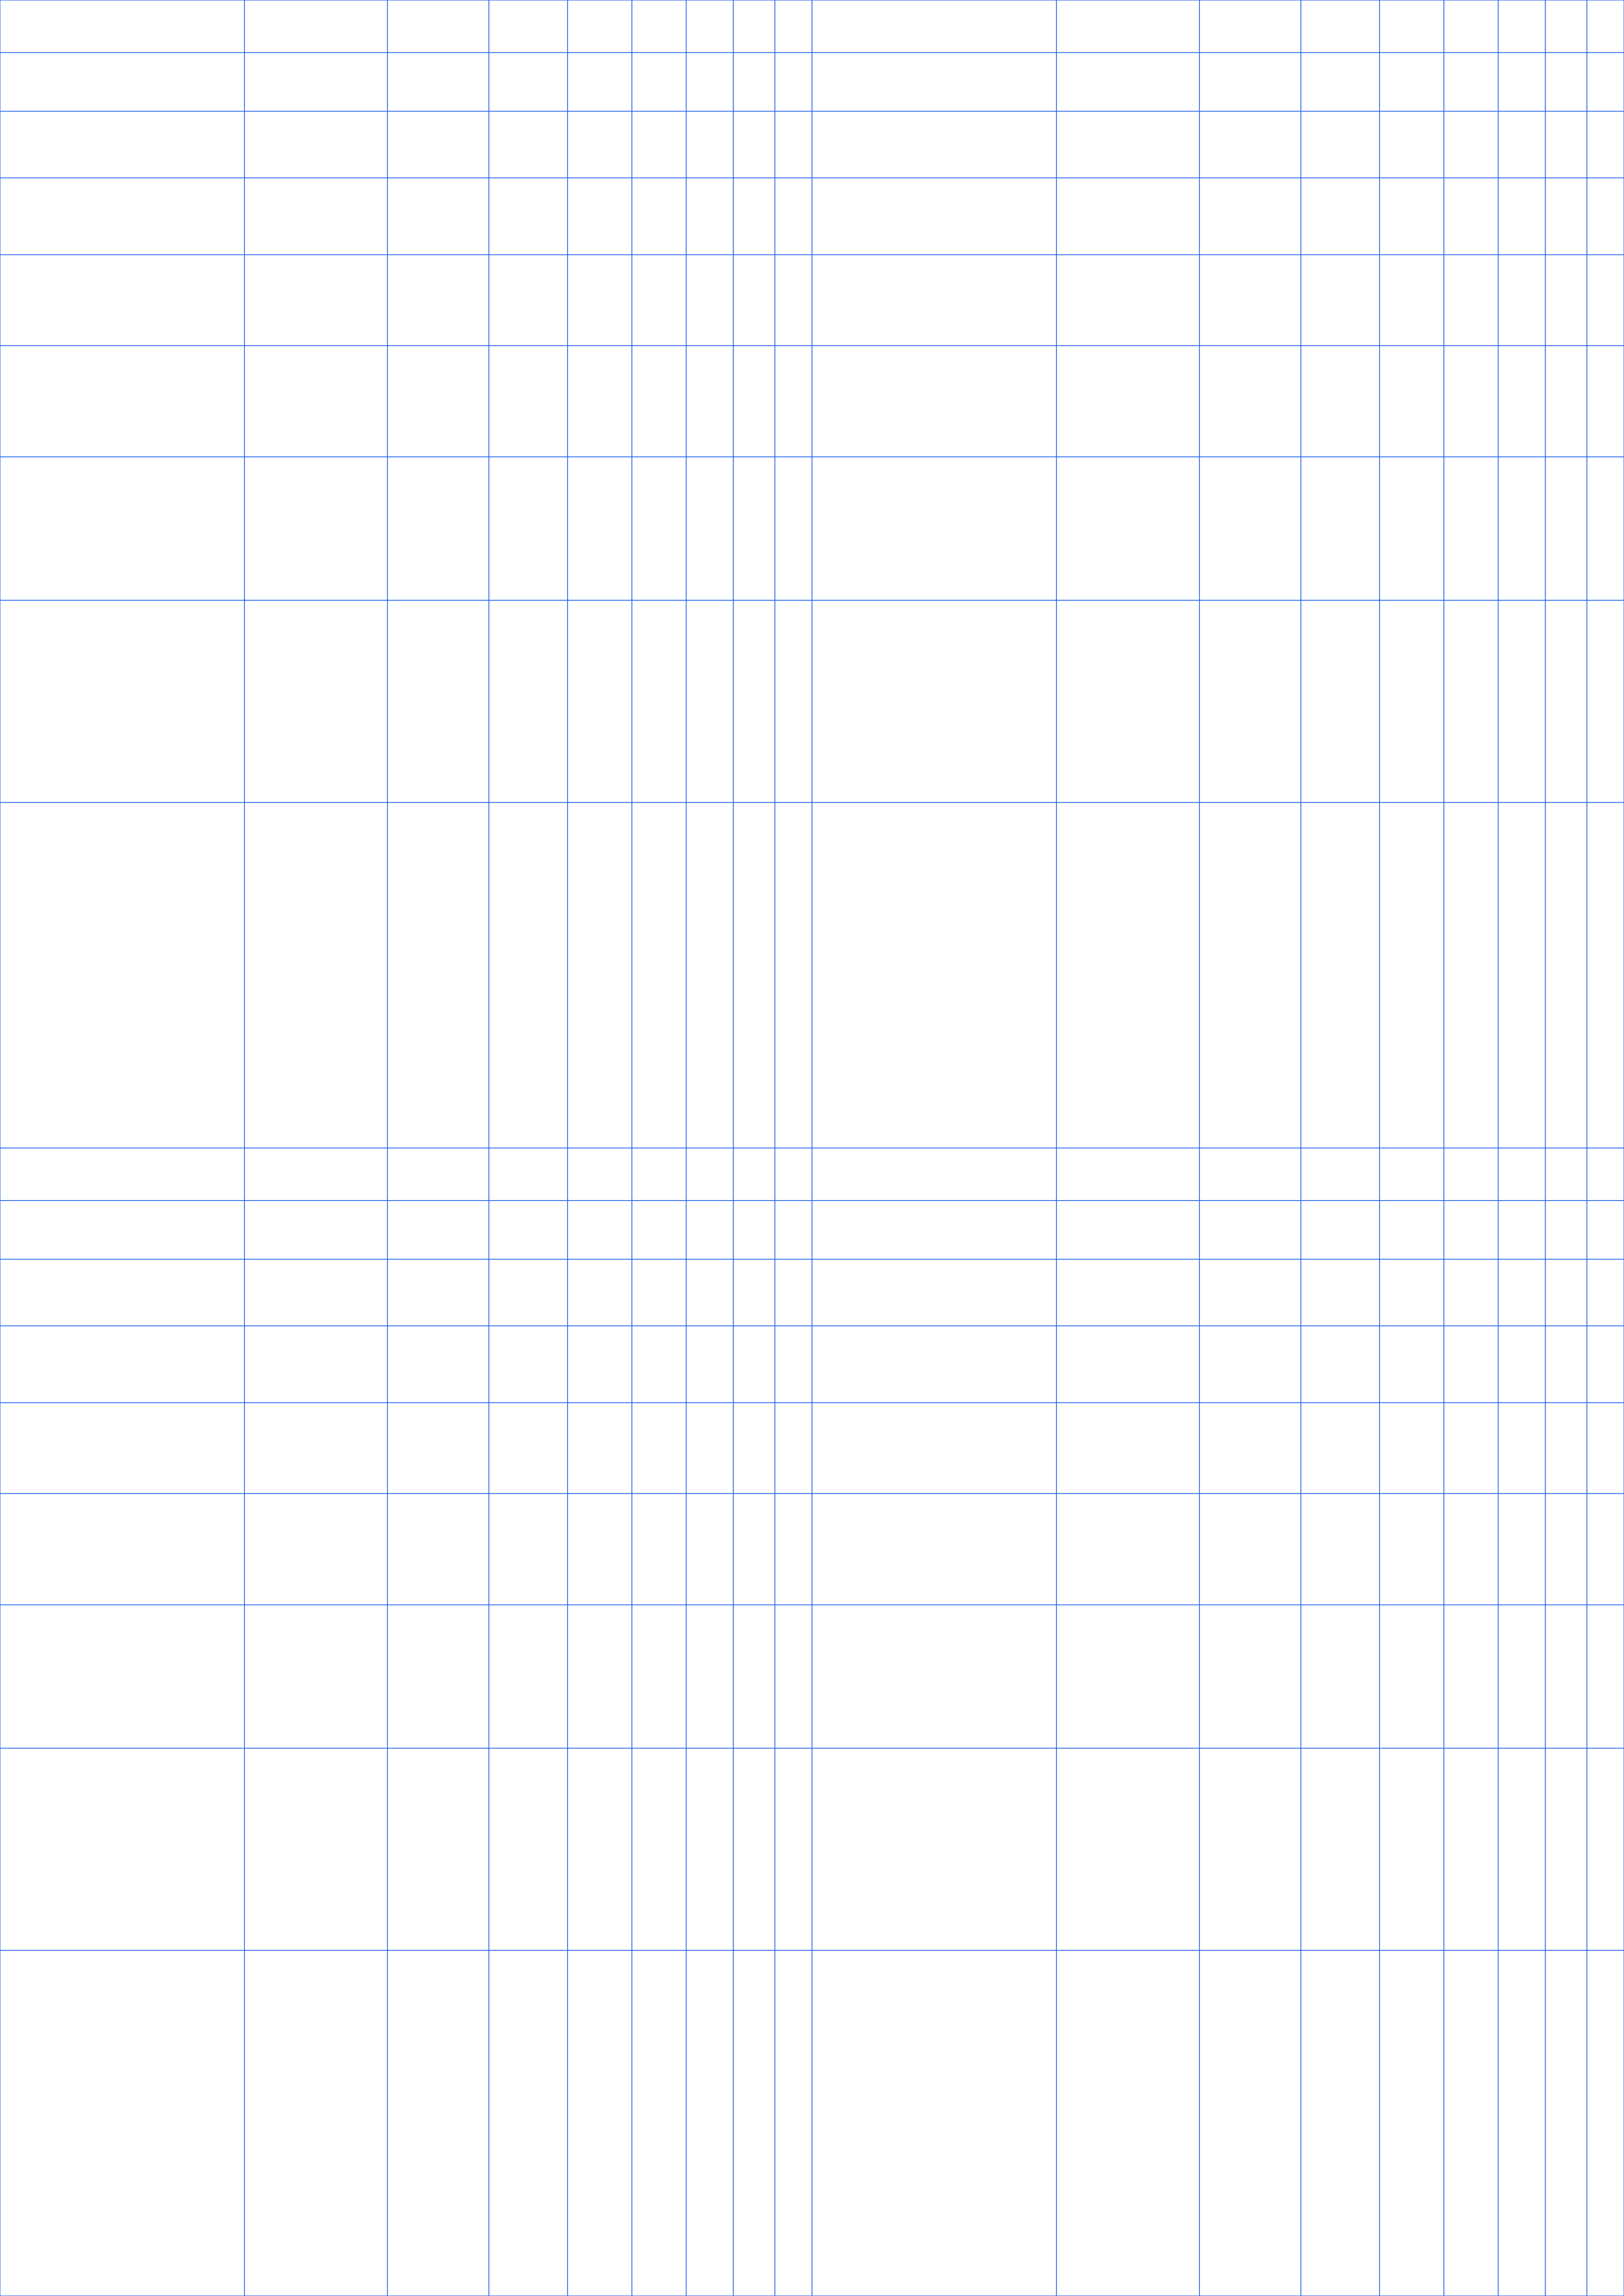
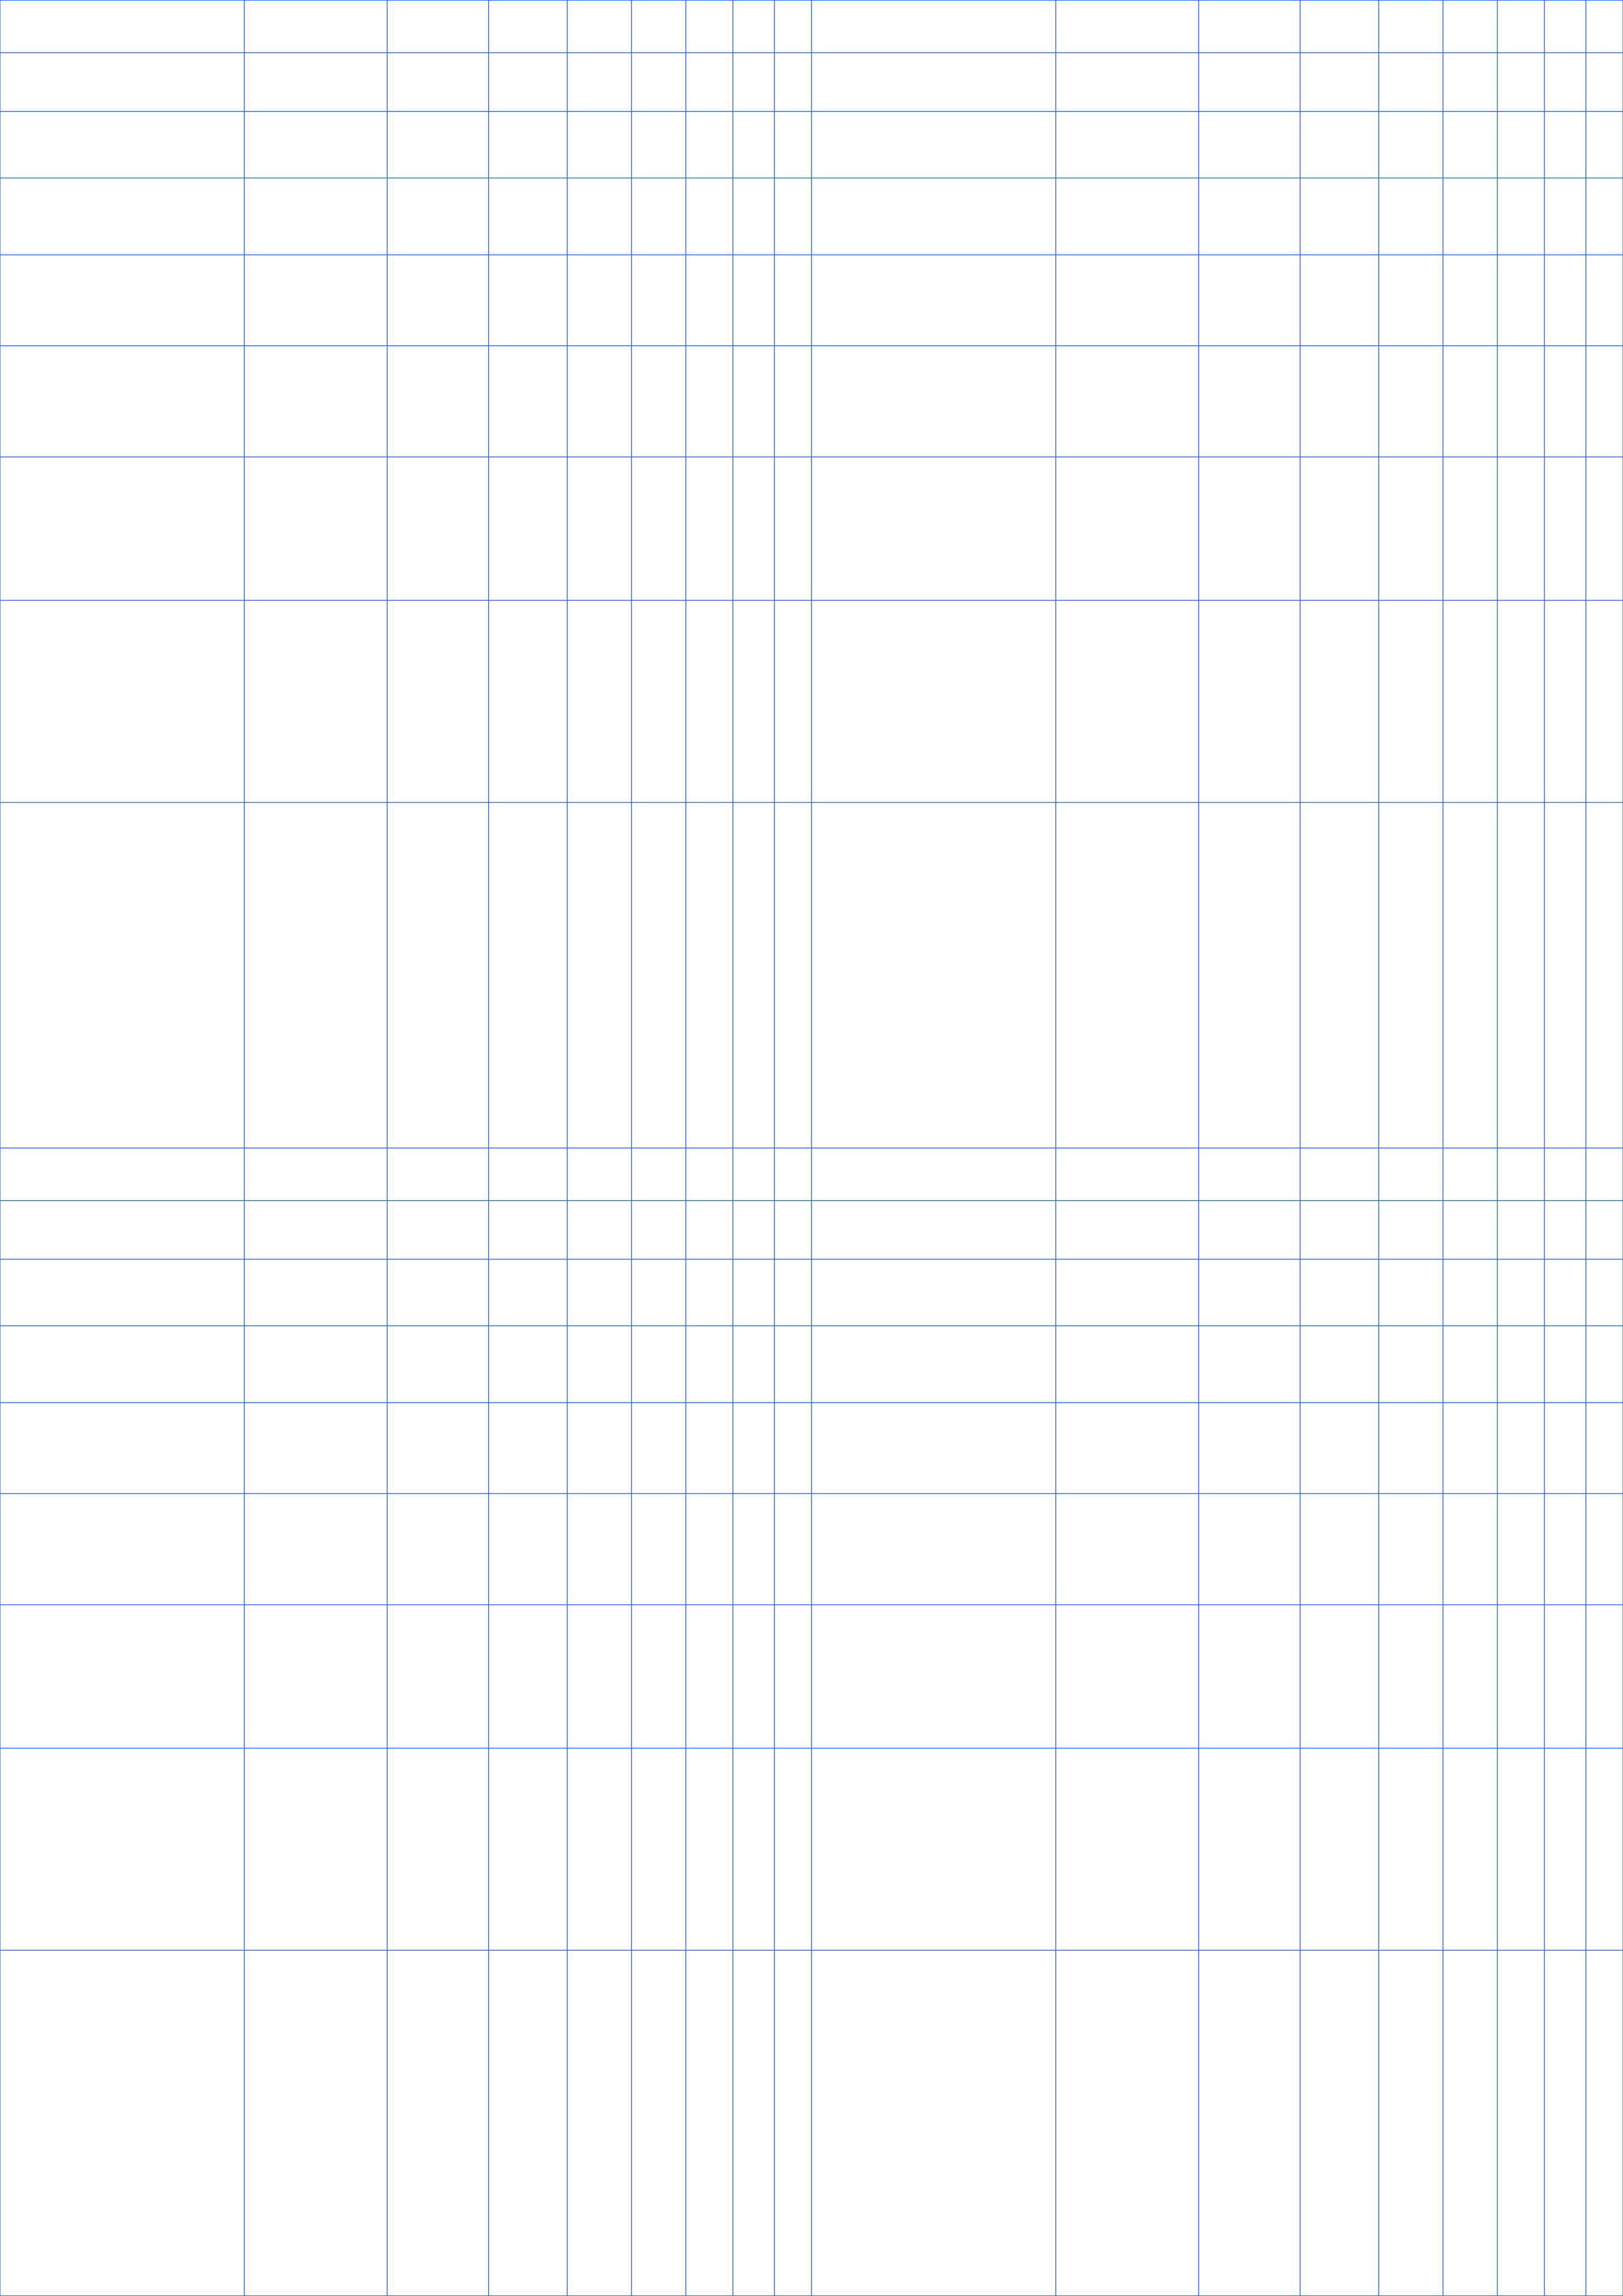
Log-log graph paper has logarithmic scales on both axes, which turns power-law relationships into straight lines. Download log-log templates in 7 sizes for circuit design and physics scaling data — free as PDF, PNG or SVG.
Key takeaways
- Both axes use logarithmic scales, so each equal step multiplies by ten.
- A power relationship plots as a straight line whose slope is the exponent.
- All log-log downloads are free and print at true scale.
Choose the finished page
Match the paper size to your printer, then pick portrait or landscape.
Configure the grid
Pick a theme, then fine-tune spacing, line color, dot size, opacity and margins.
Start from a practical setting
Jump to a ready template, then fine-tune the settings from there.
Log-Log Graph Paper Templates
Ready-made log-log graph paper pages — click a card to load the preset, or grab the PDF and PNG directly.
How to use log-log graph paper
What is log-log graph paper?
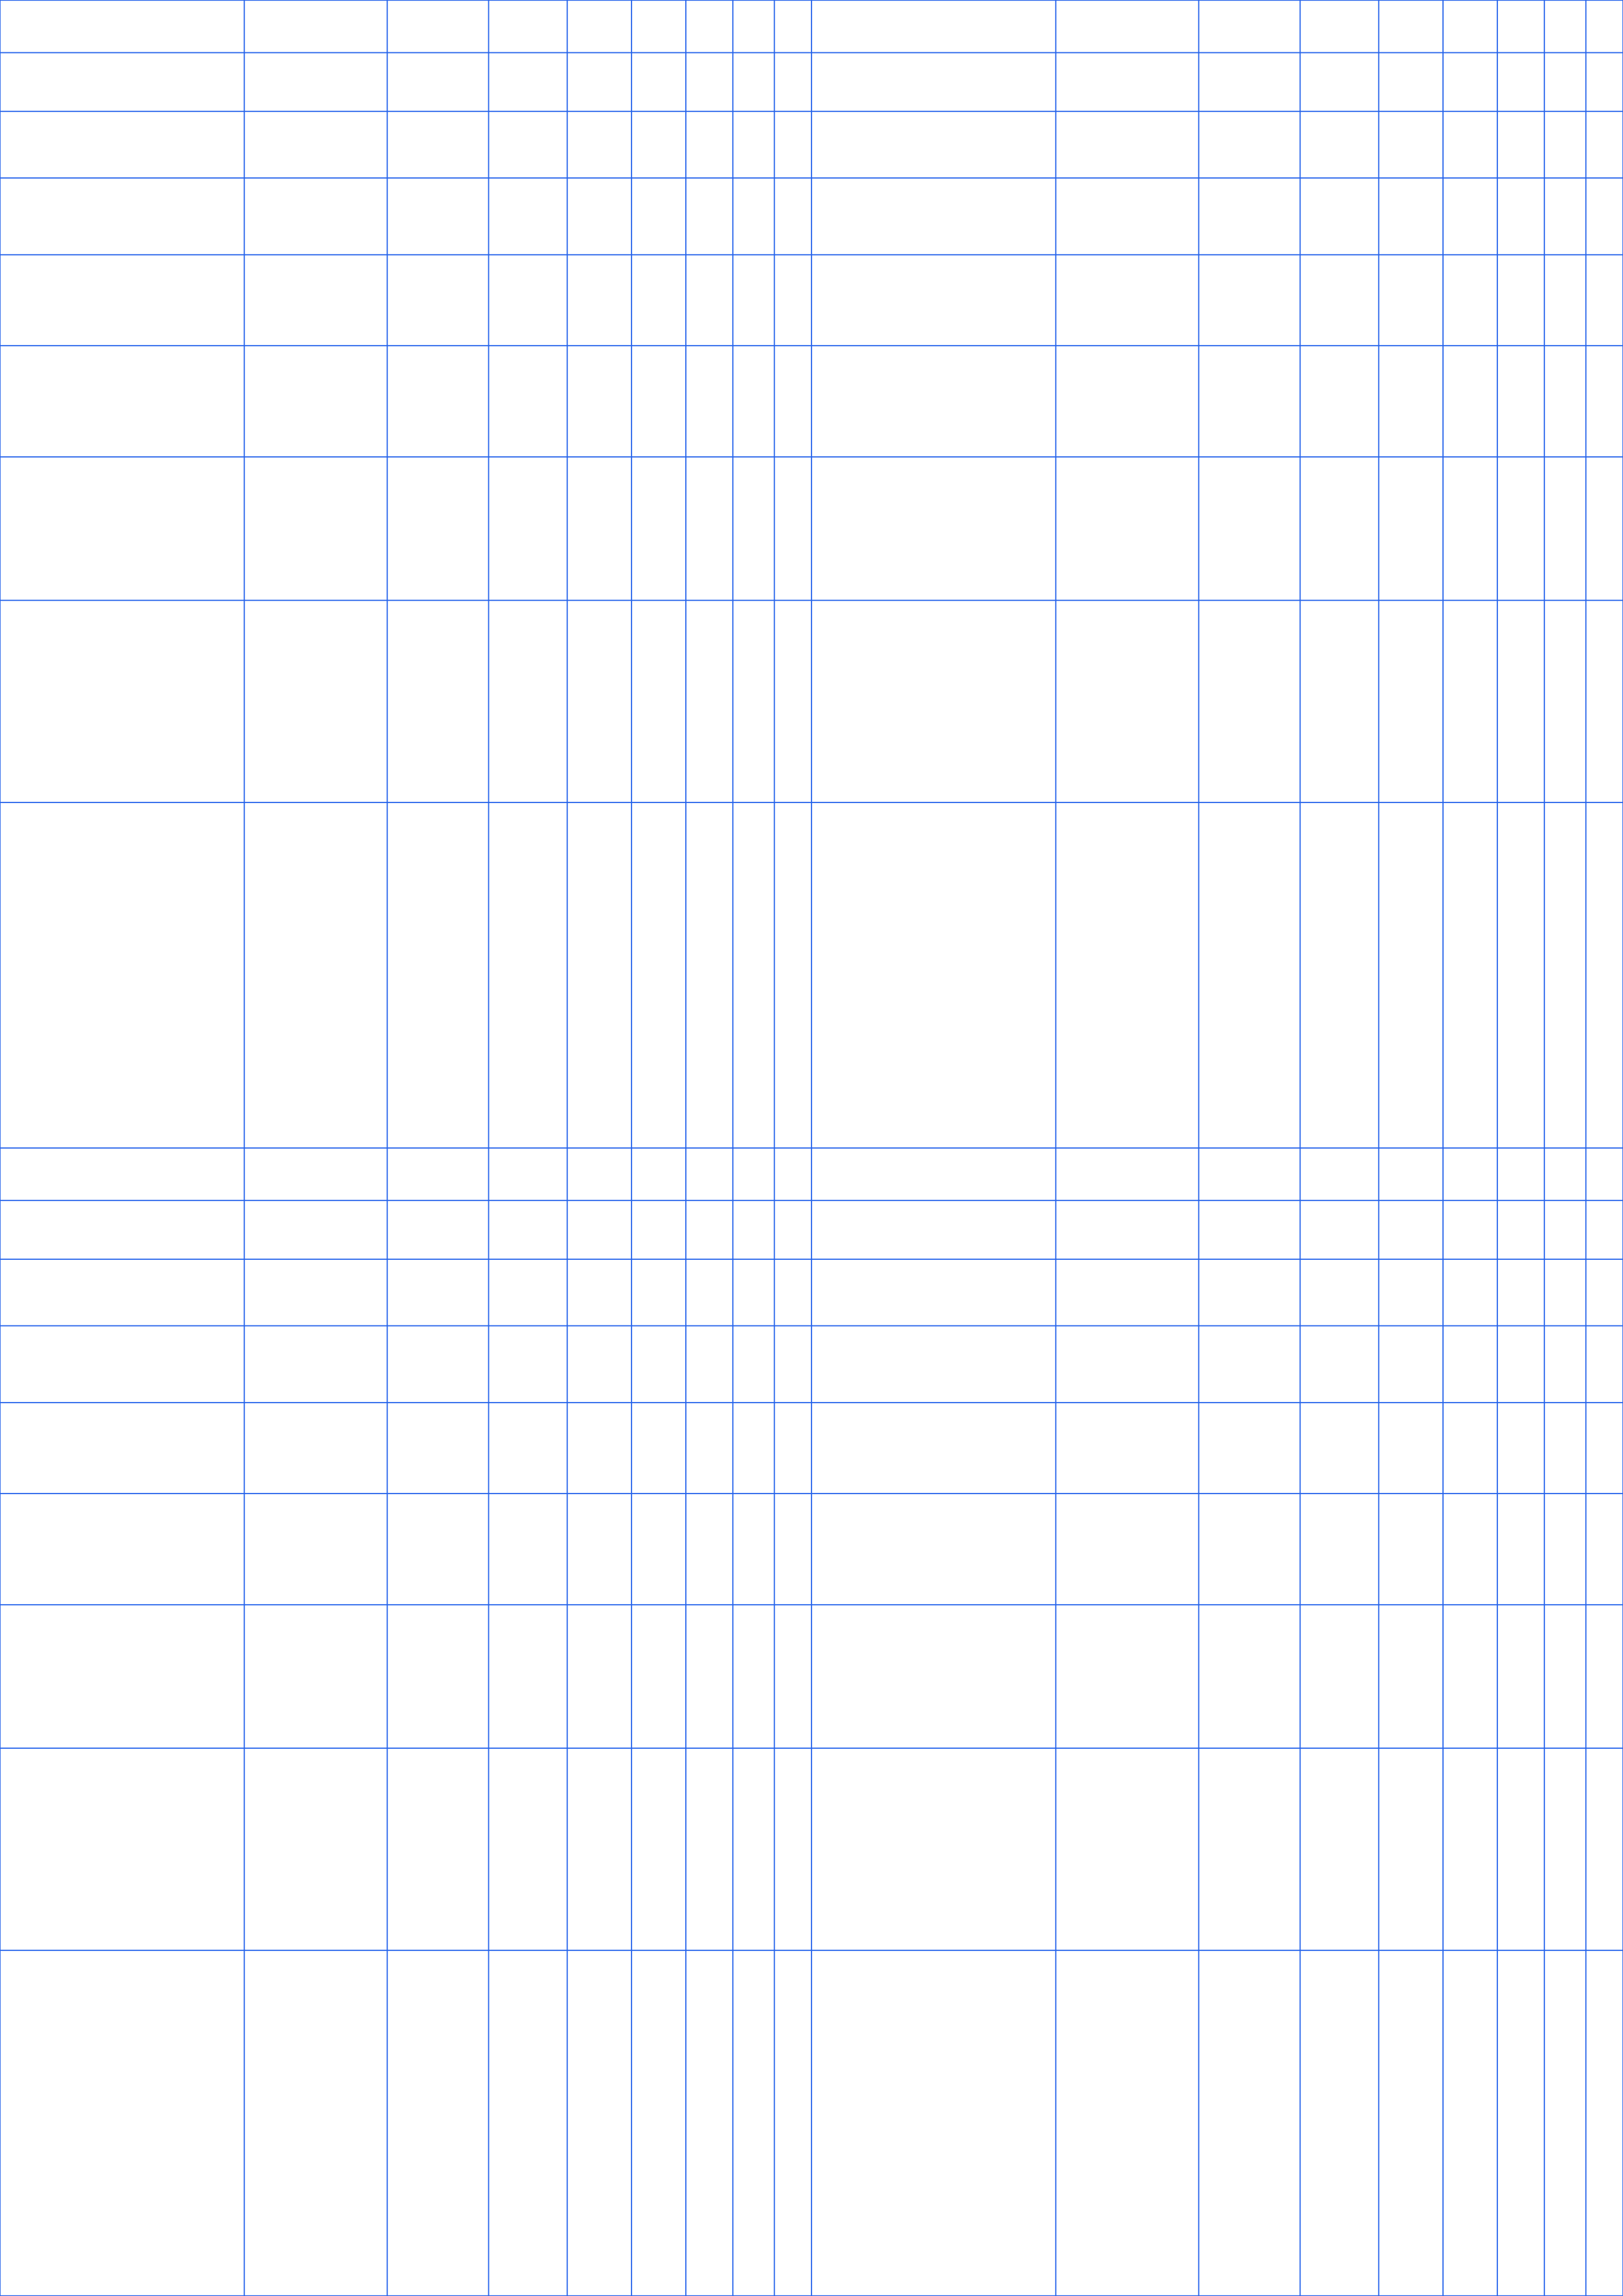
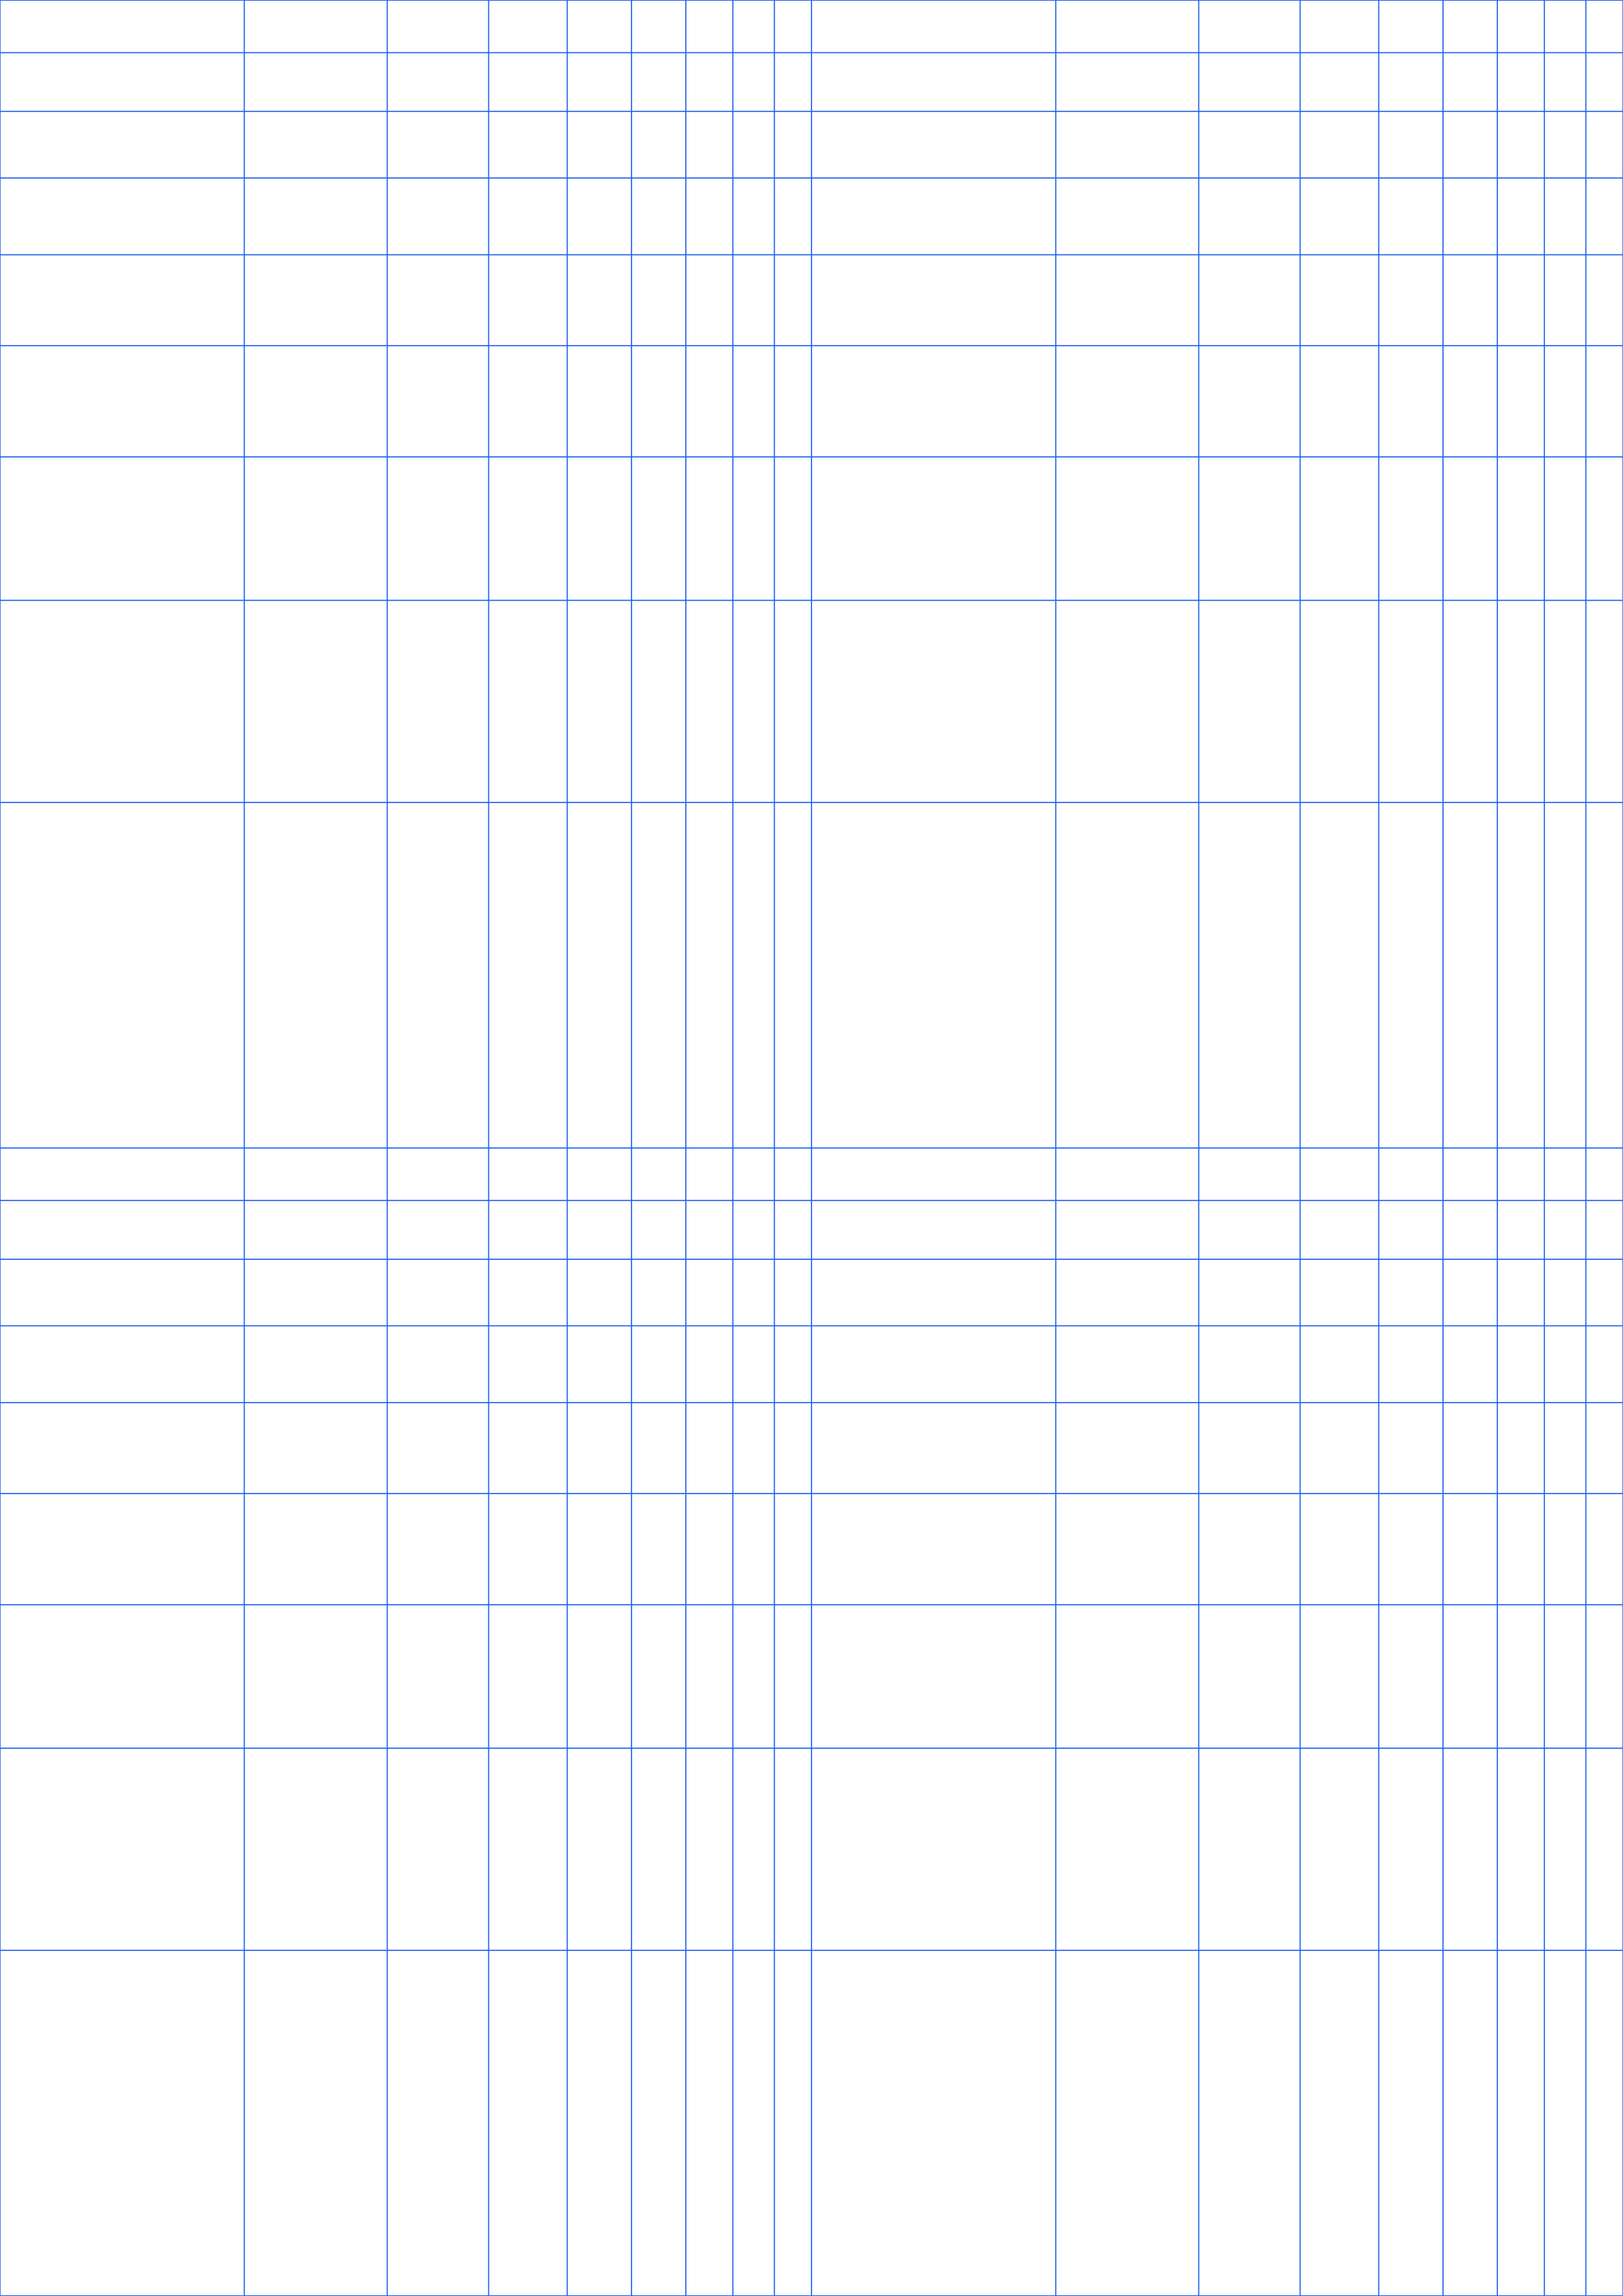
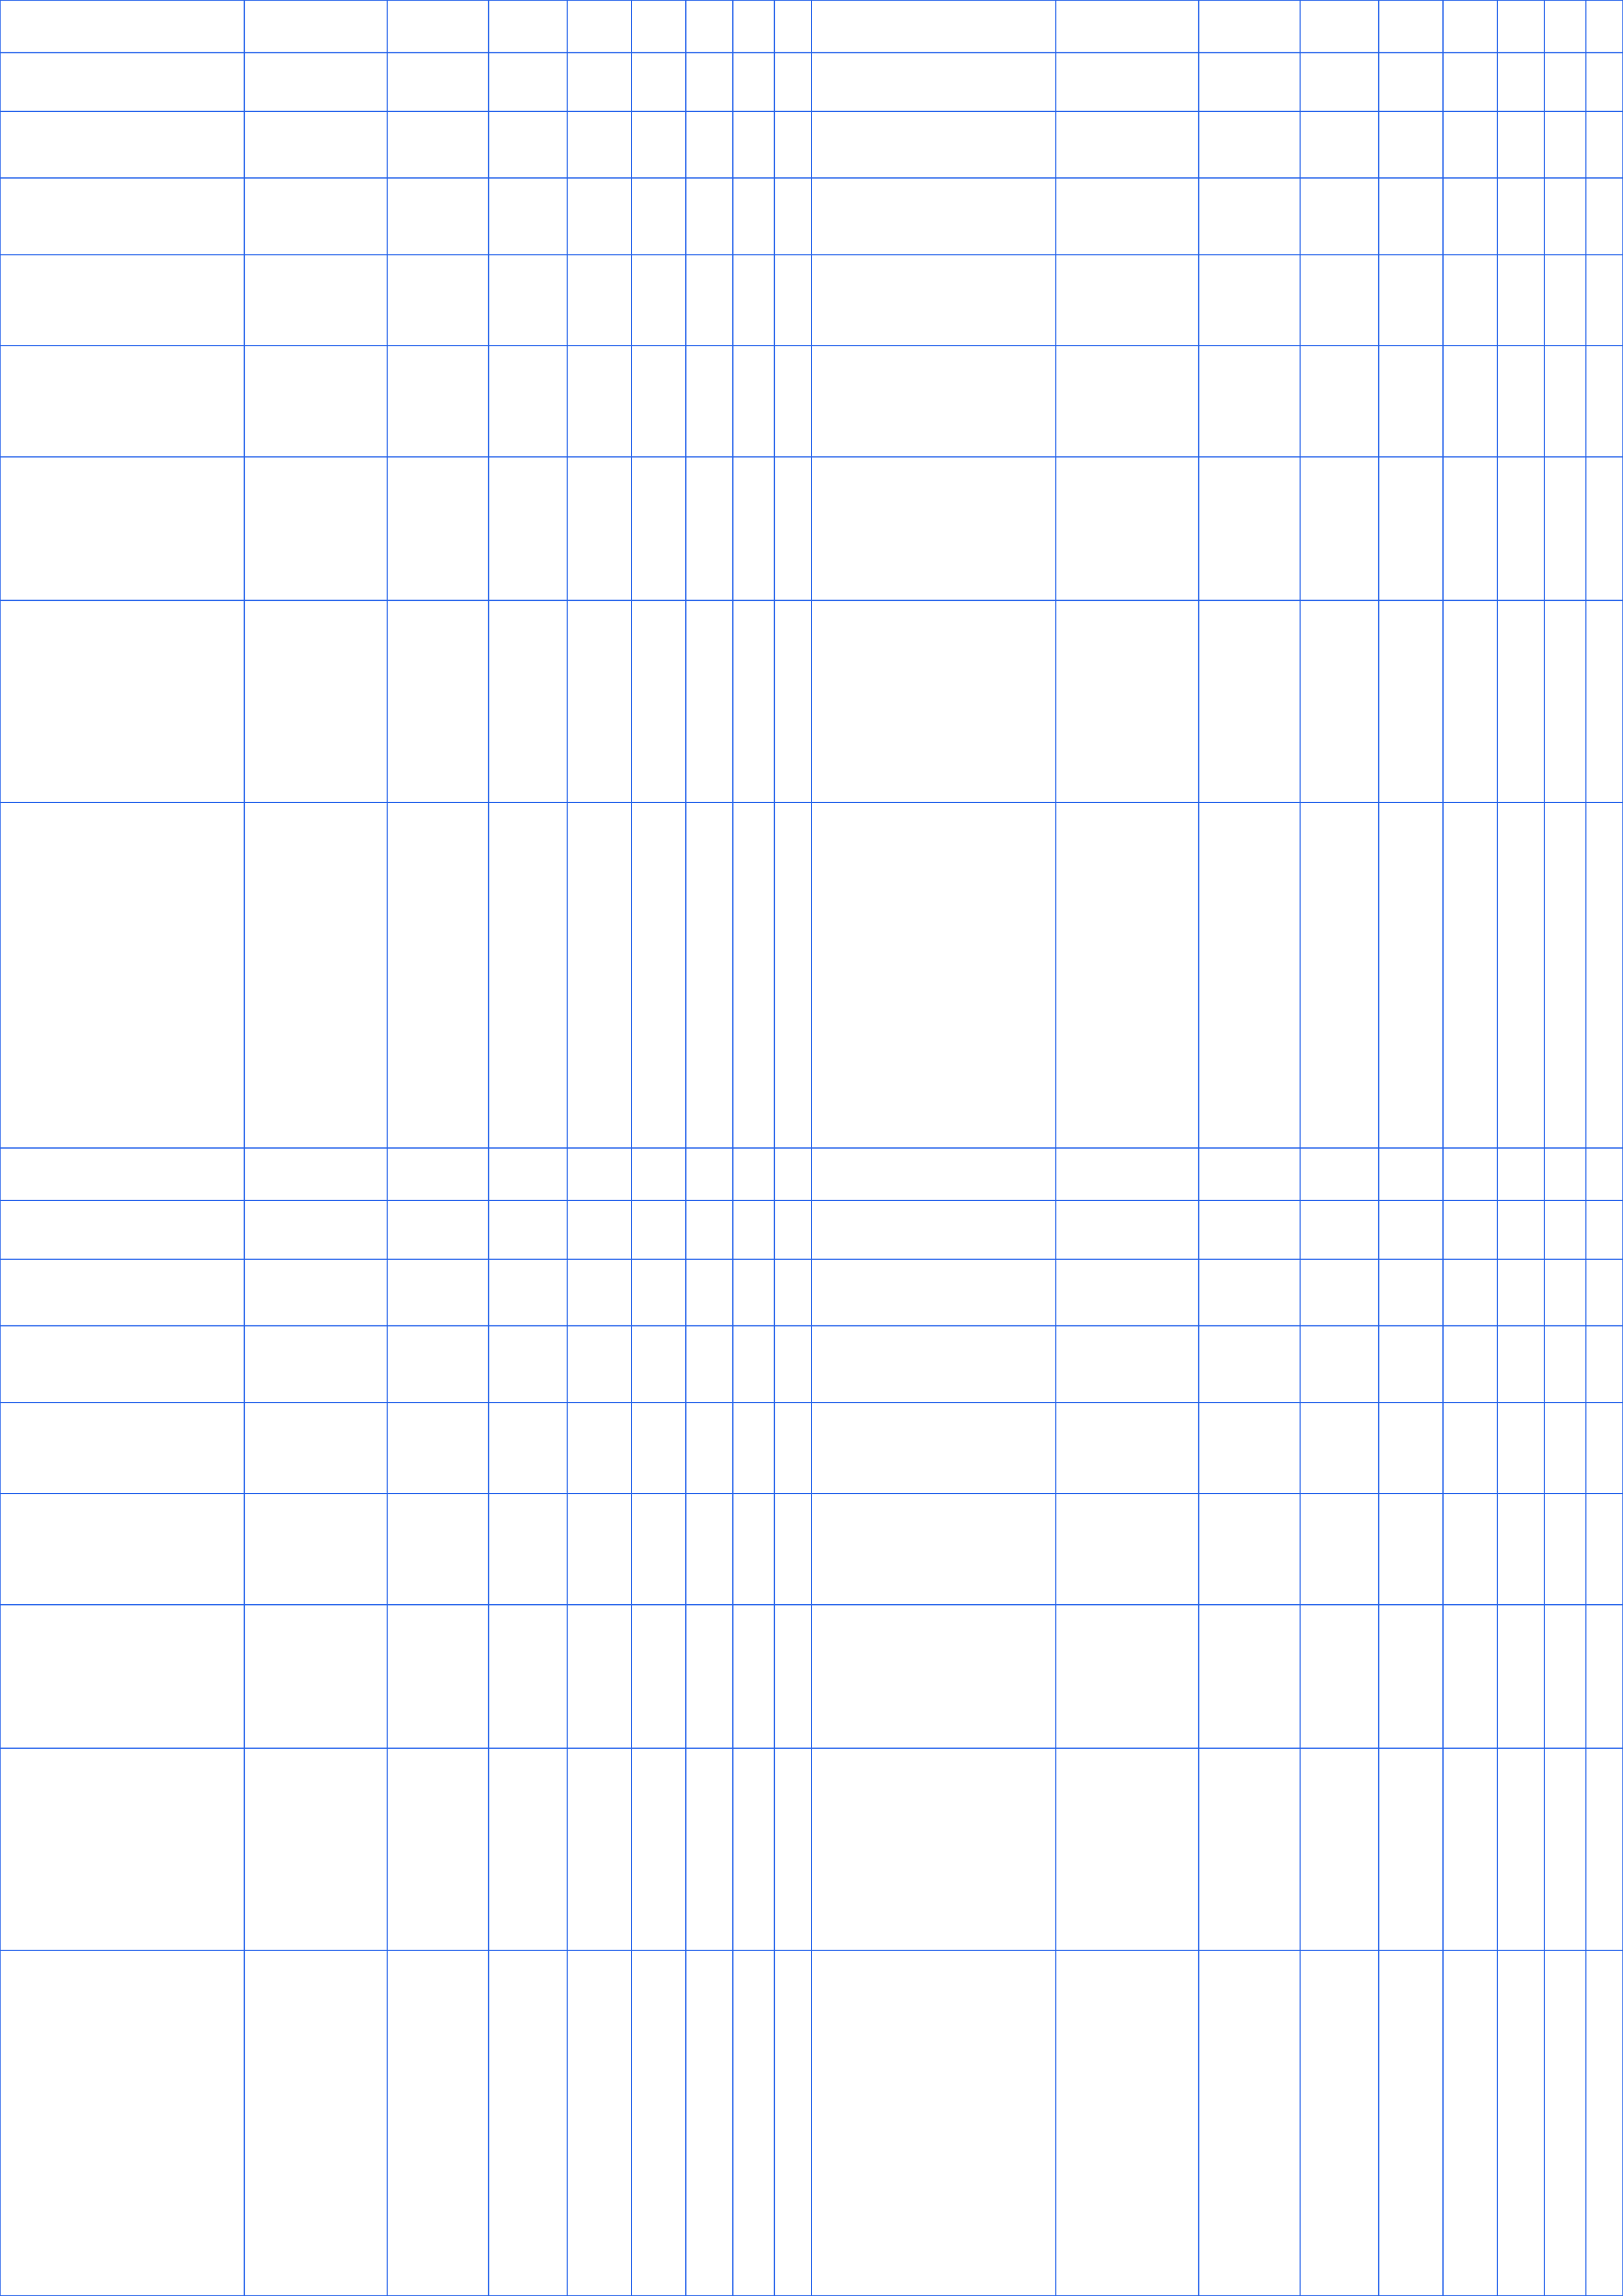
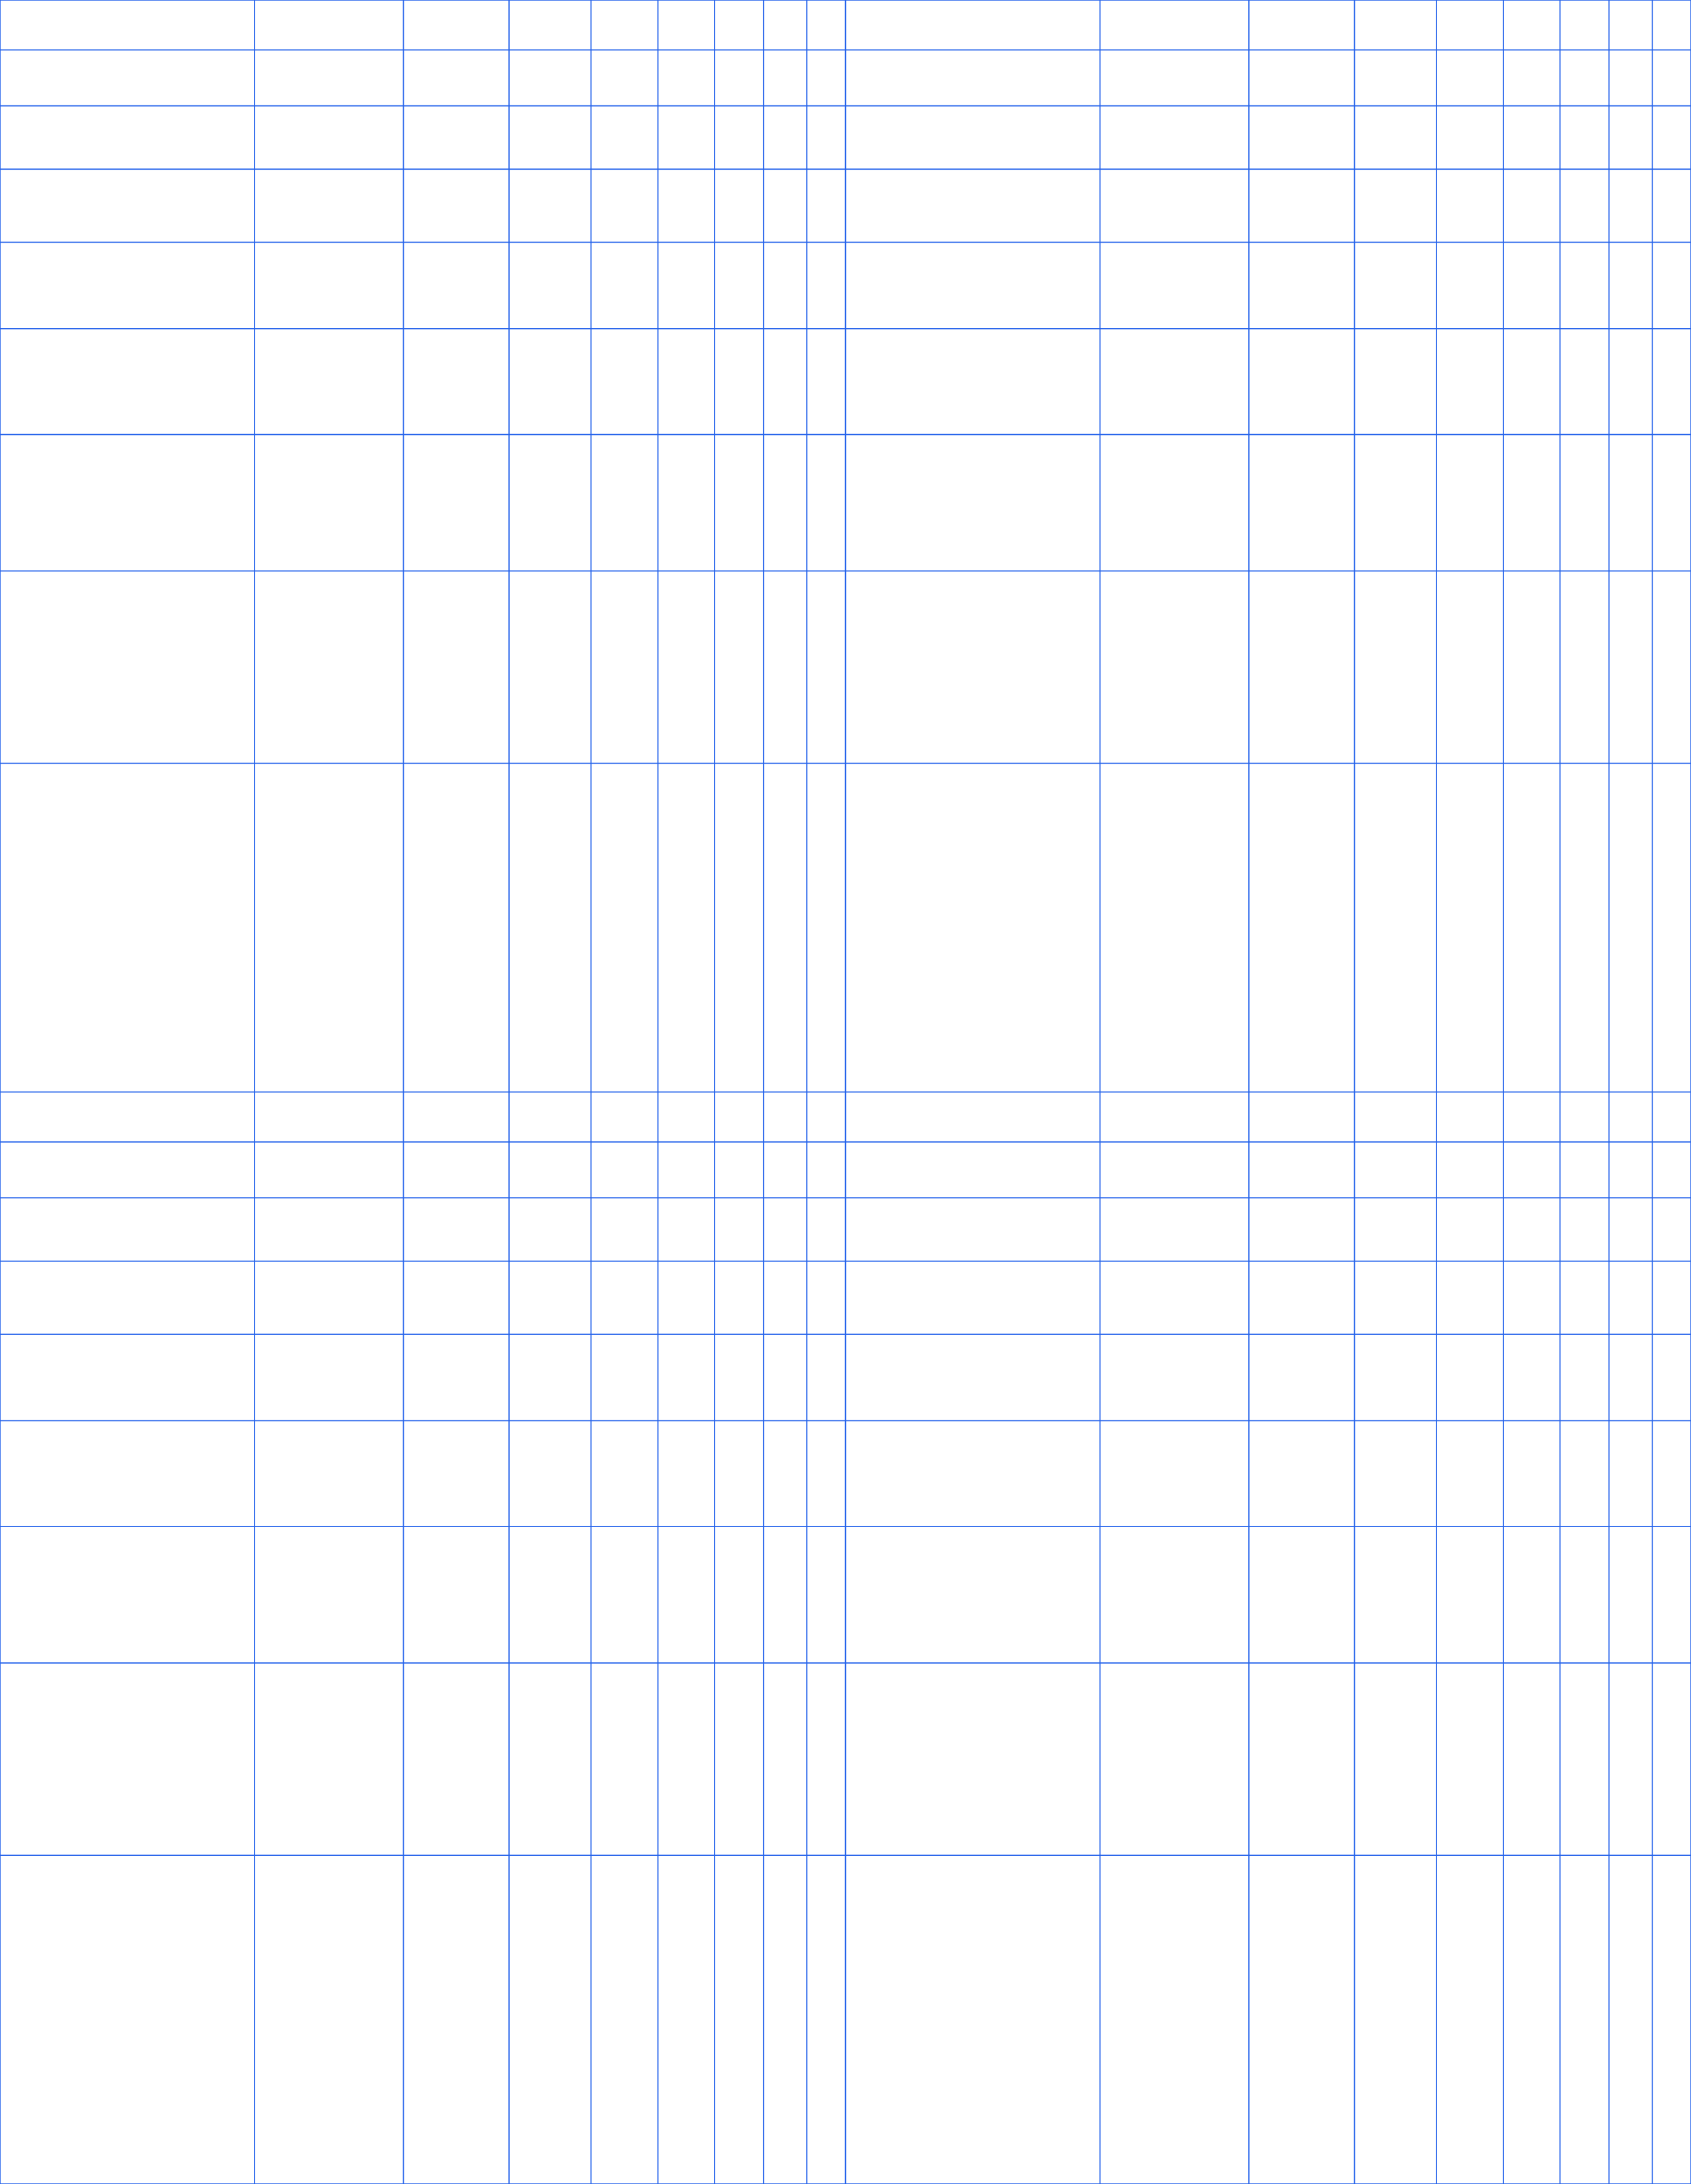
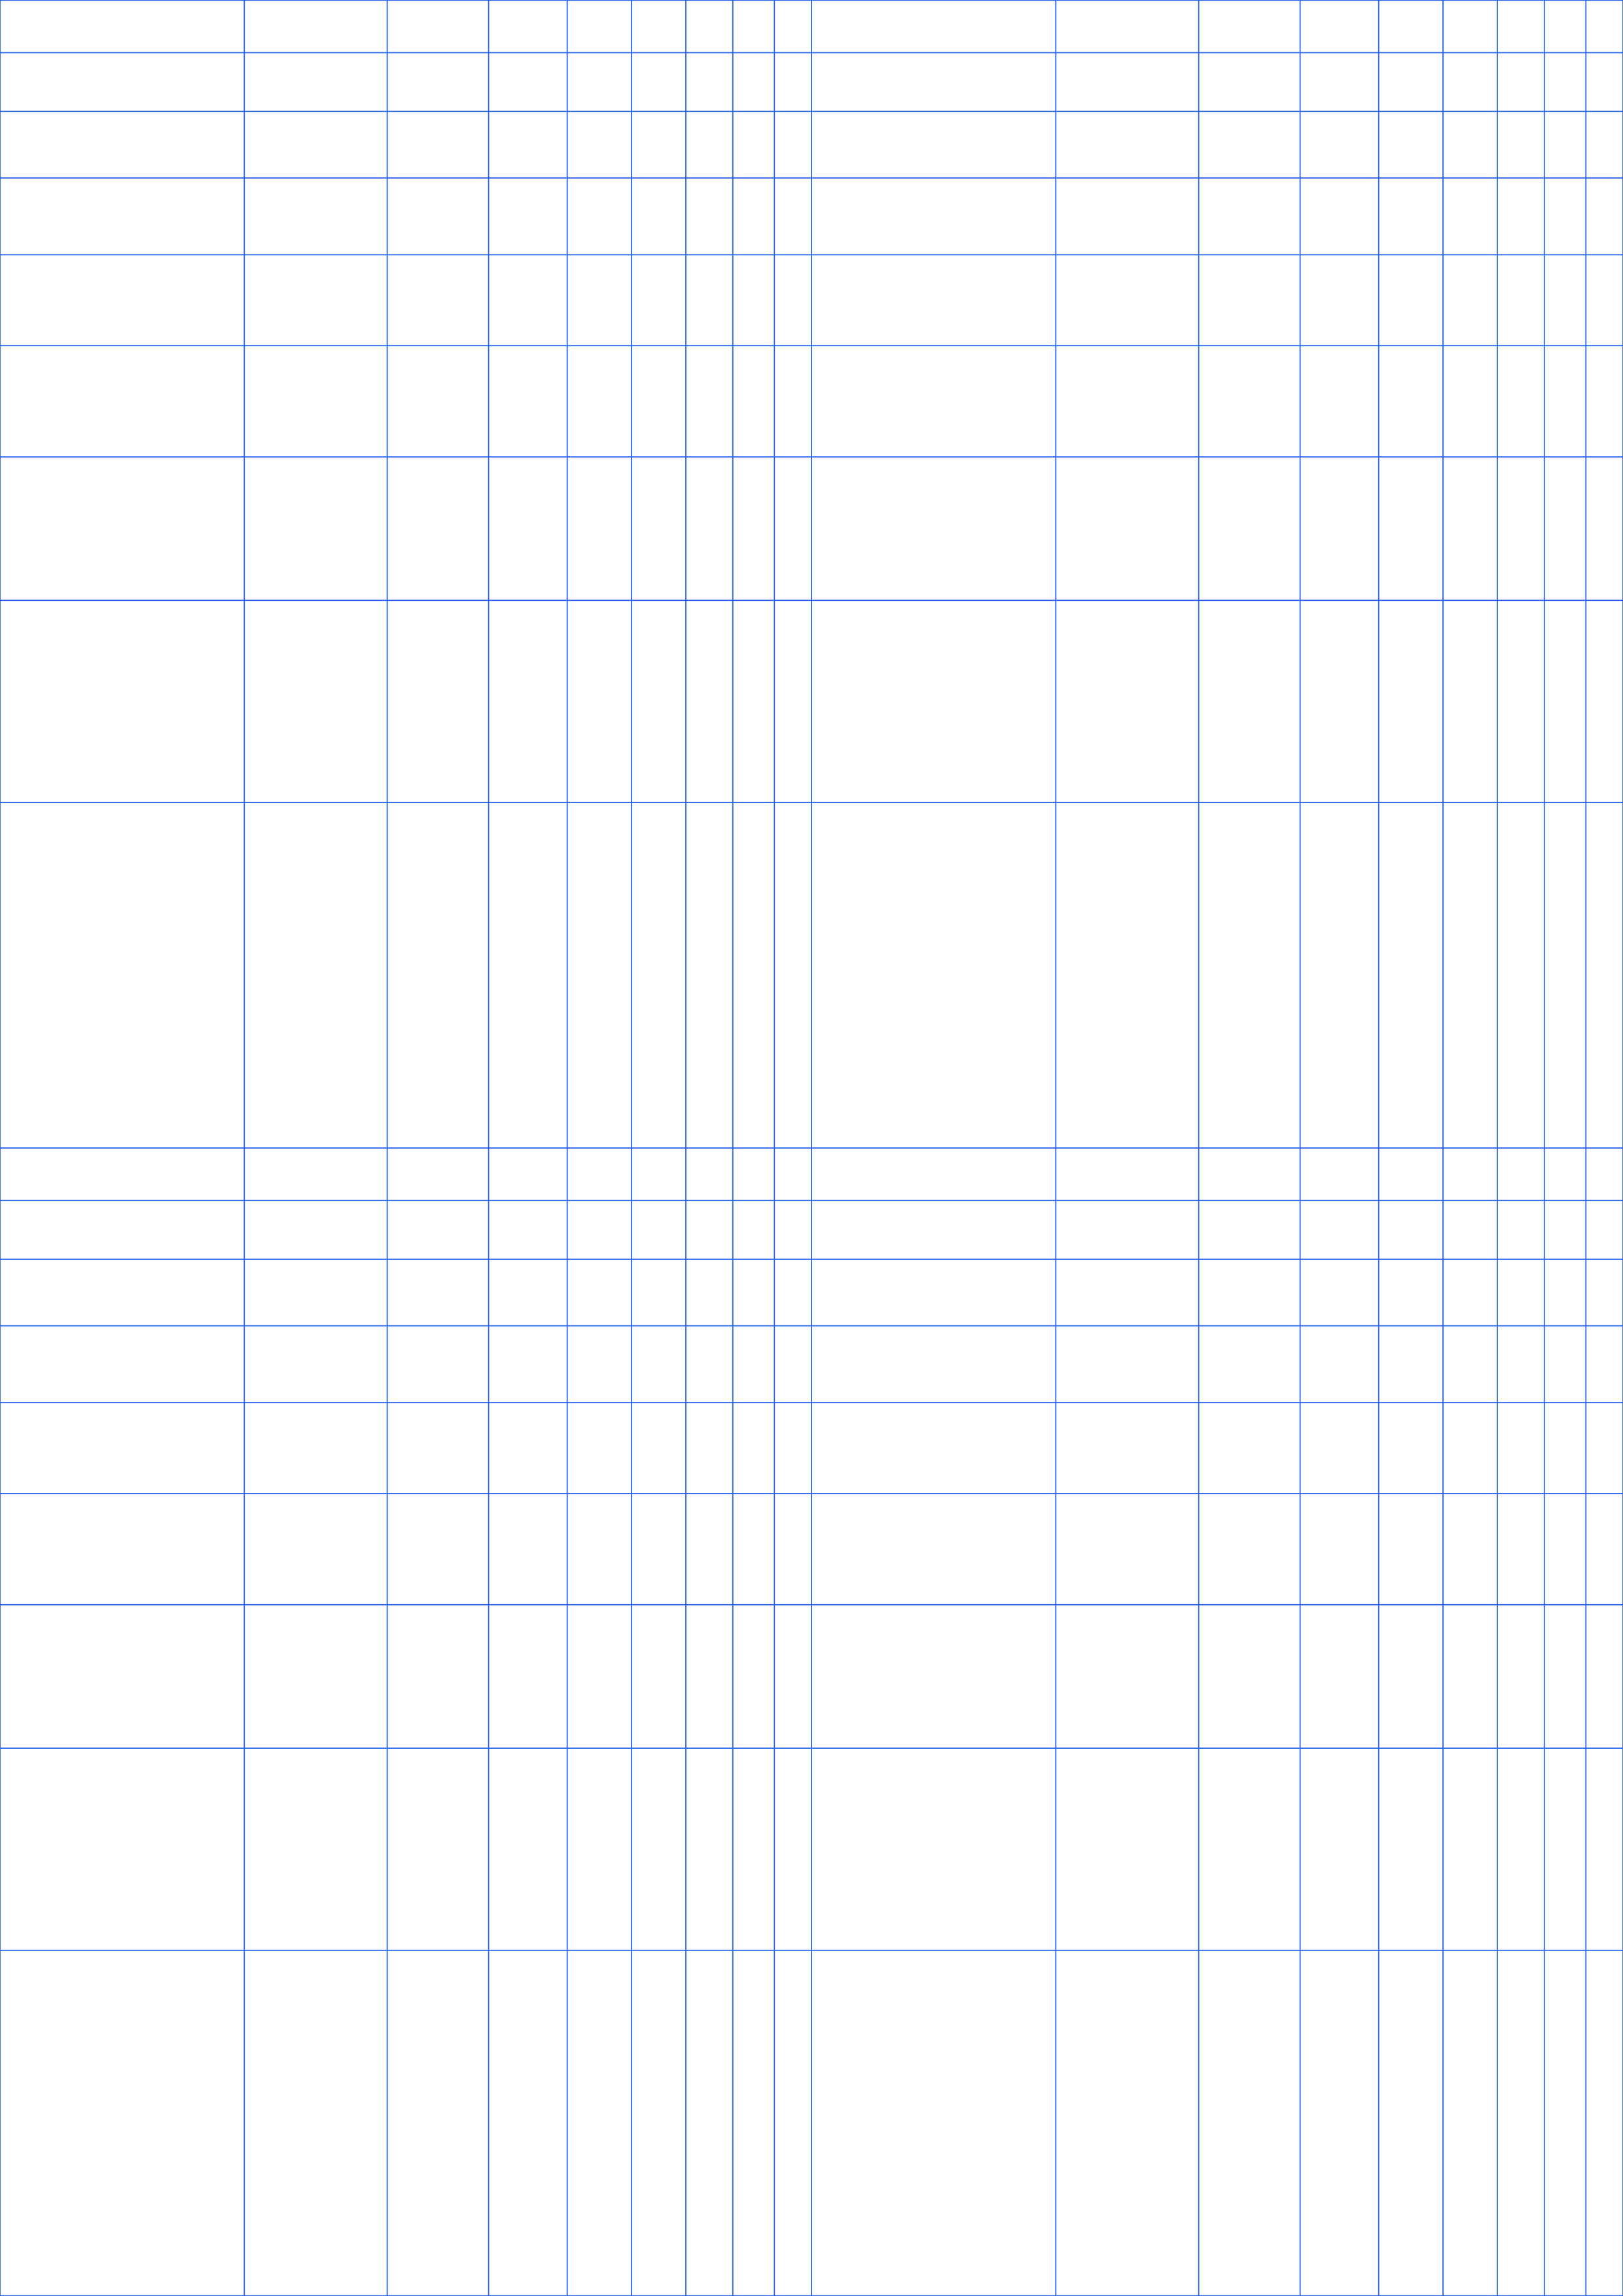
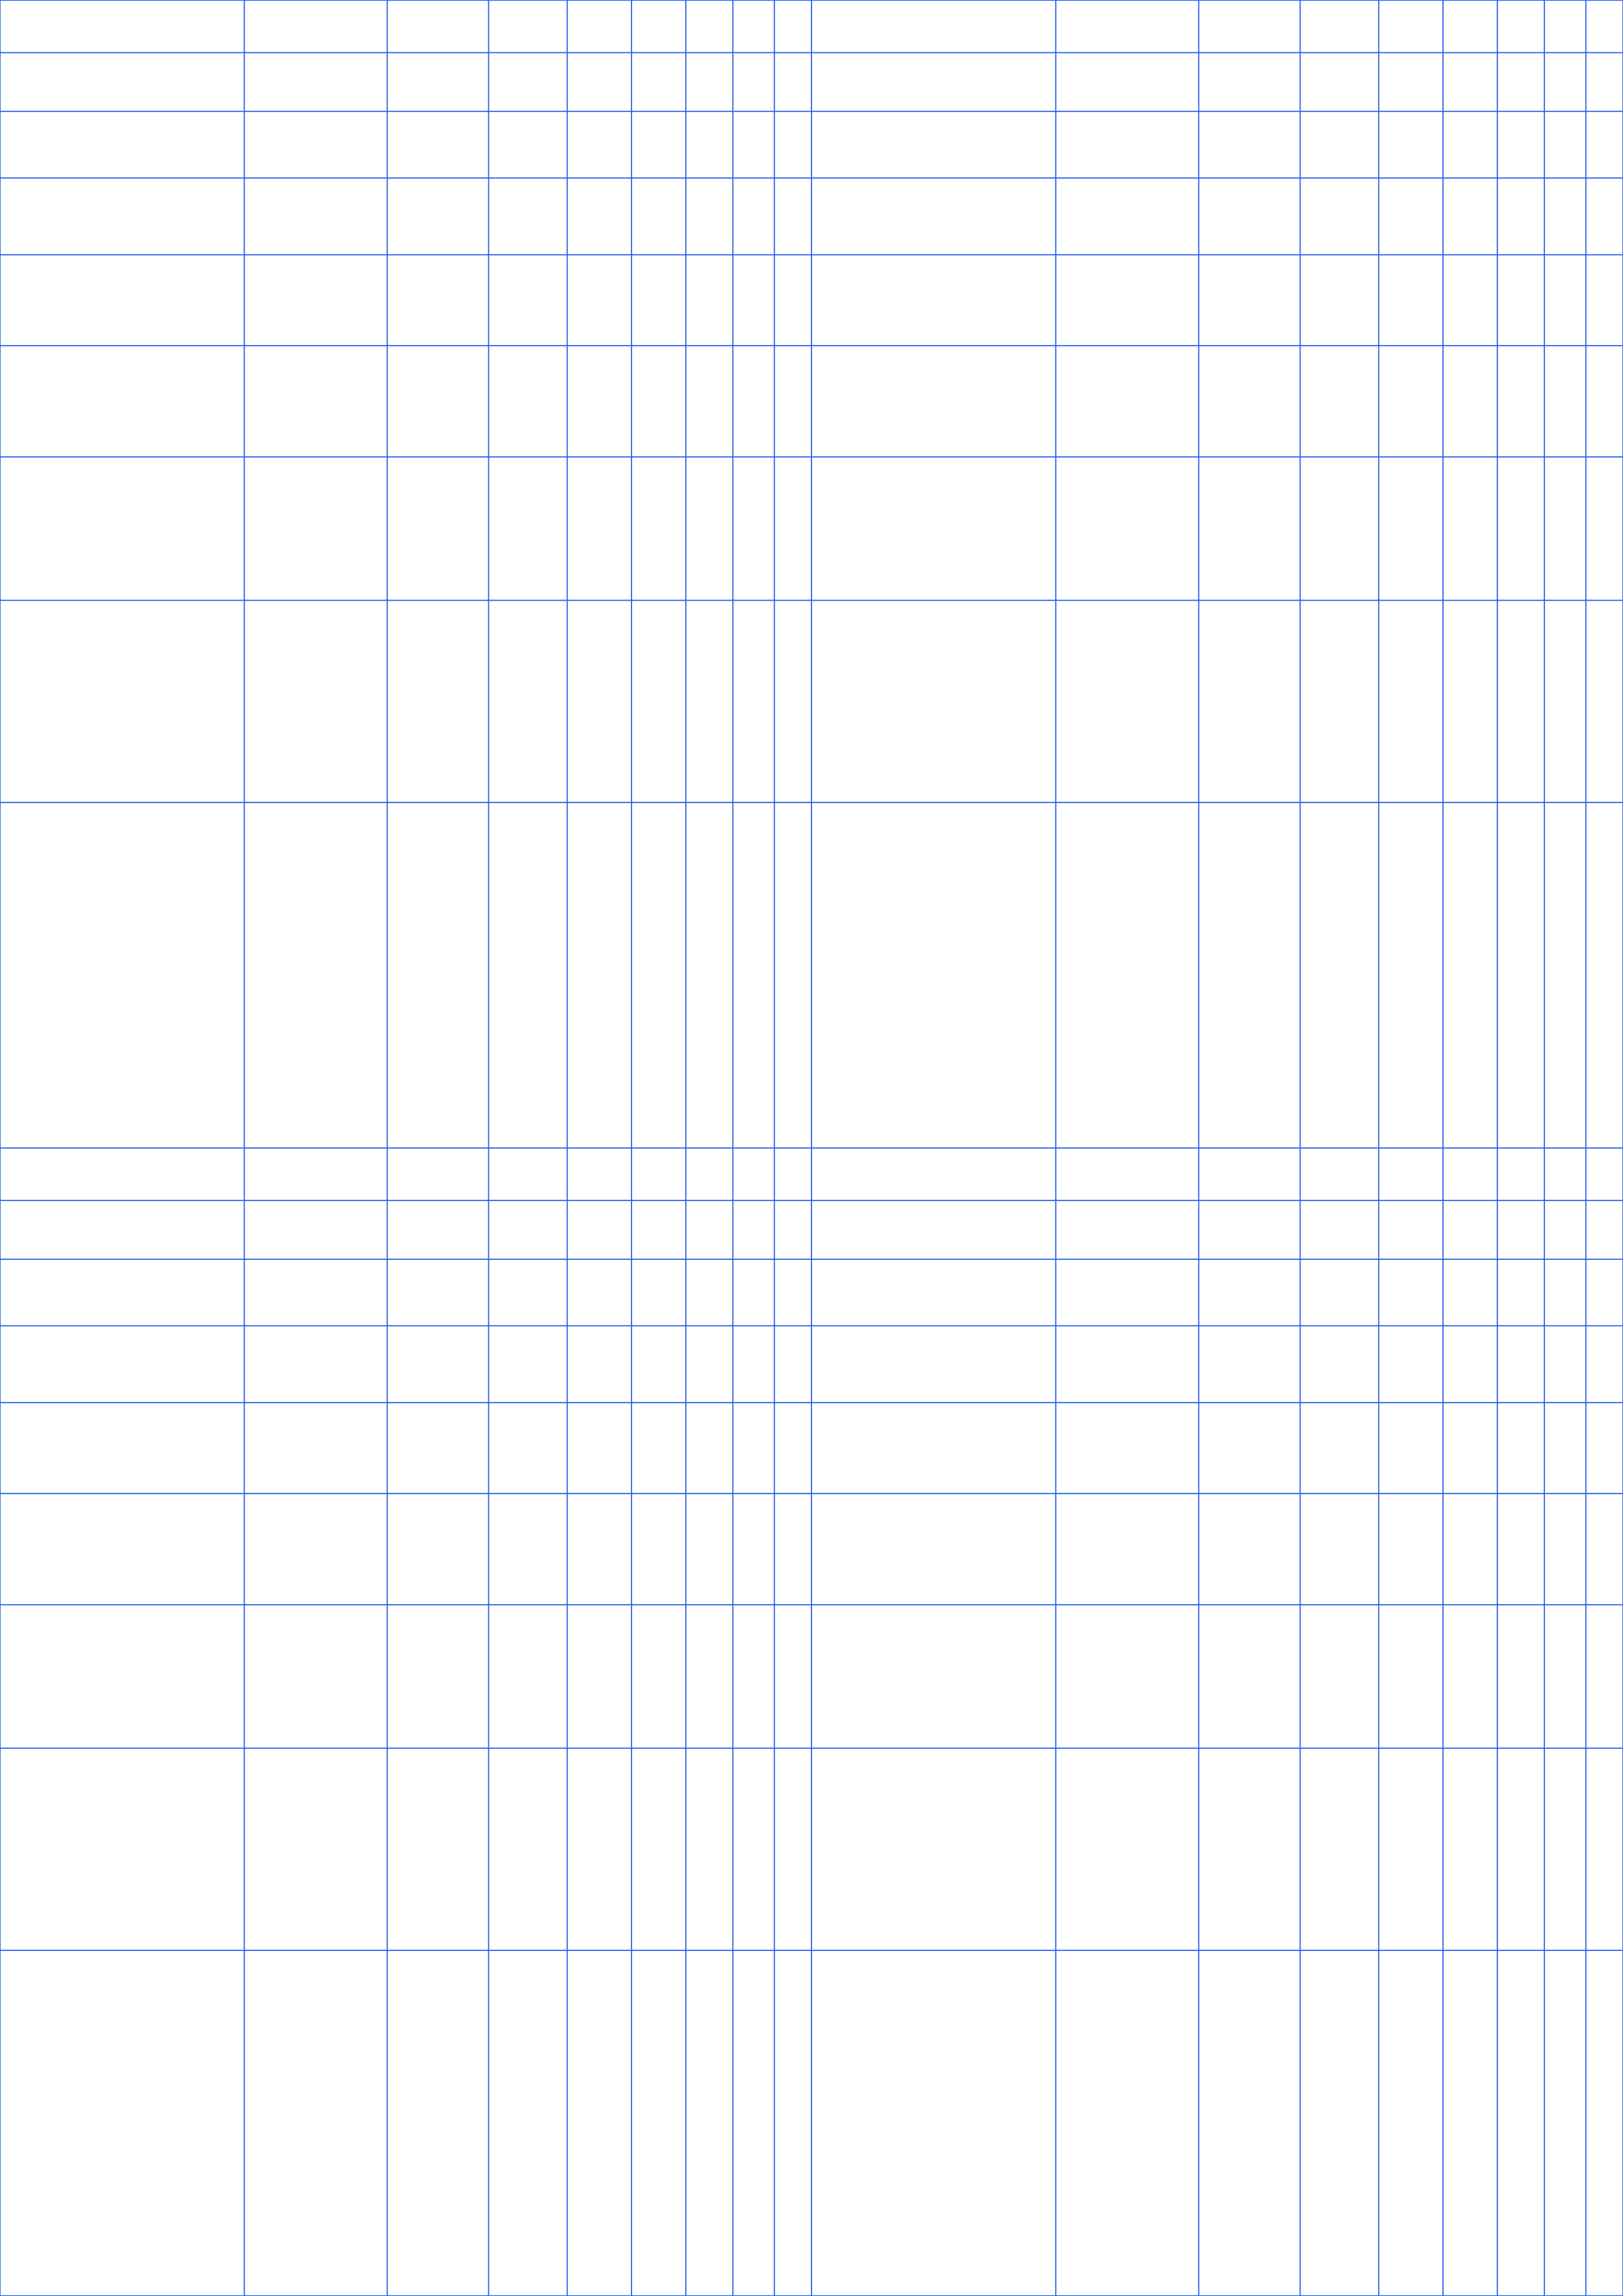
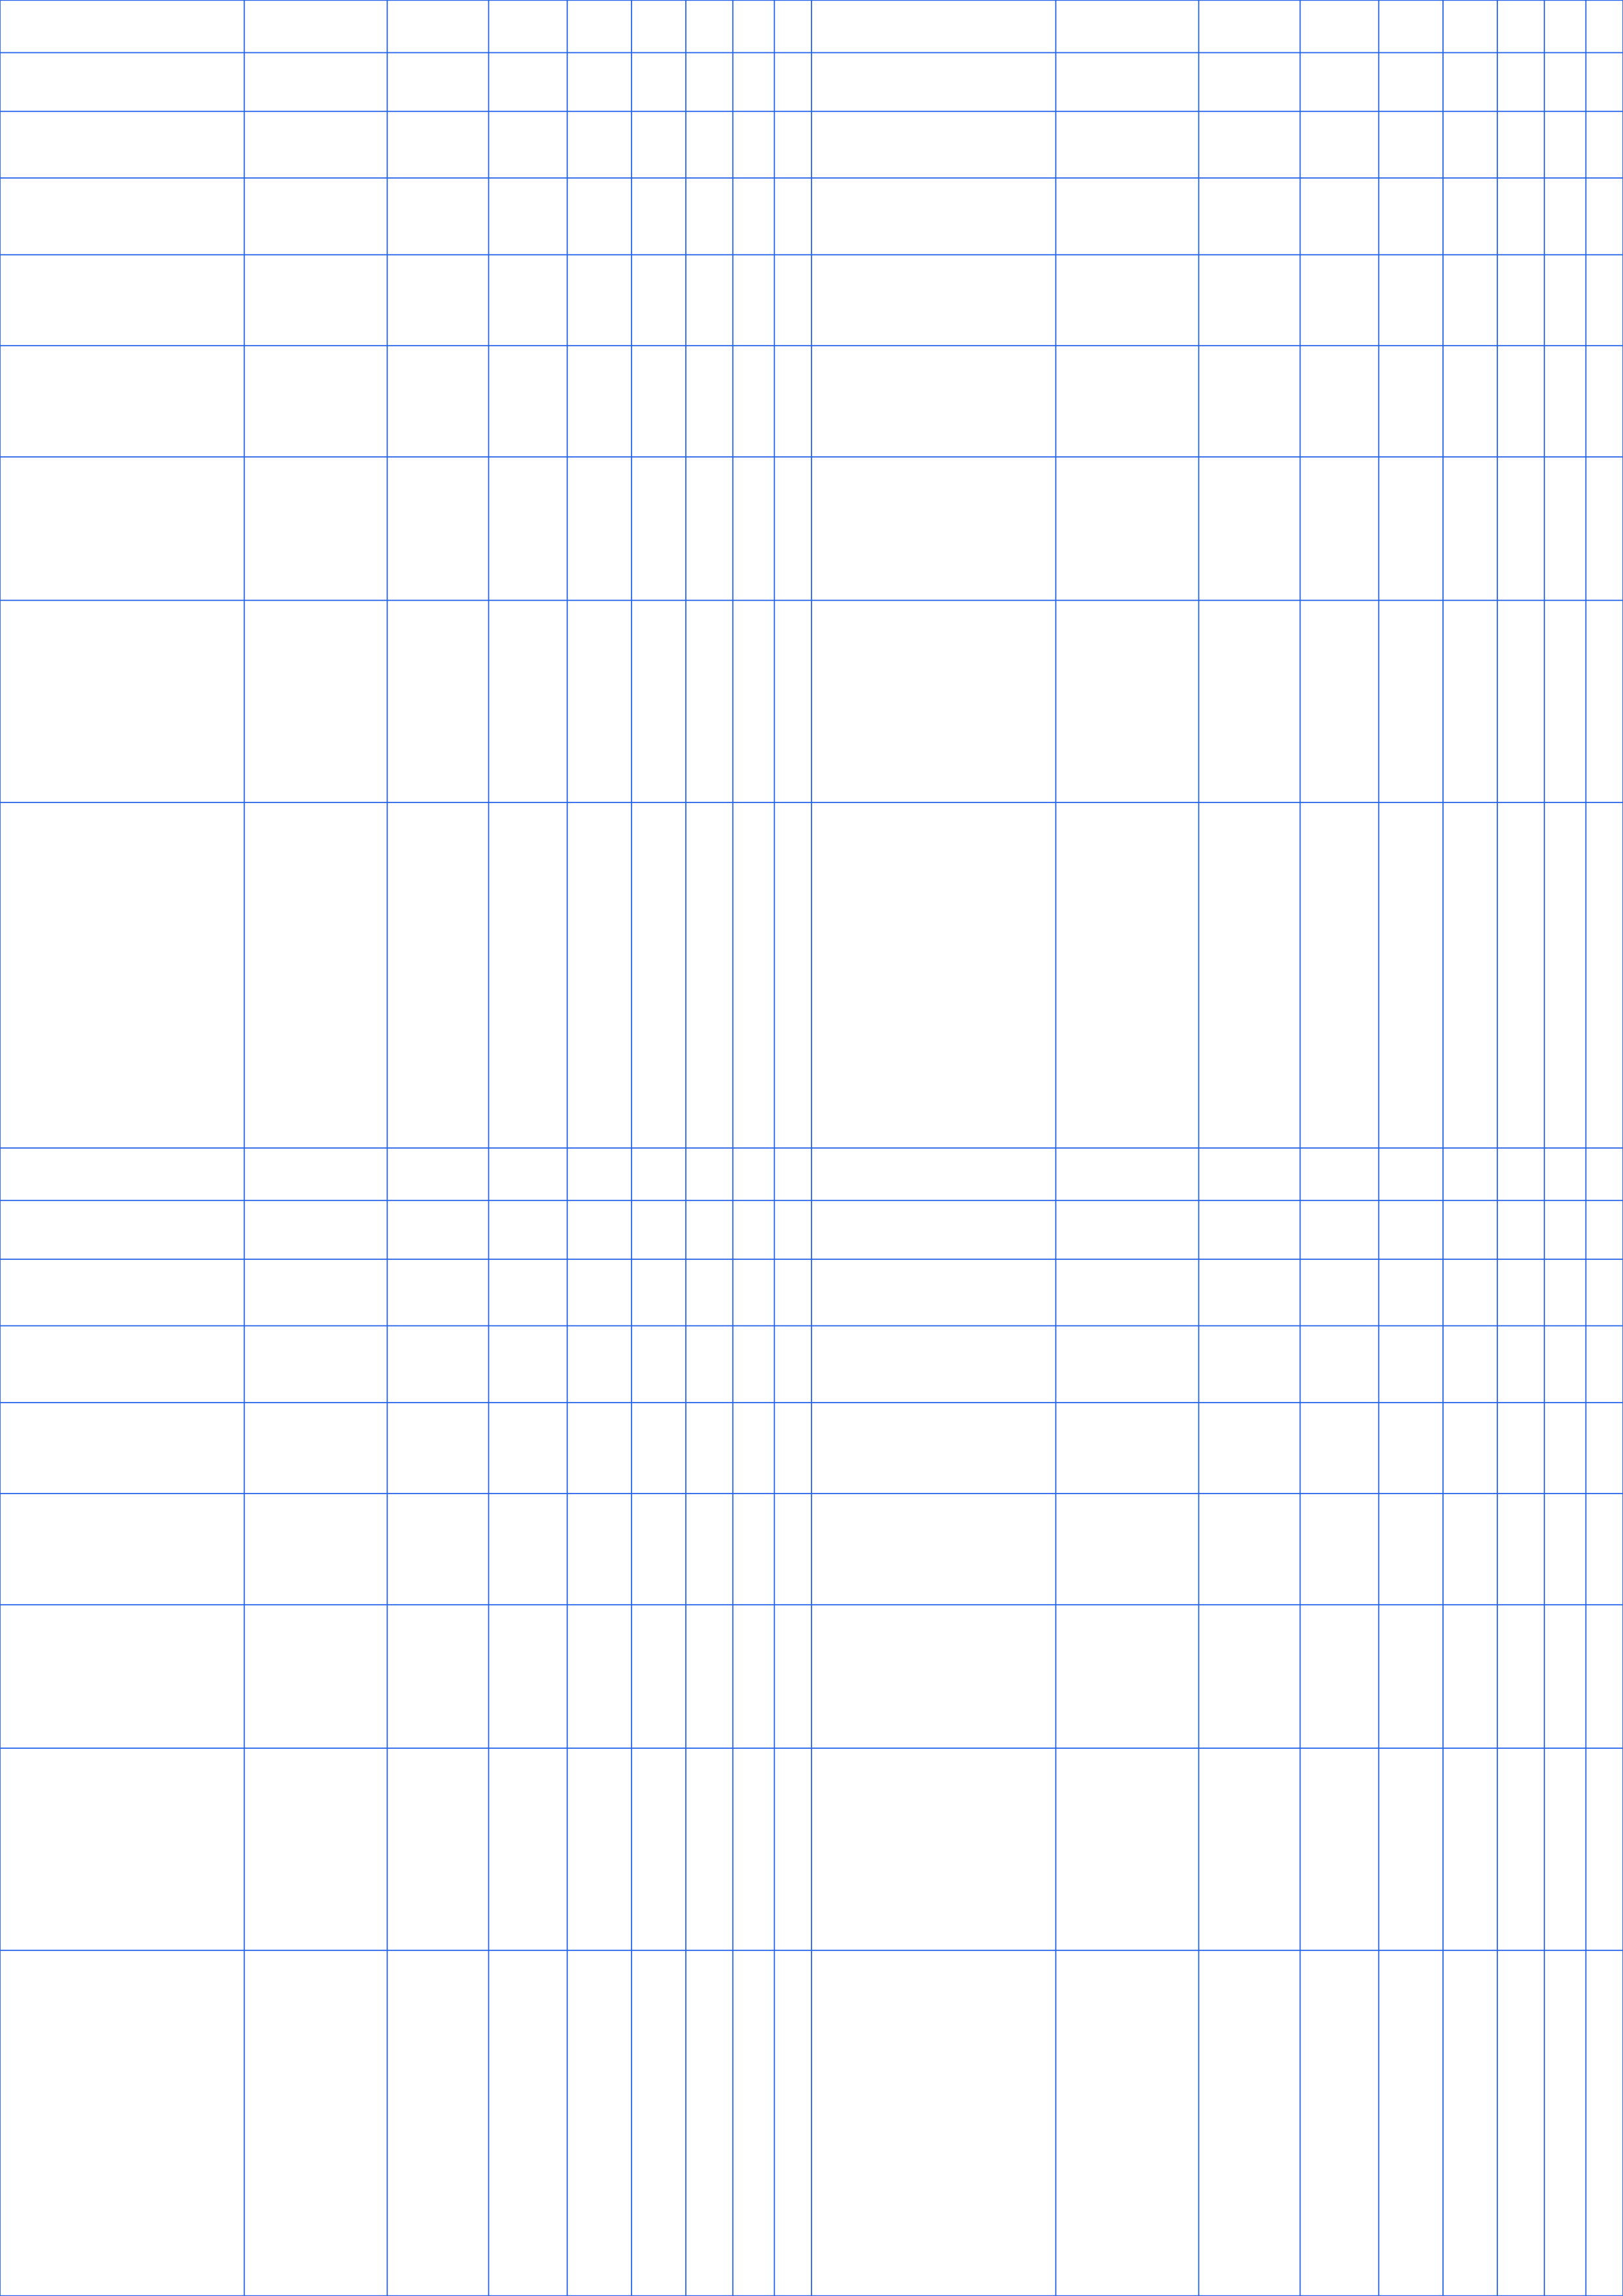
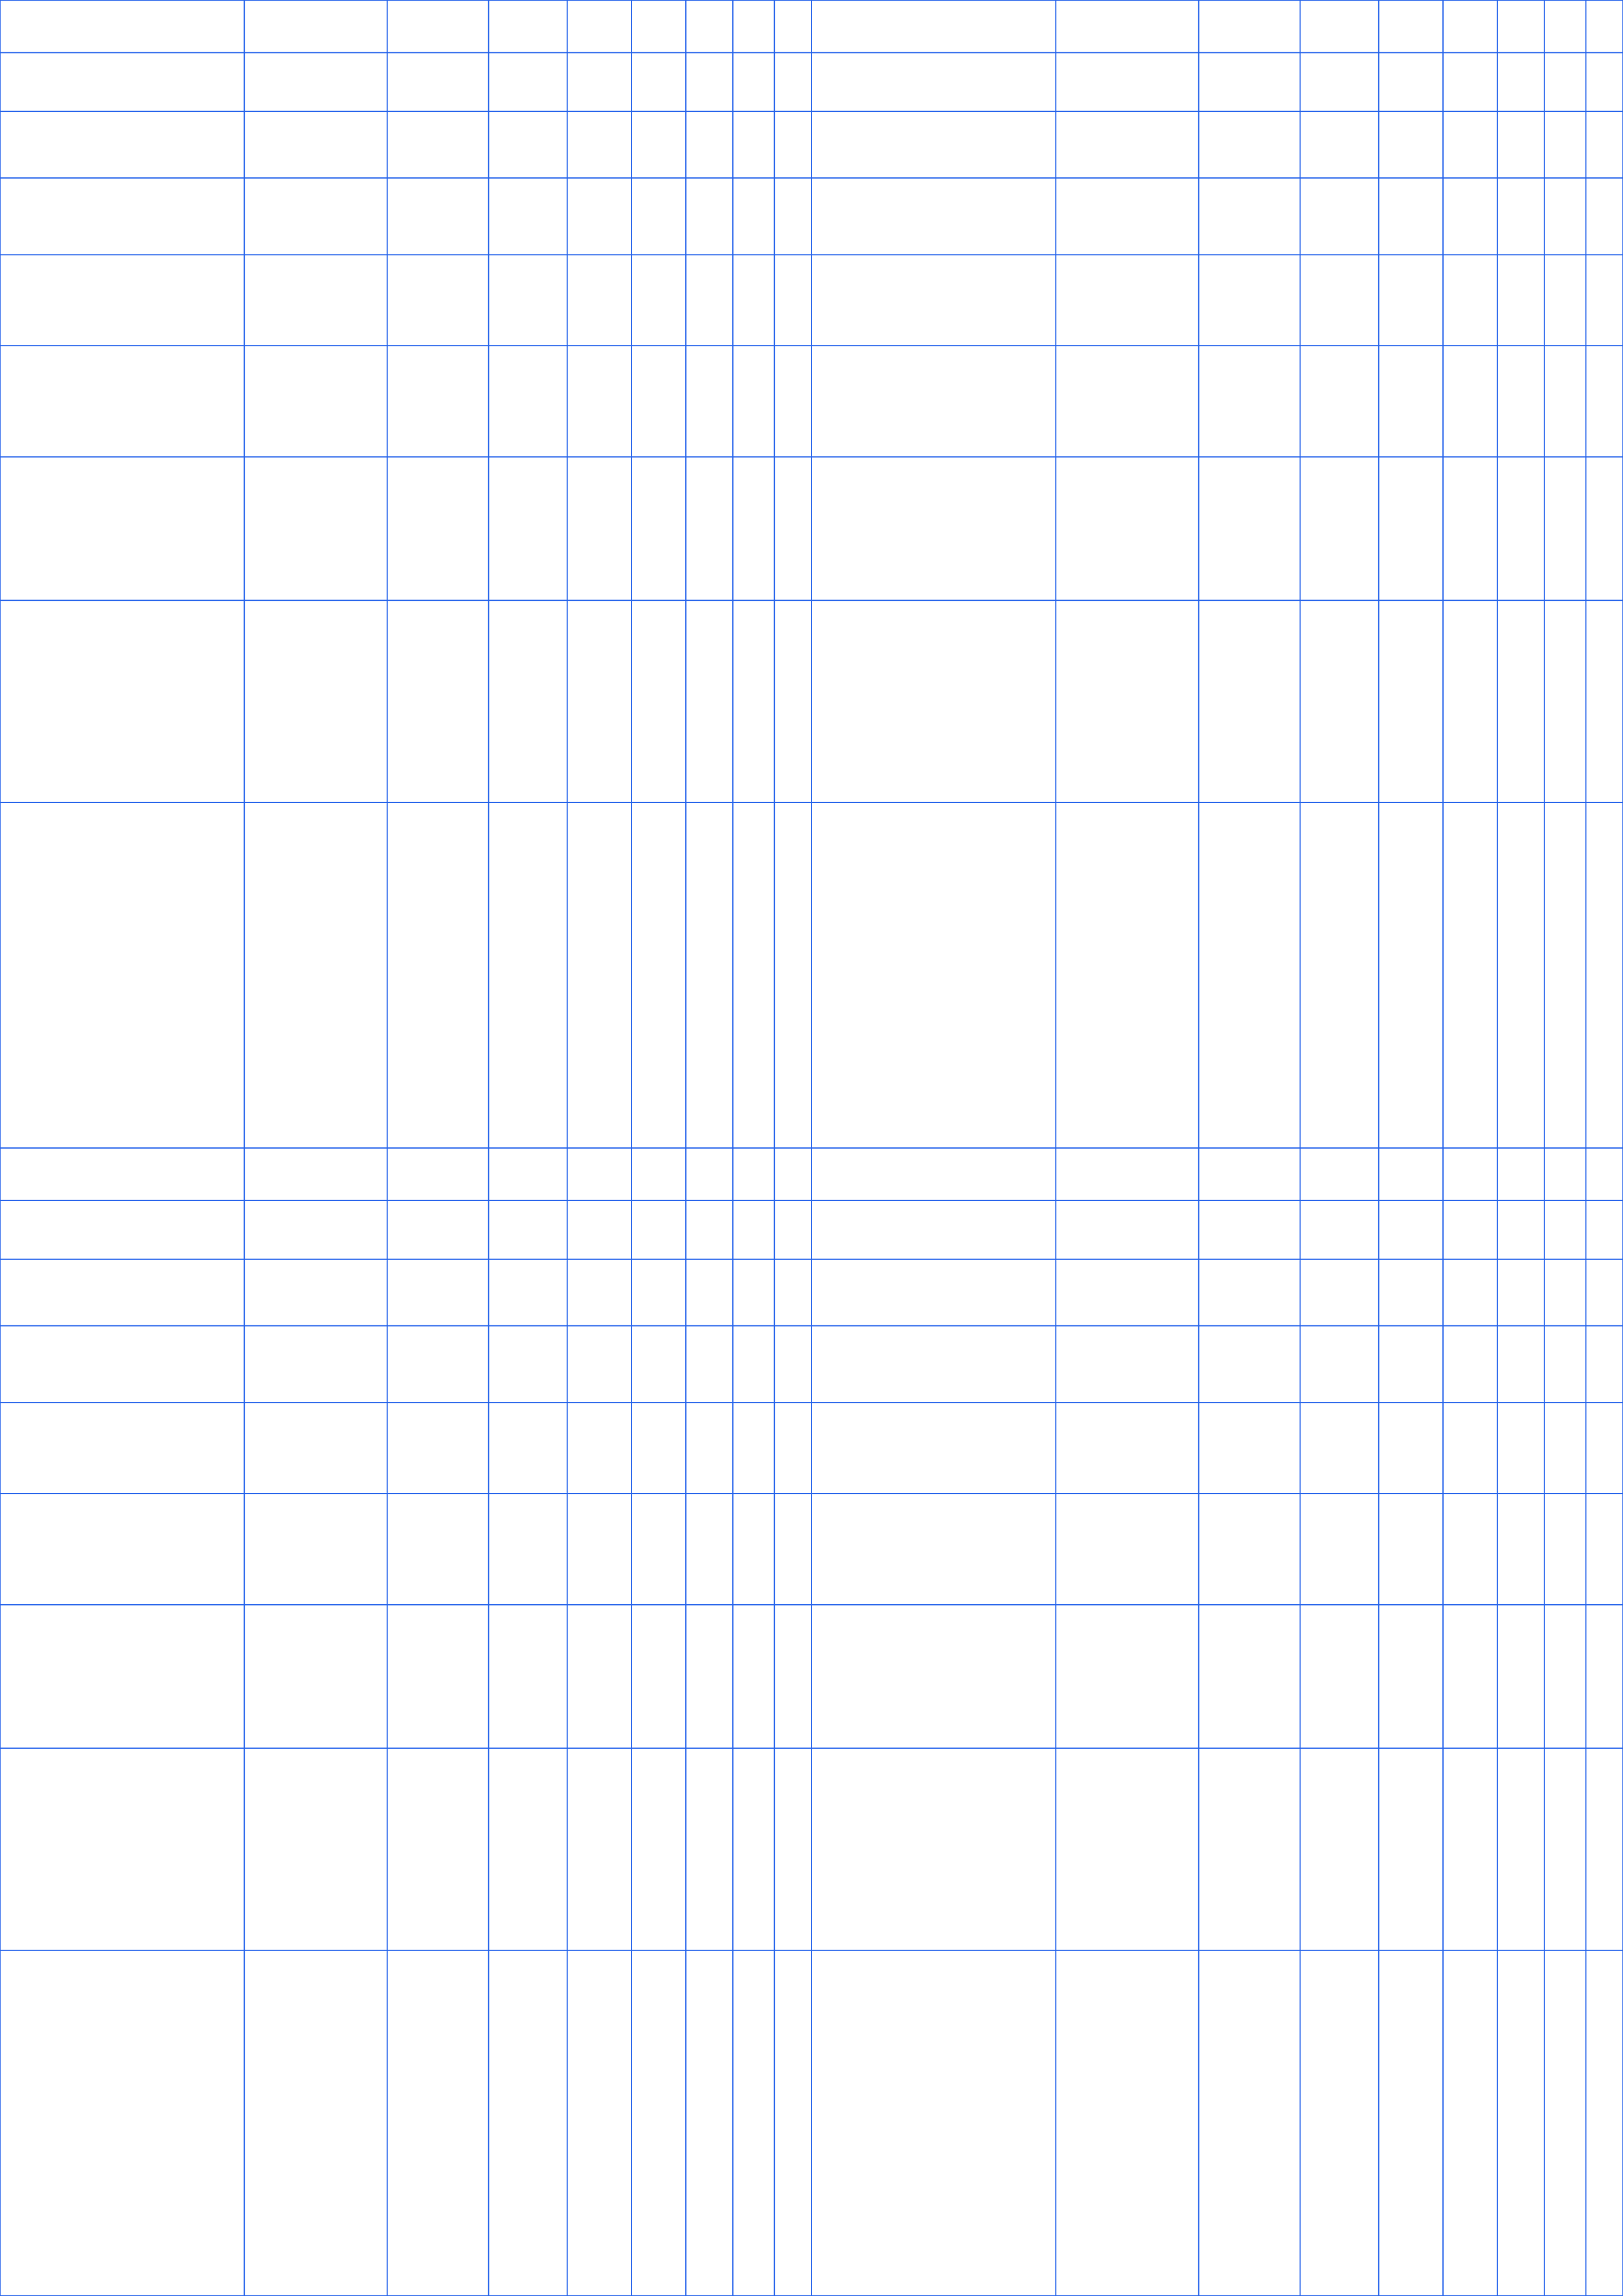
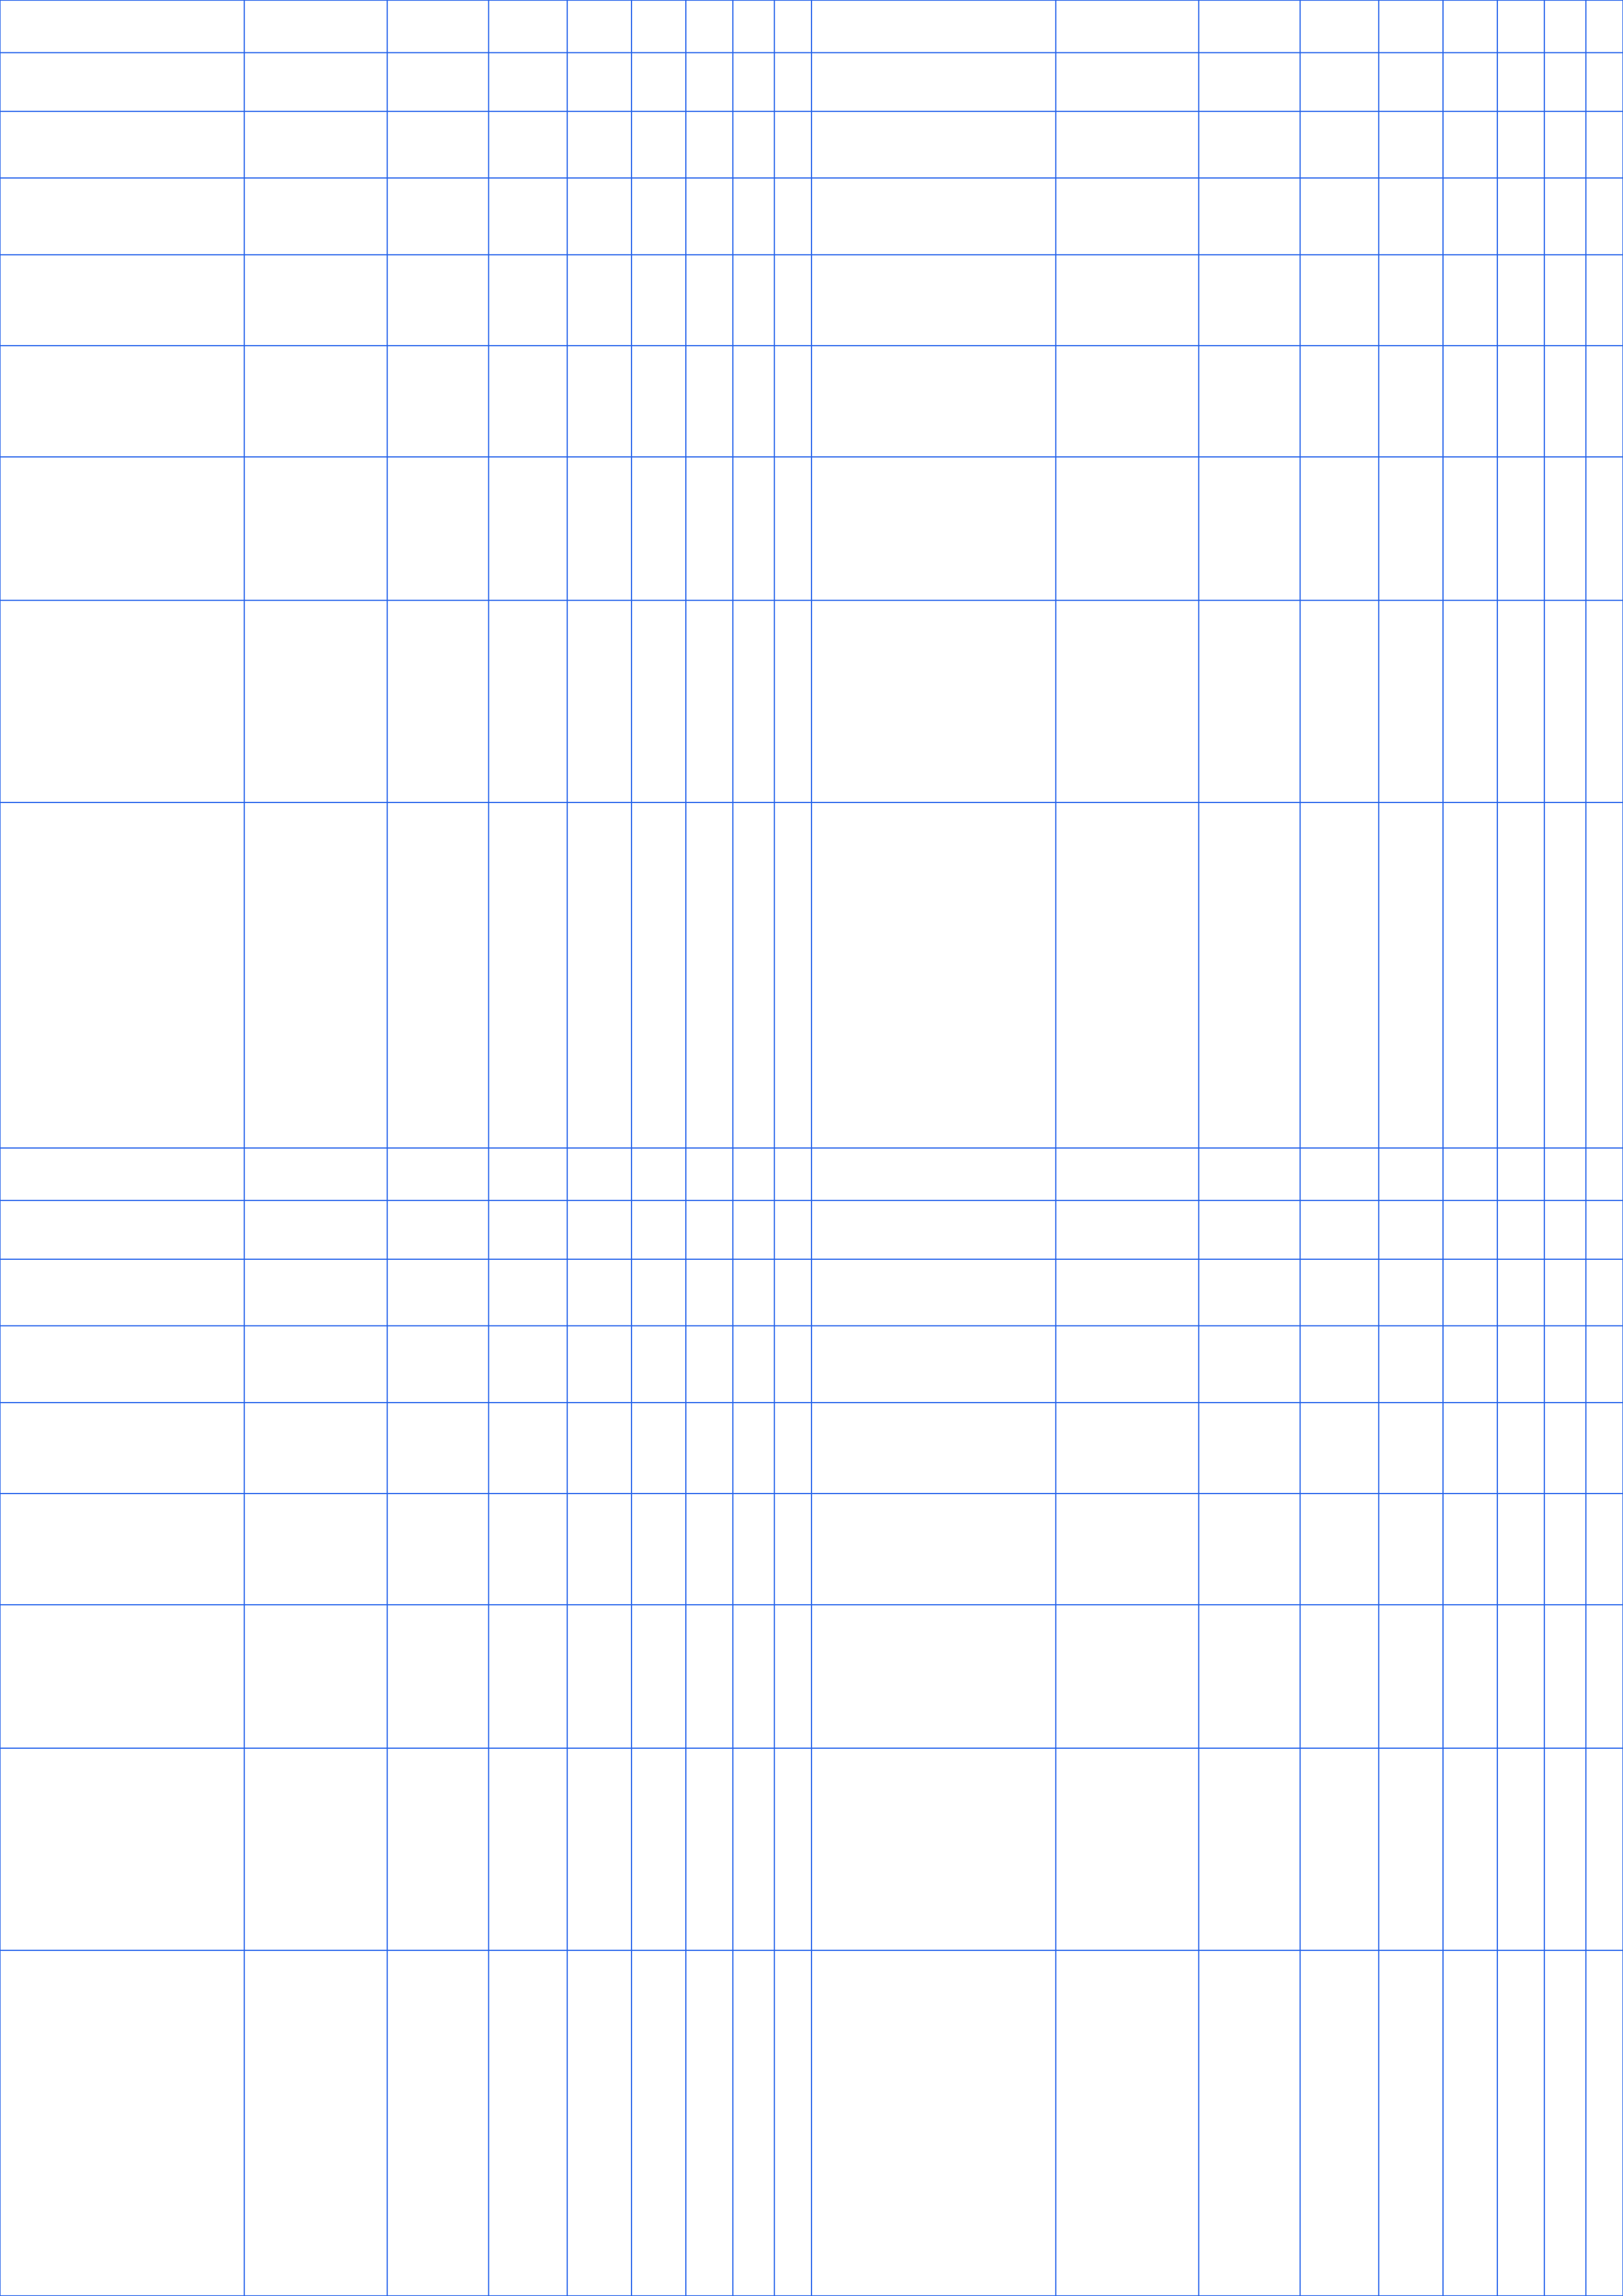
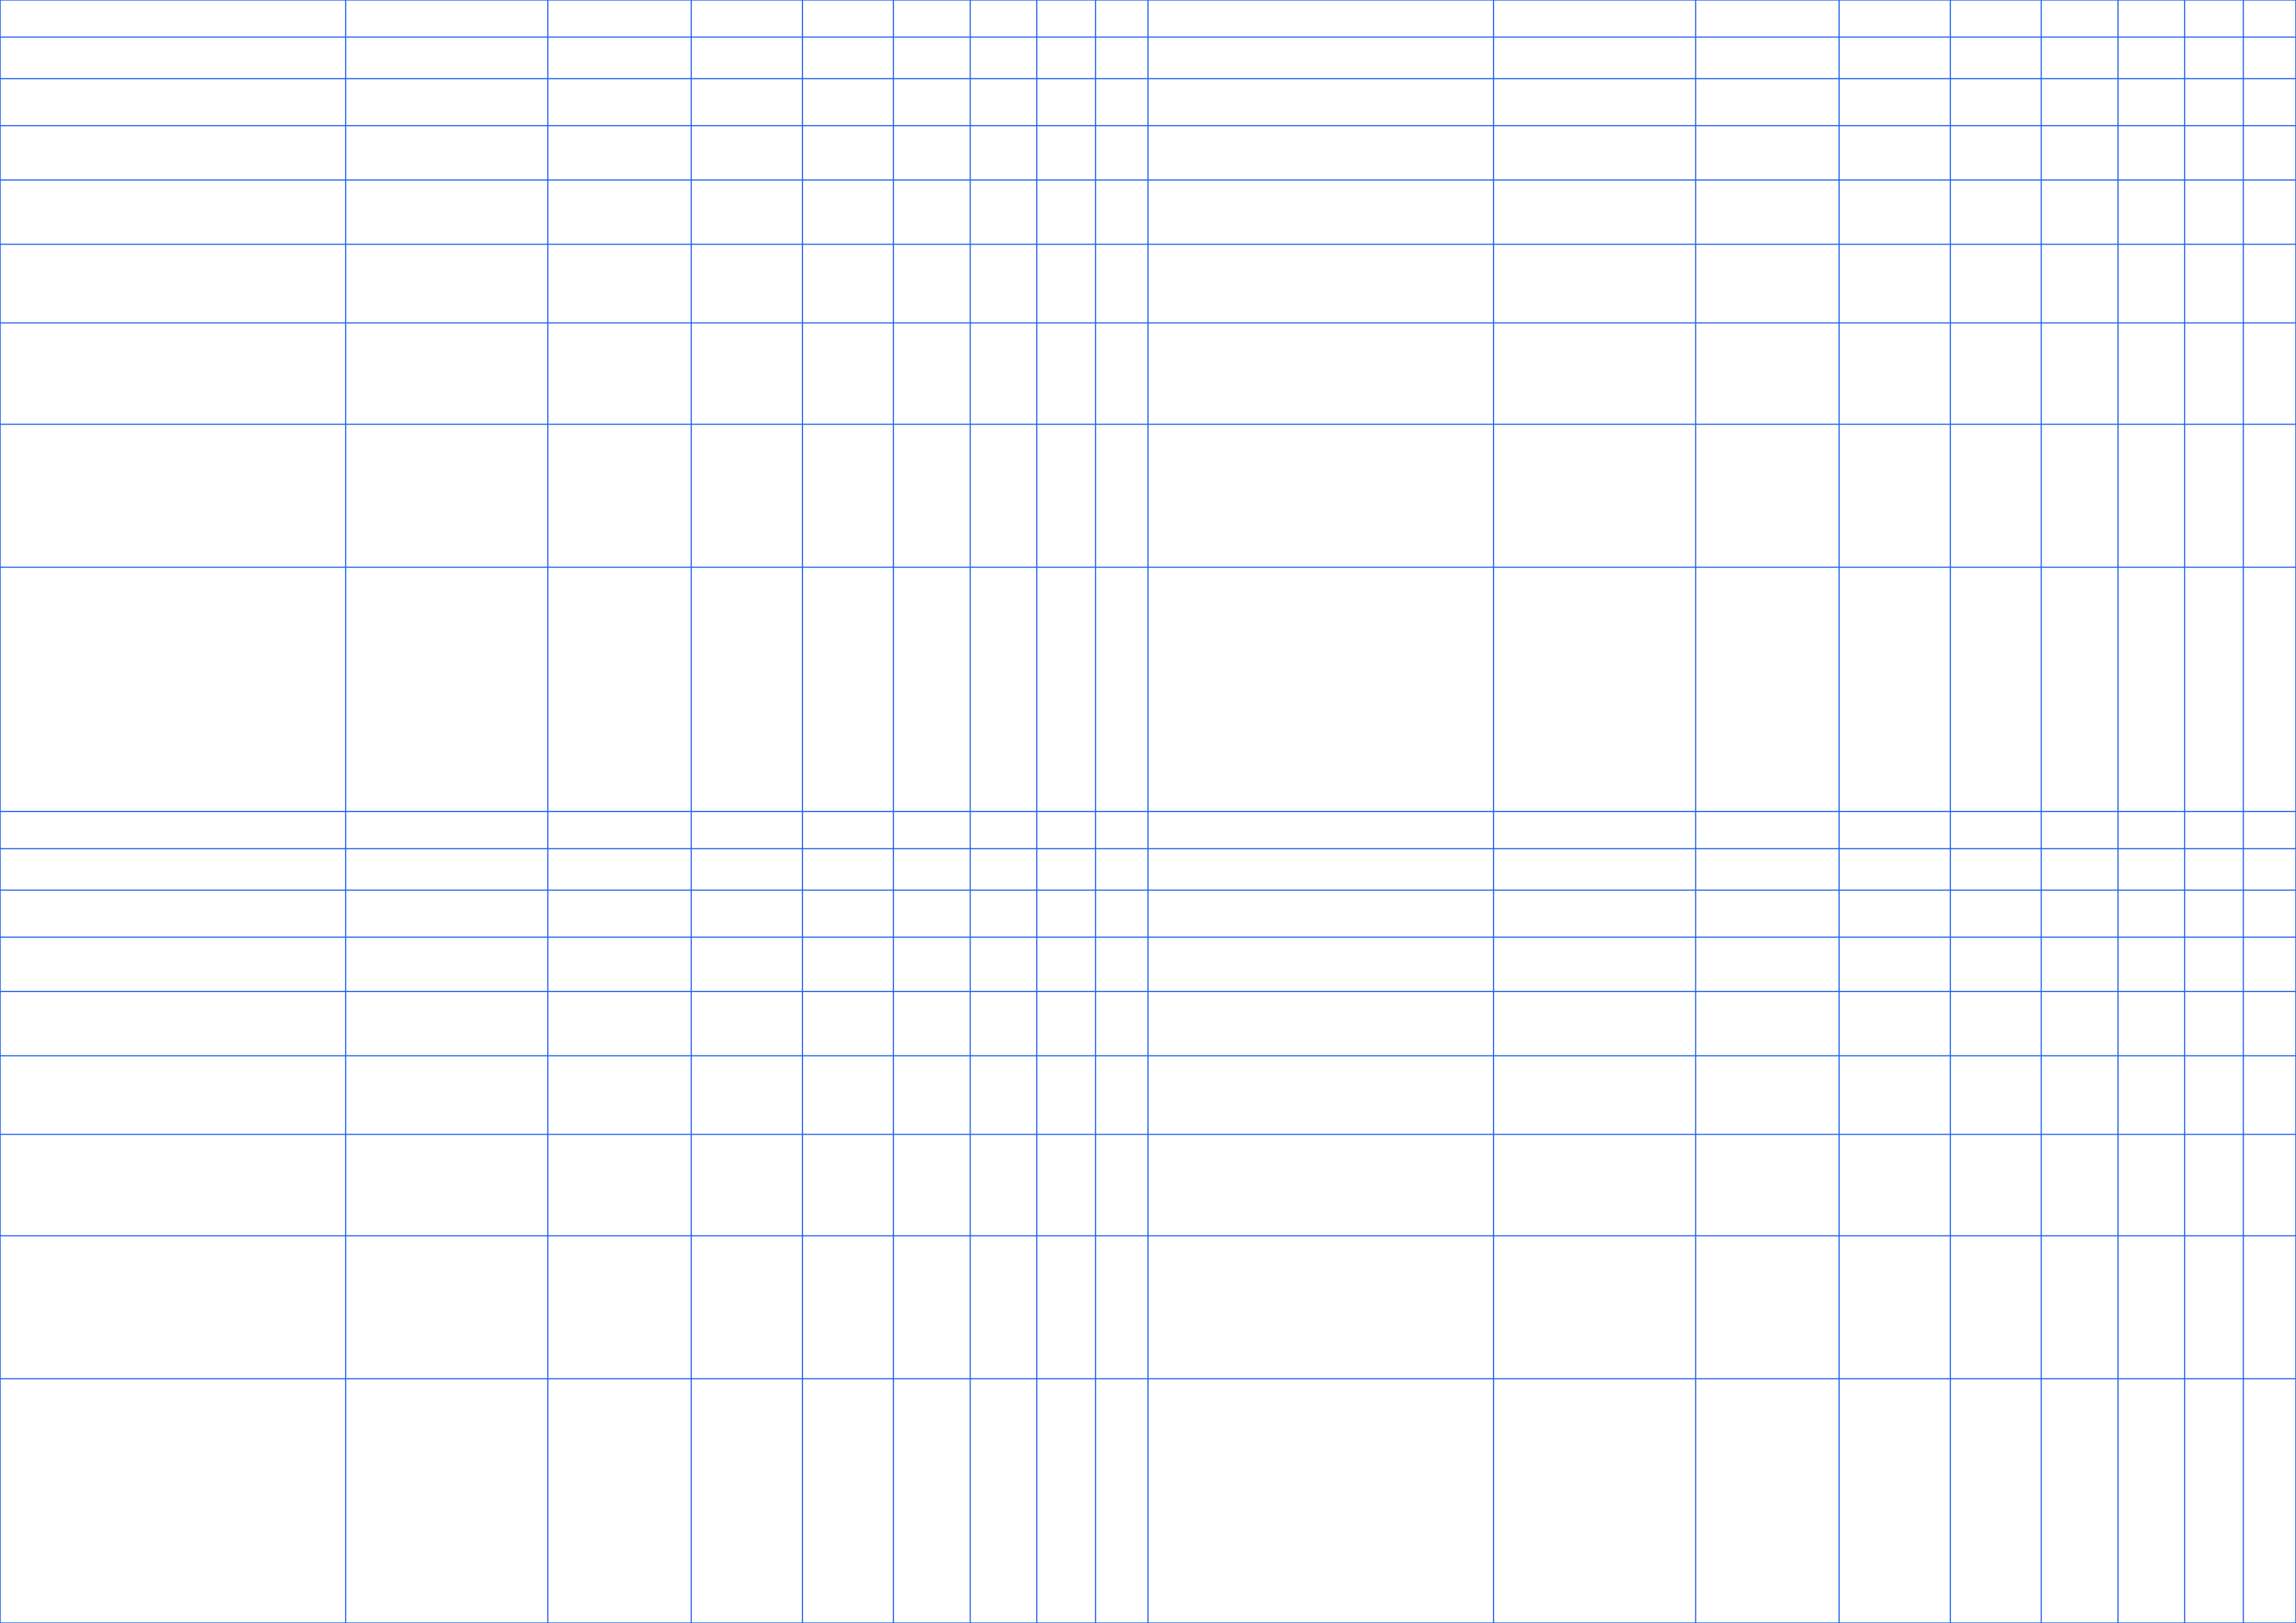
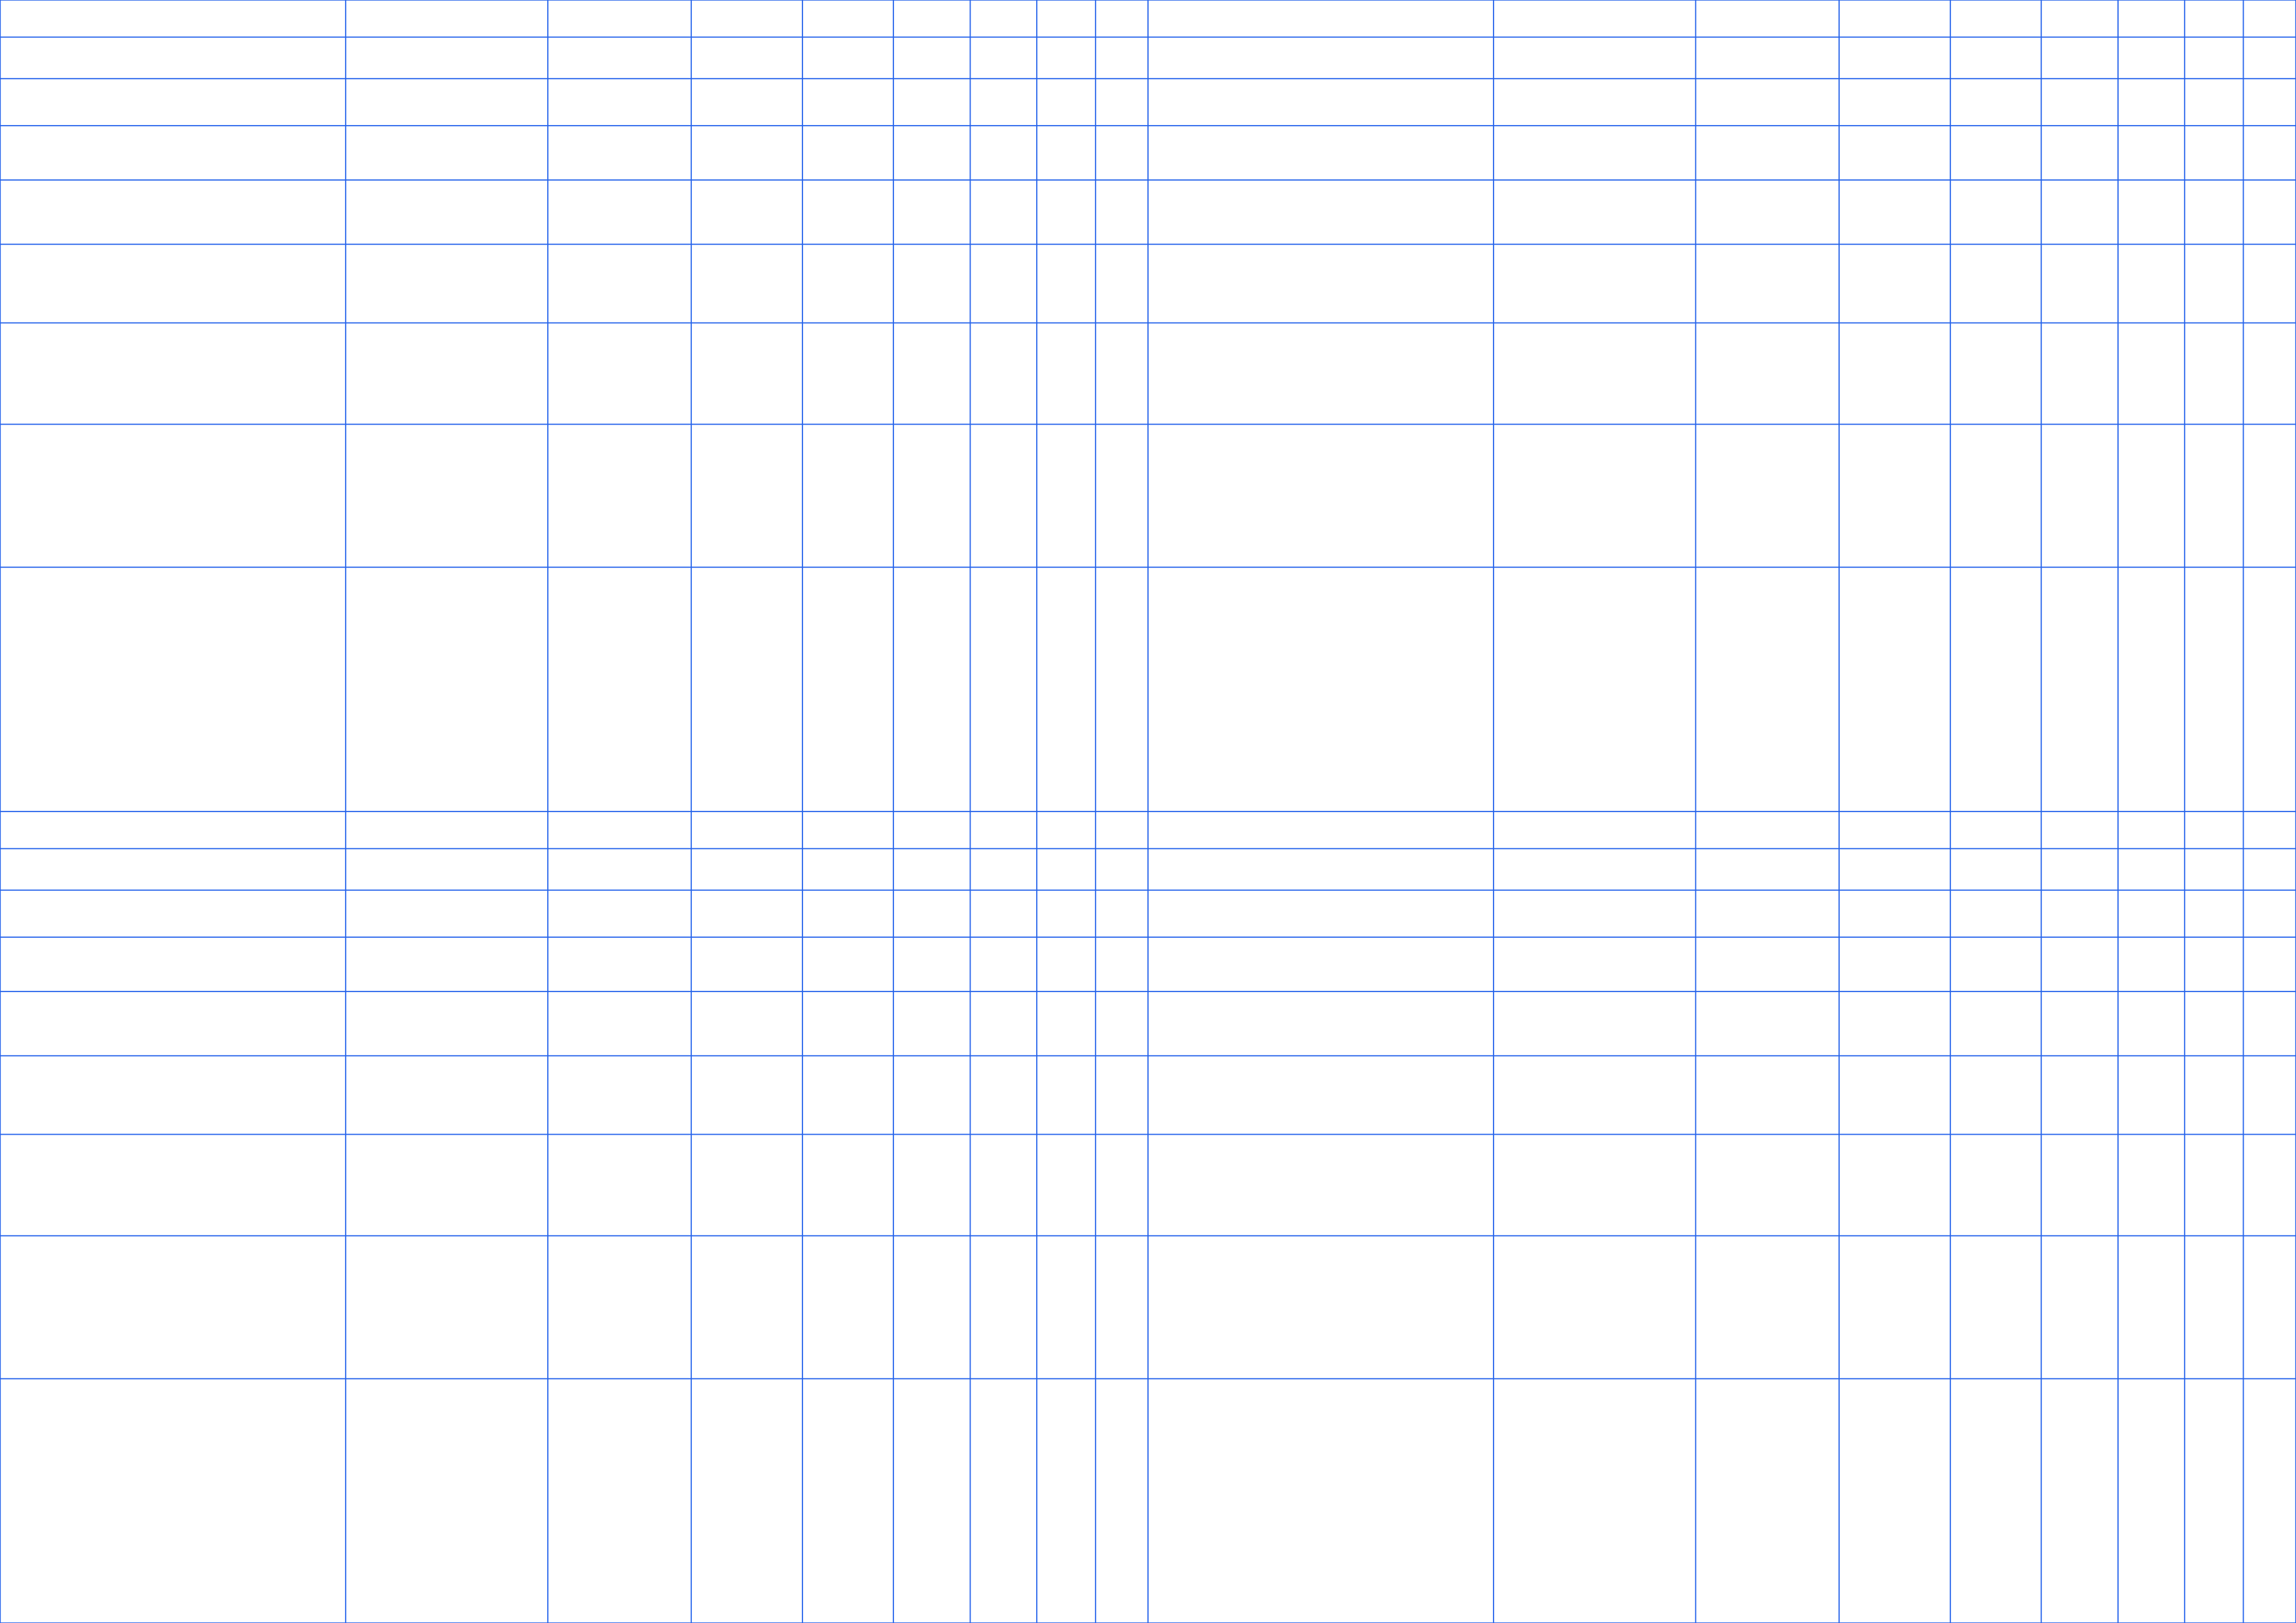
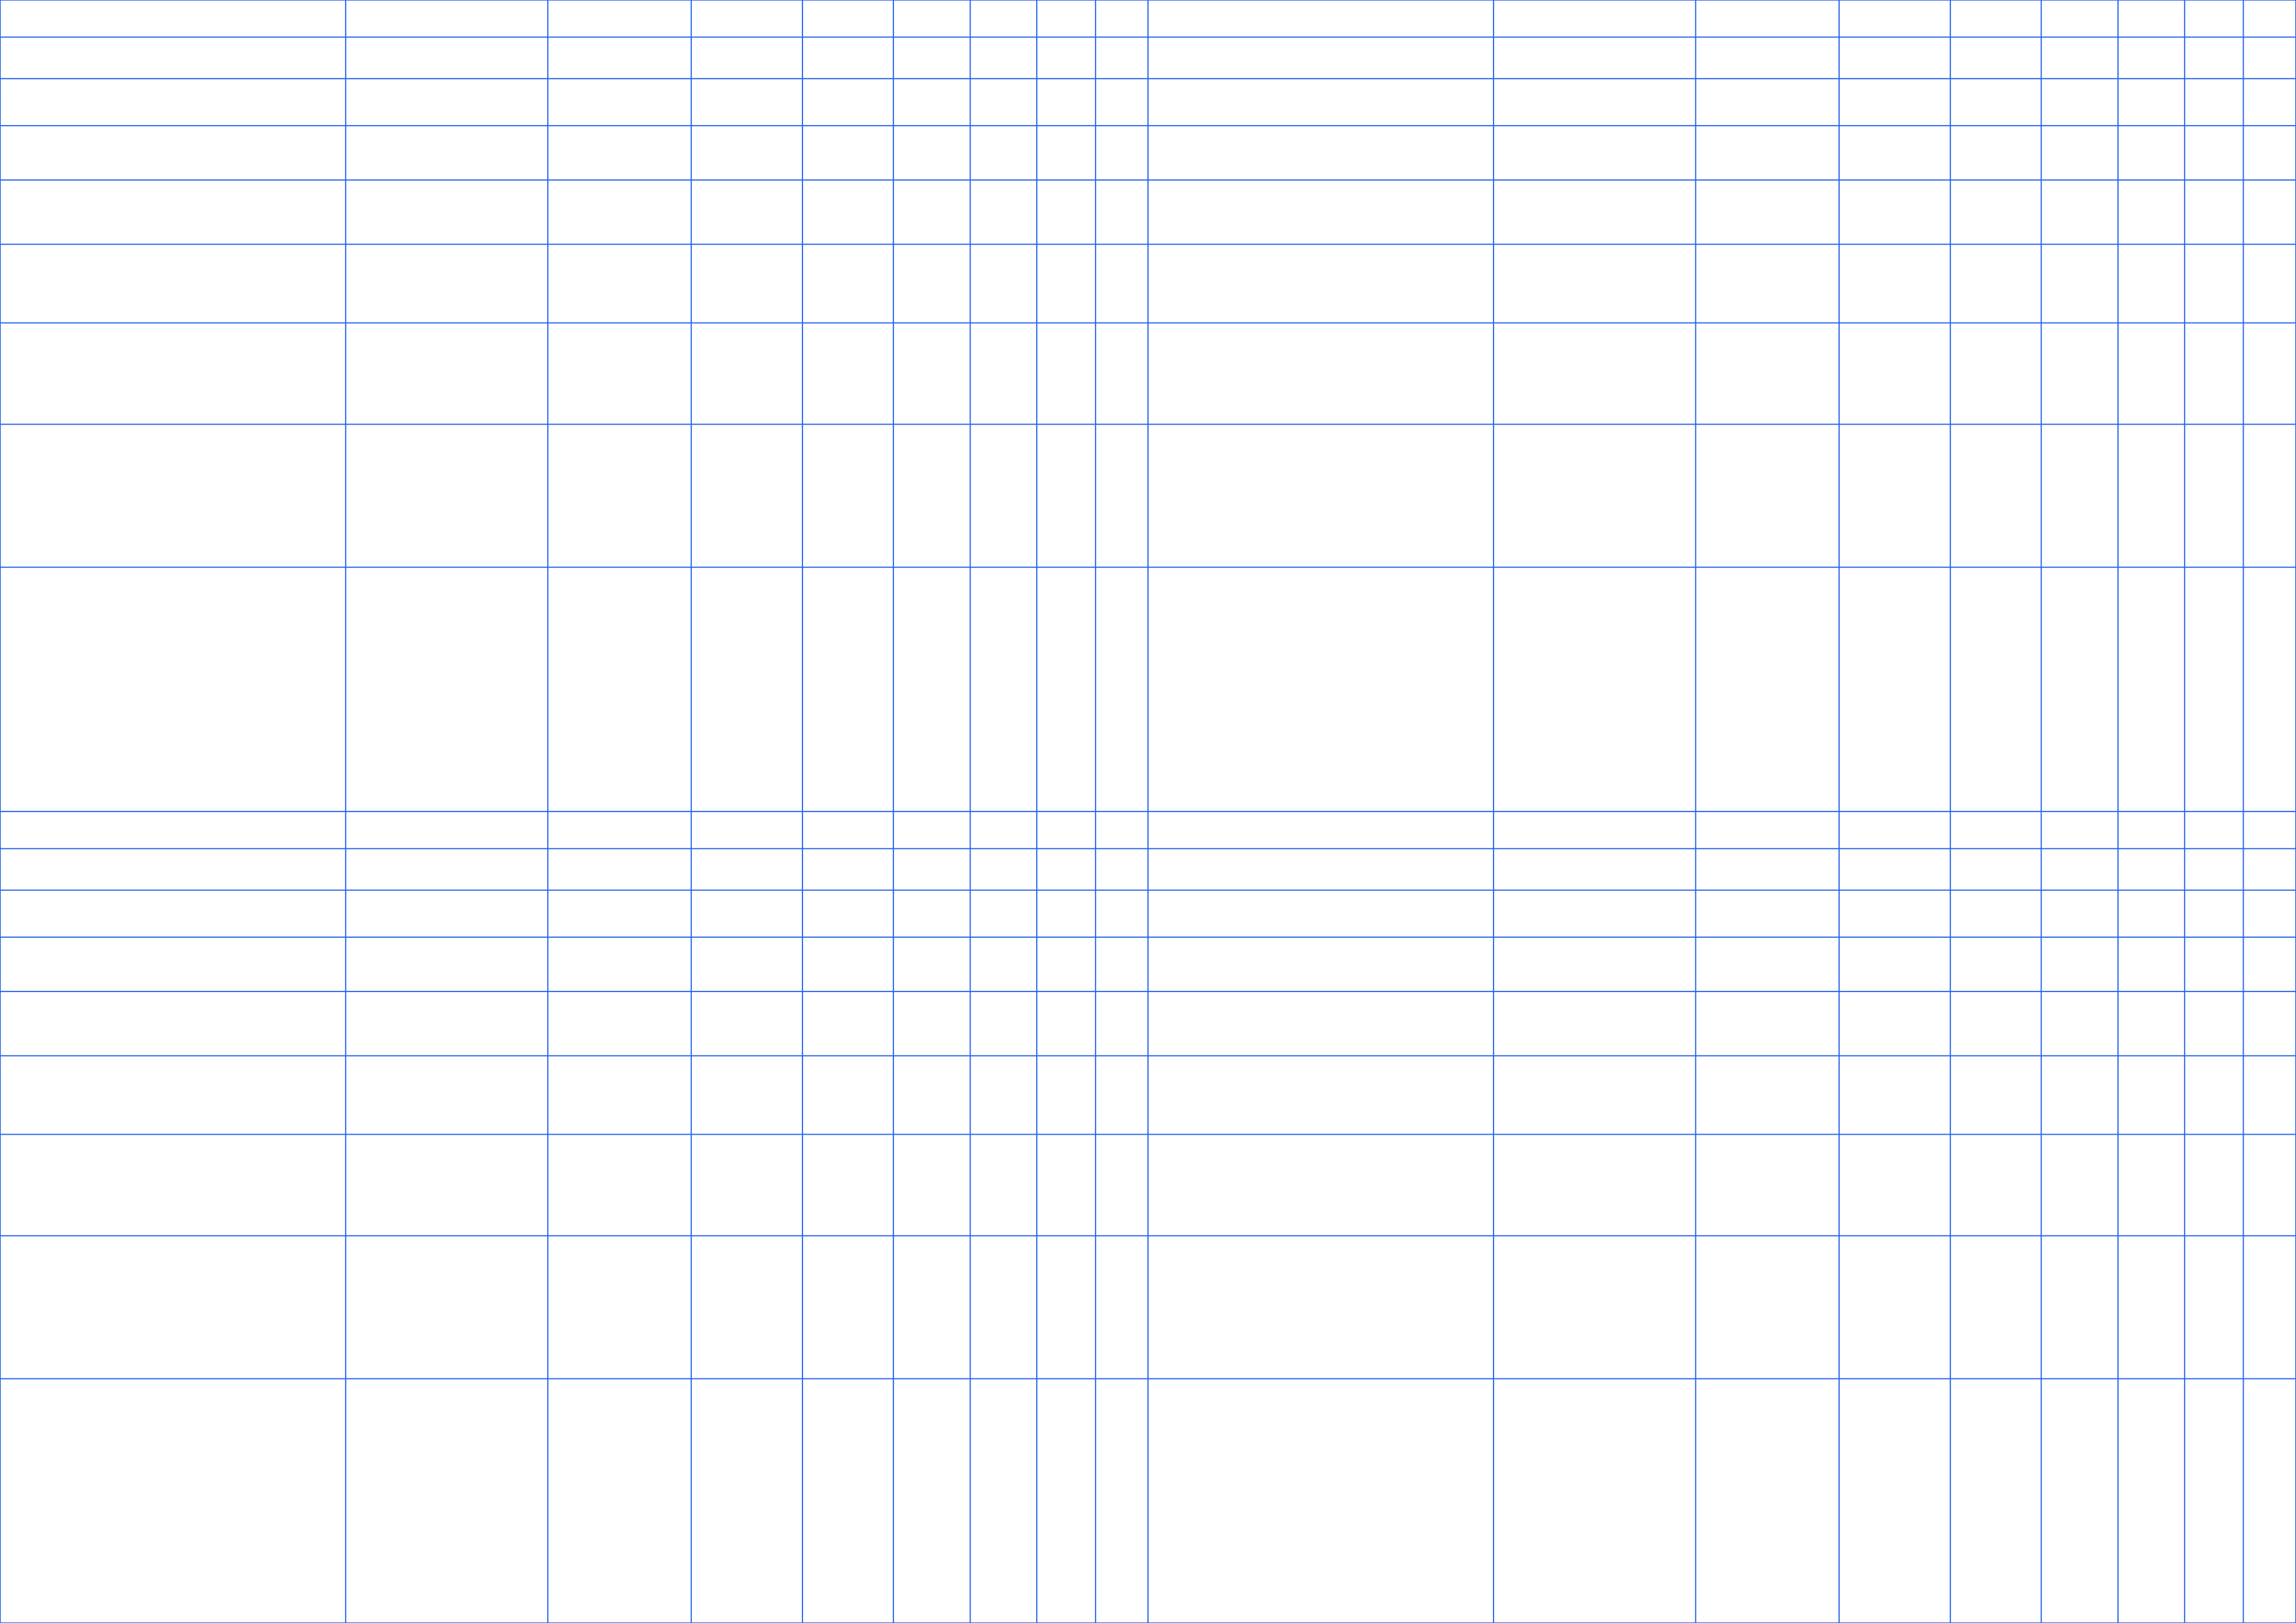
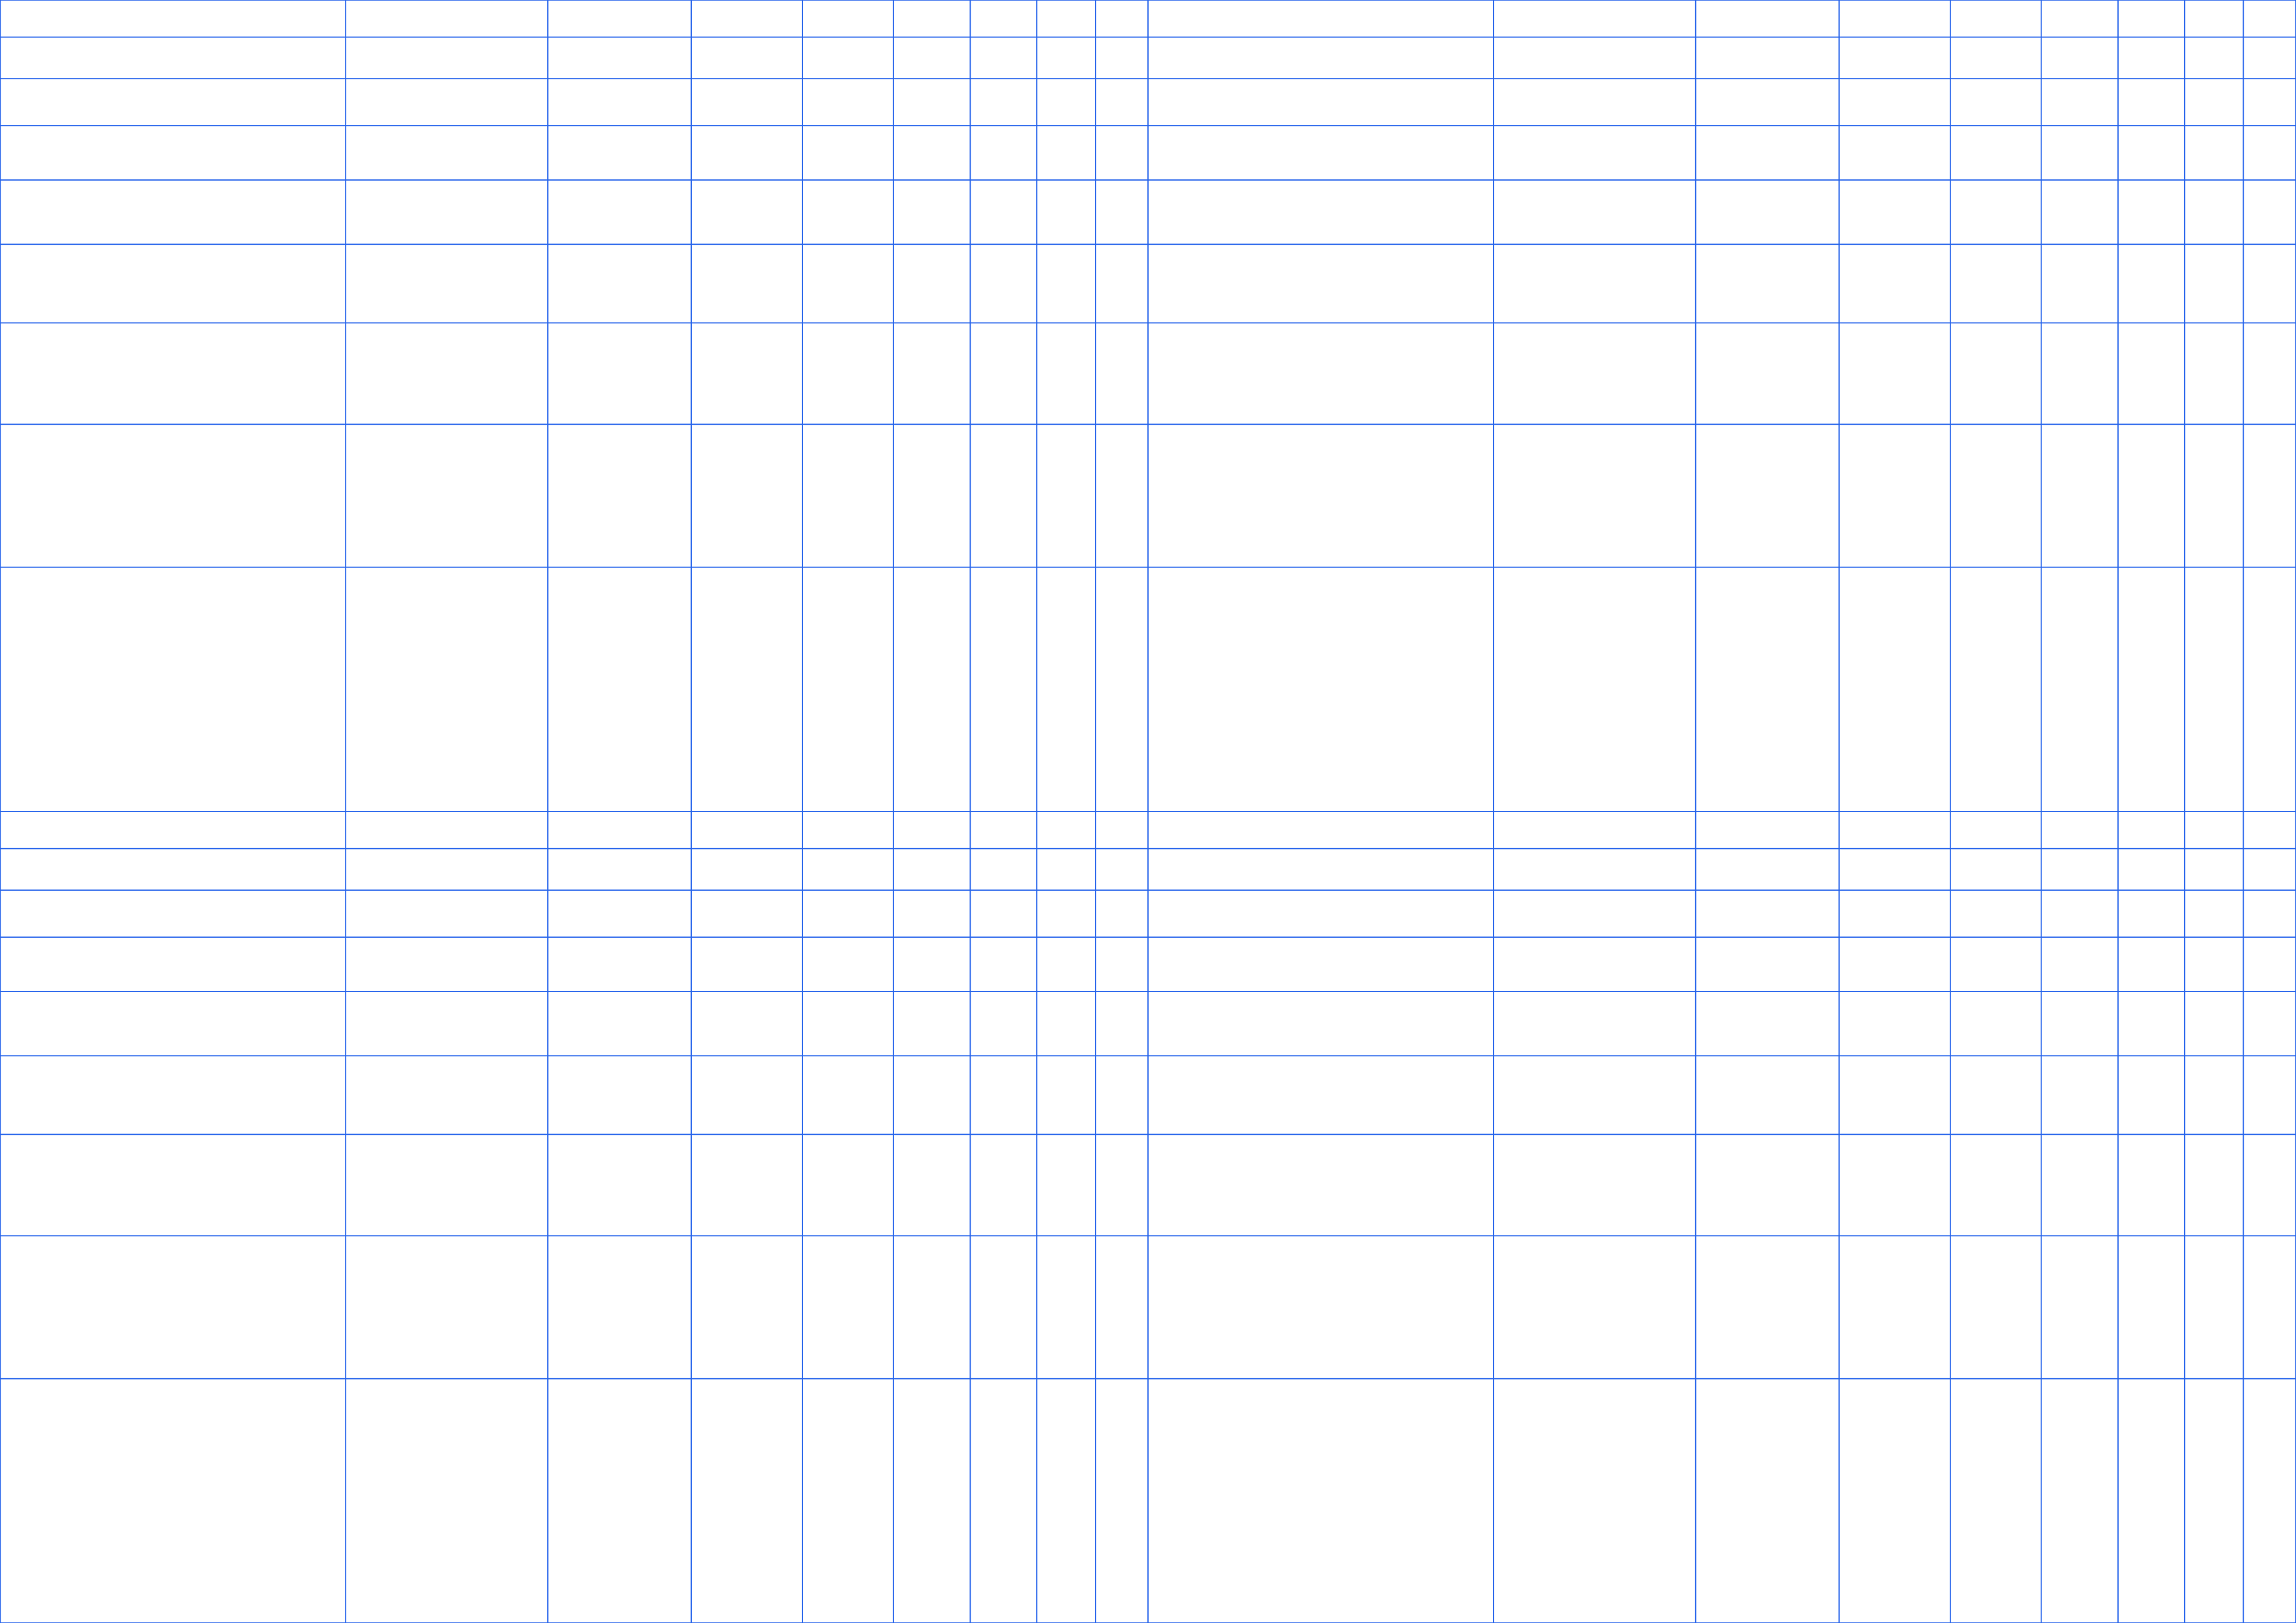
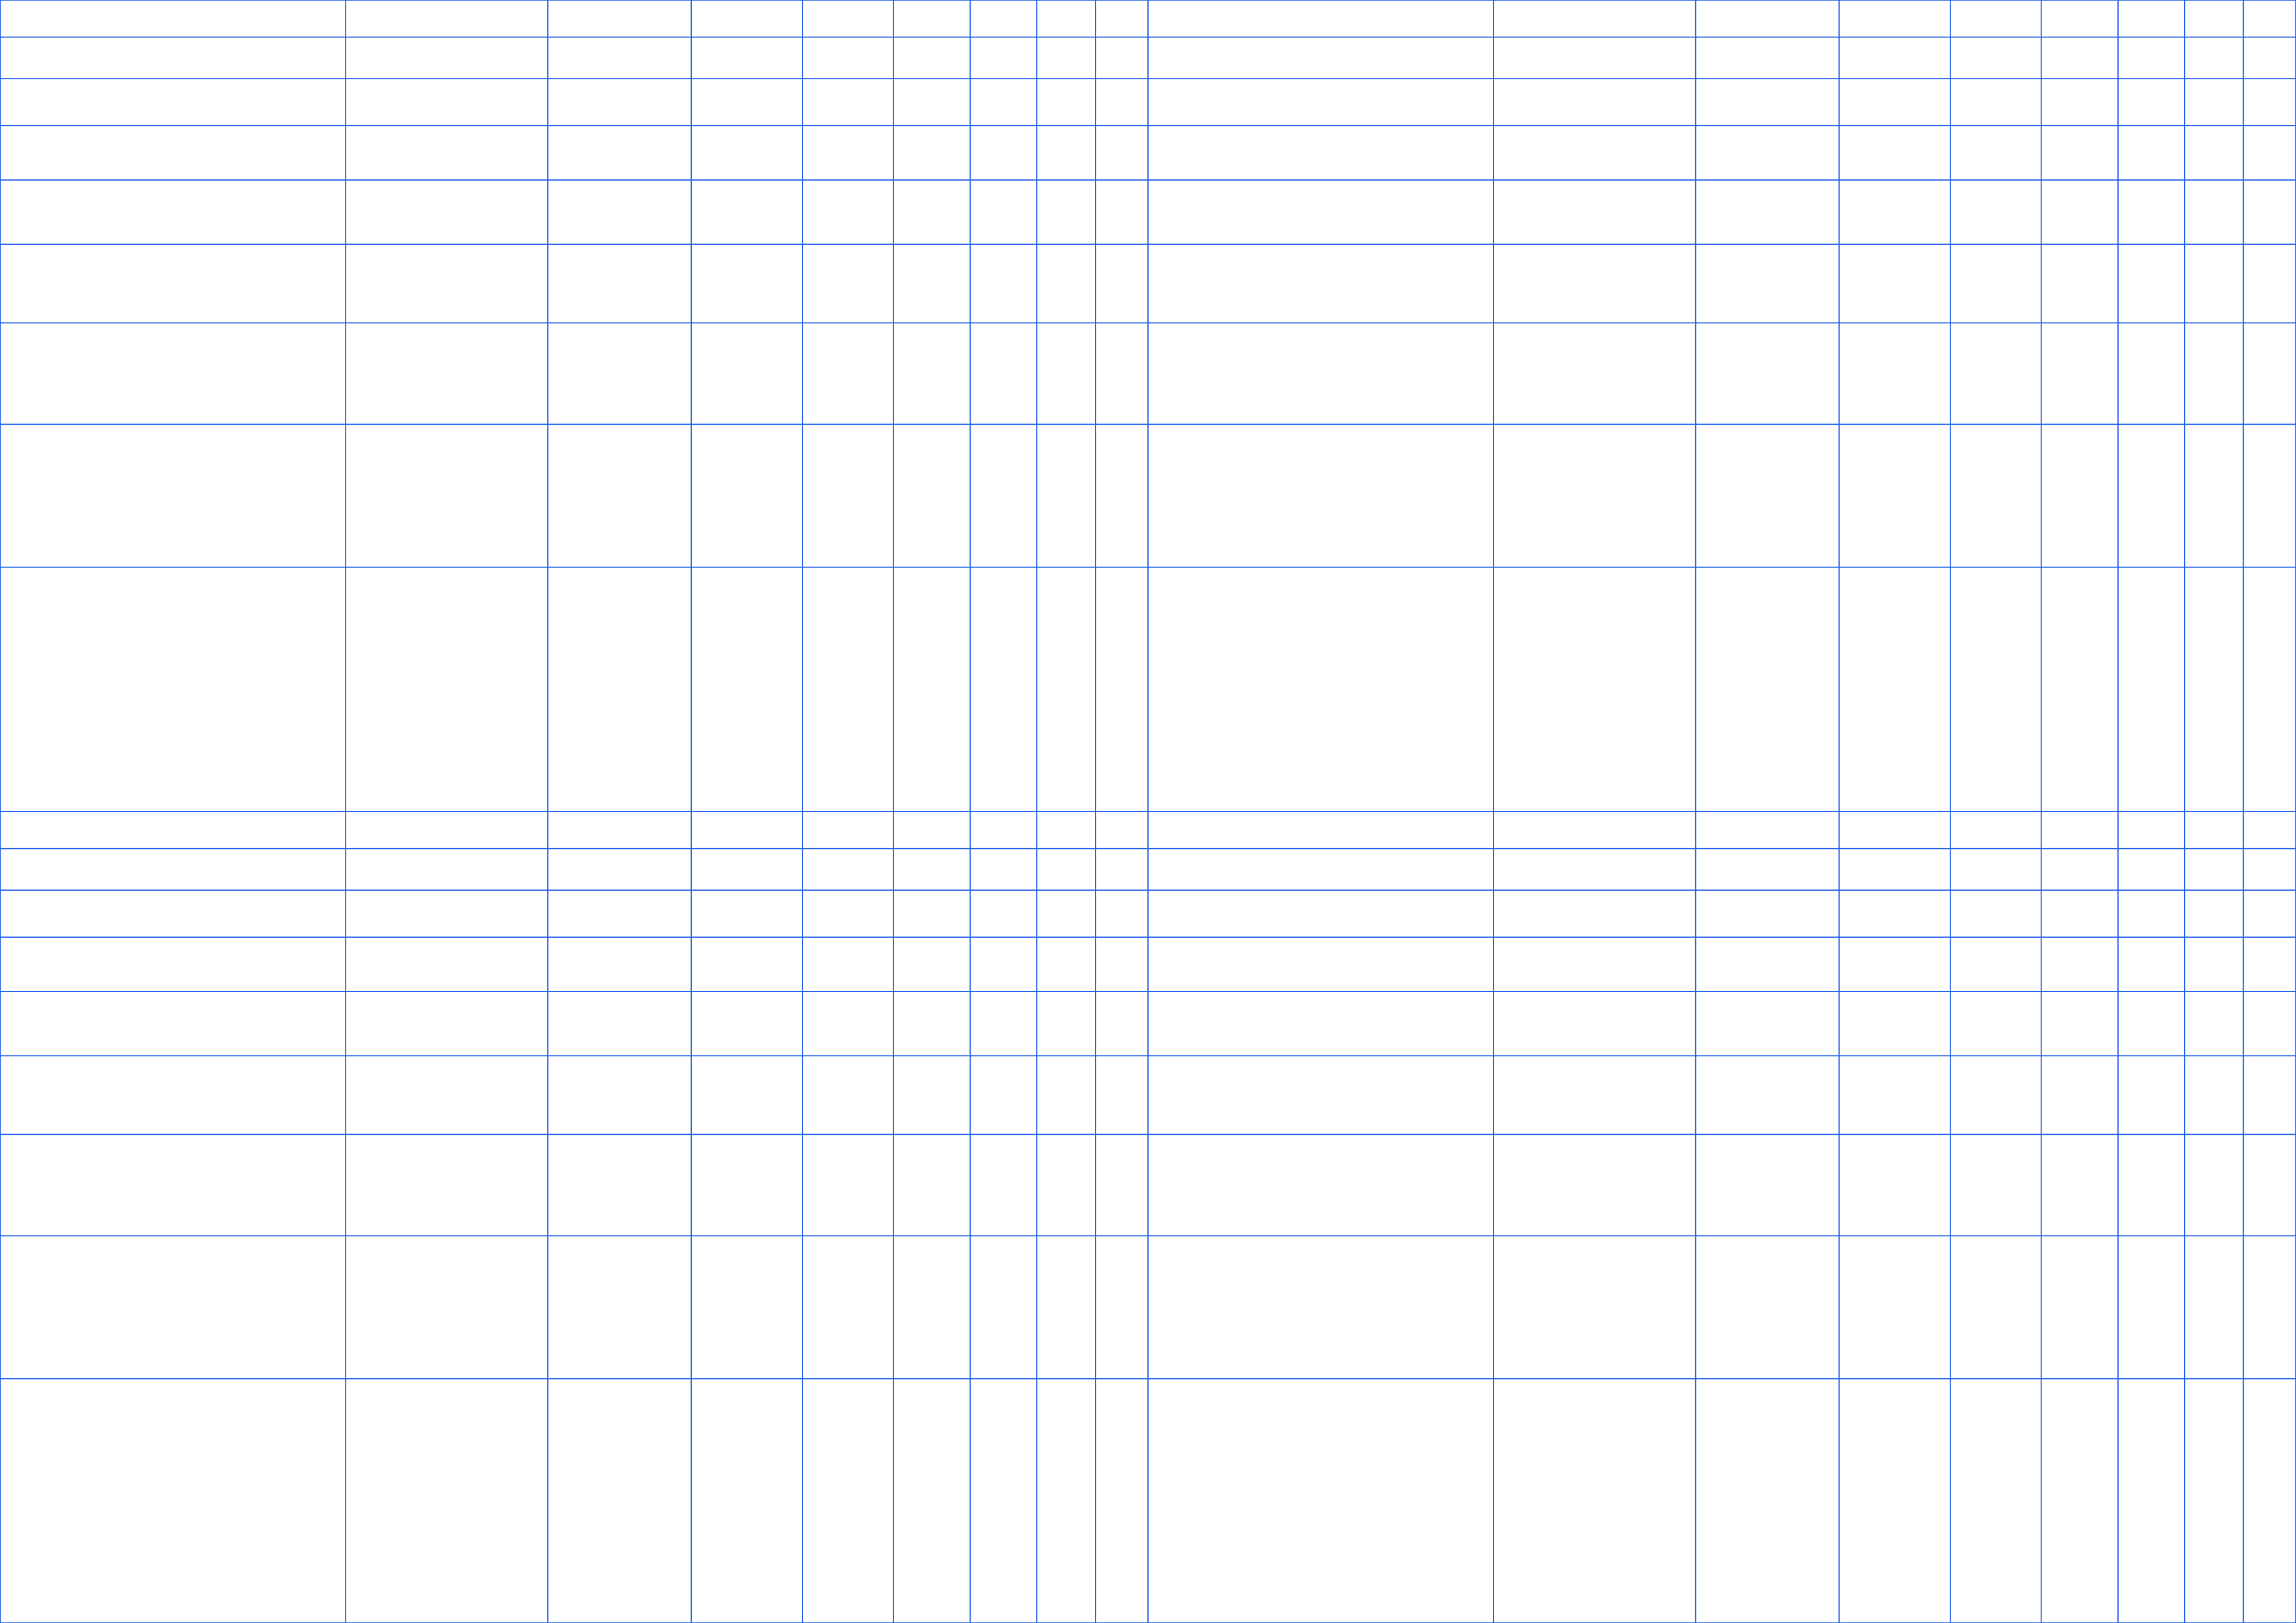
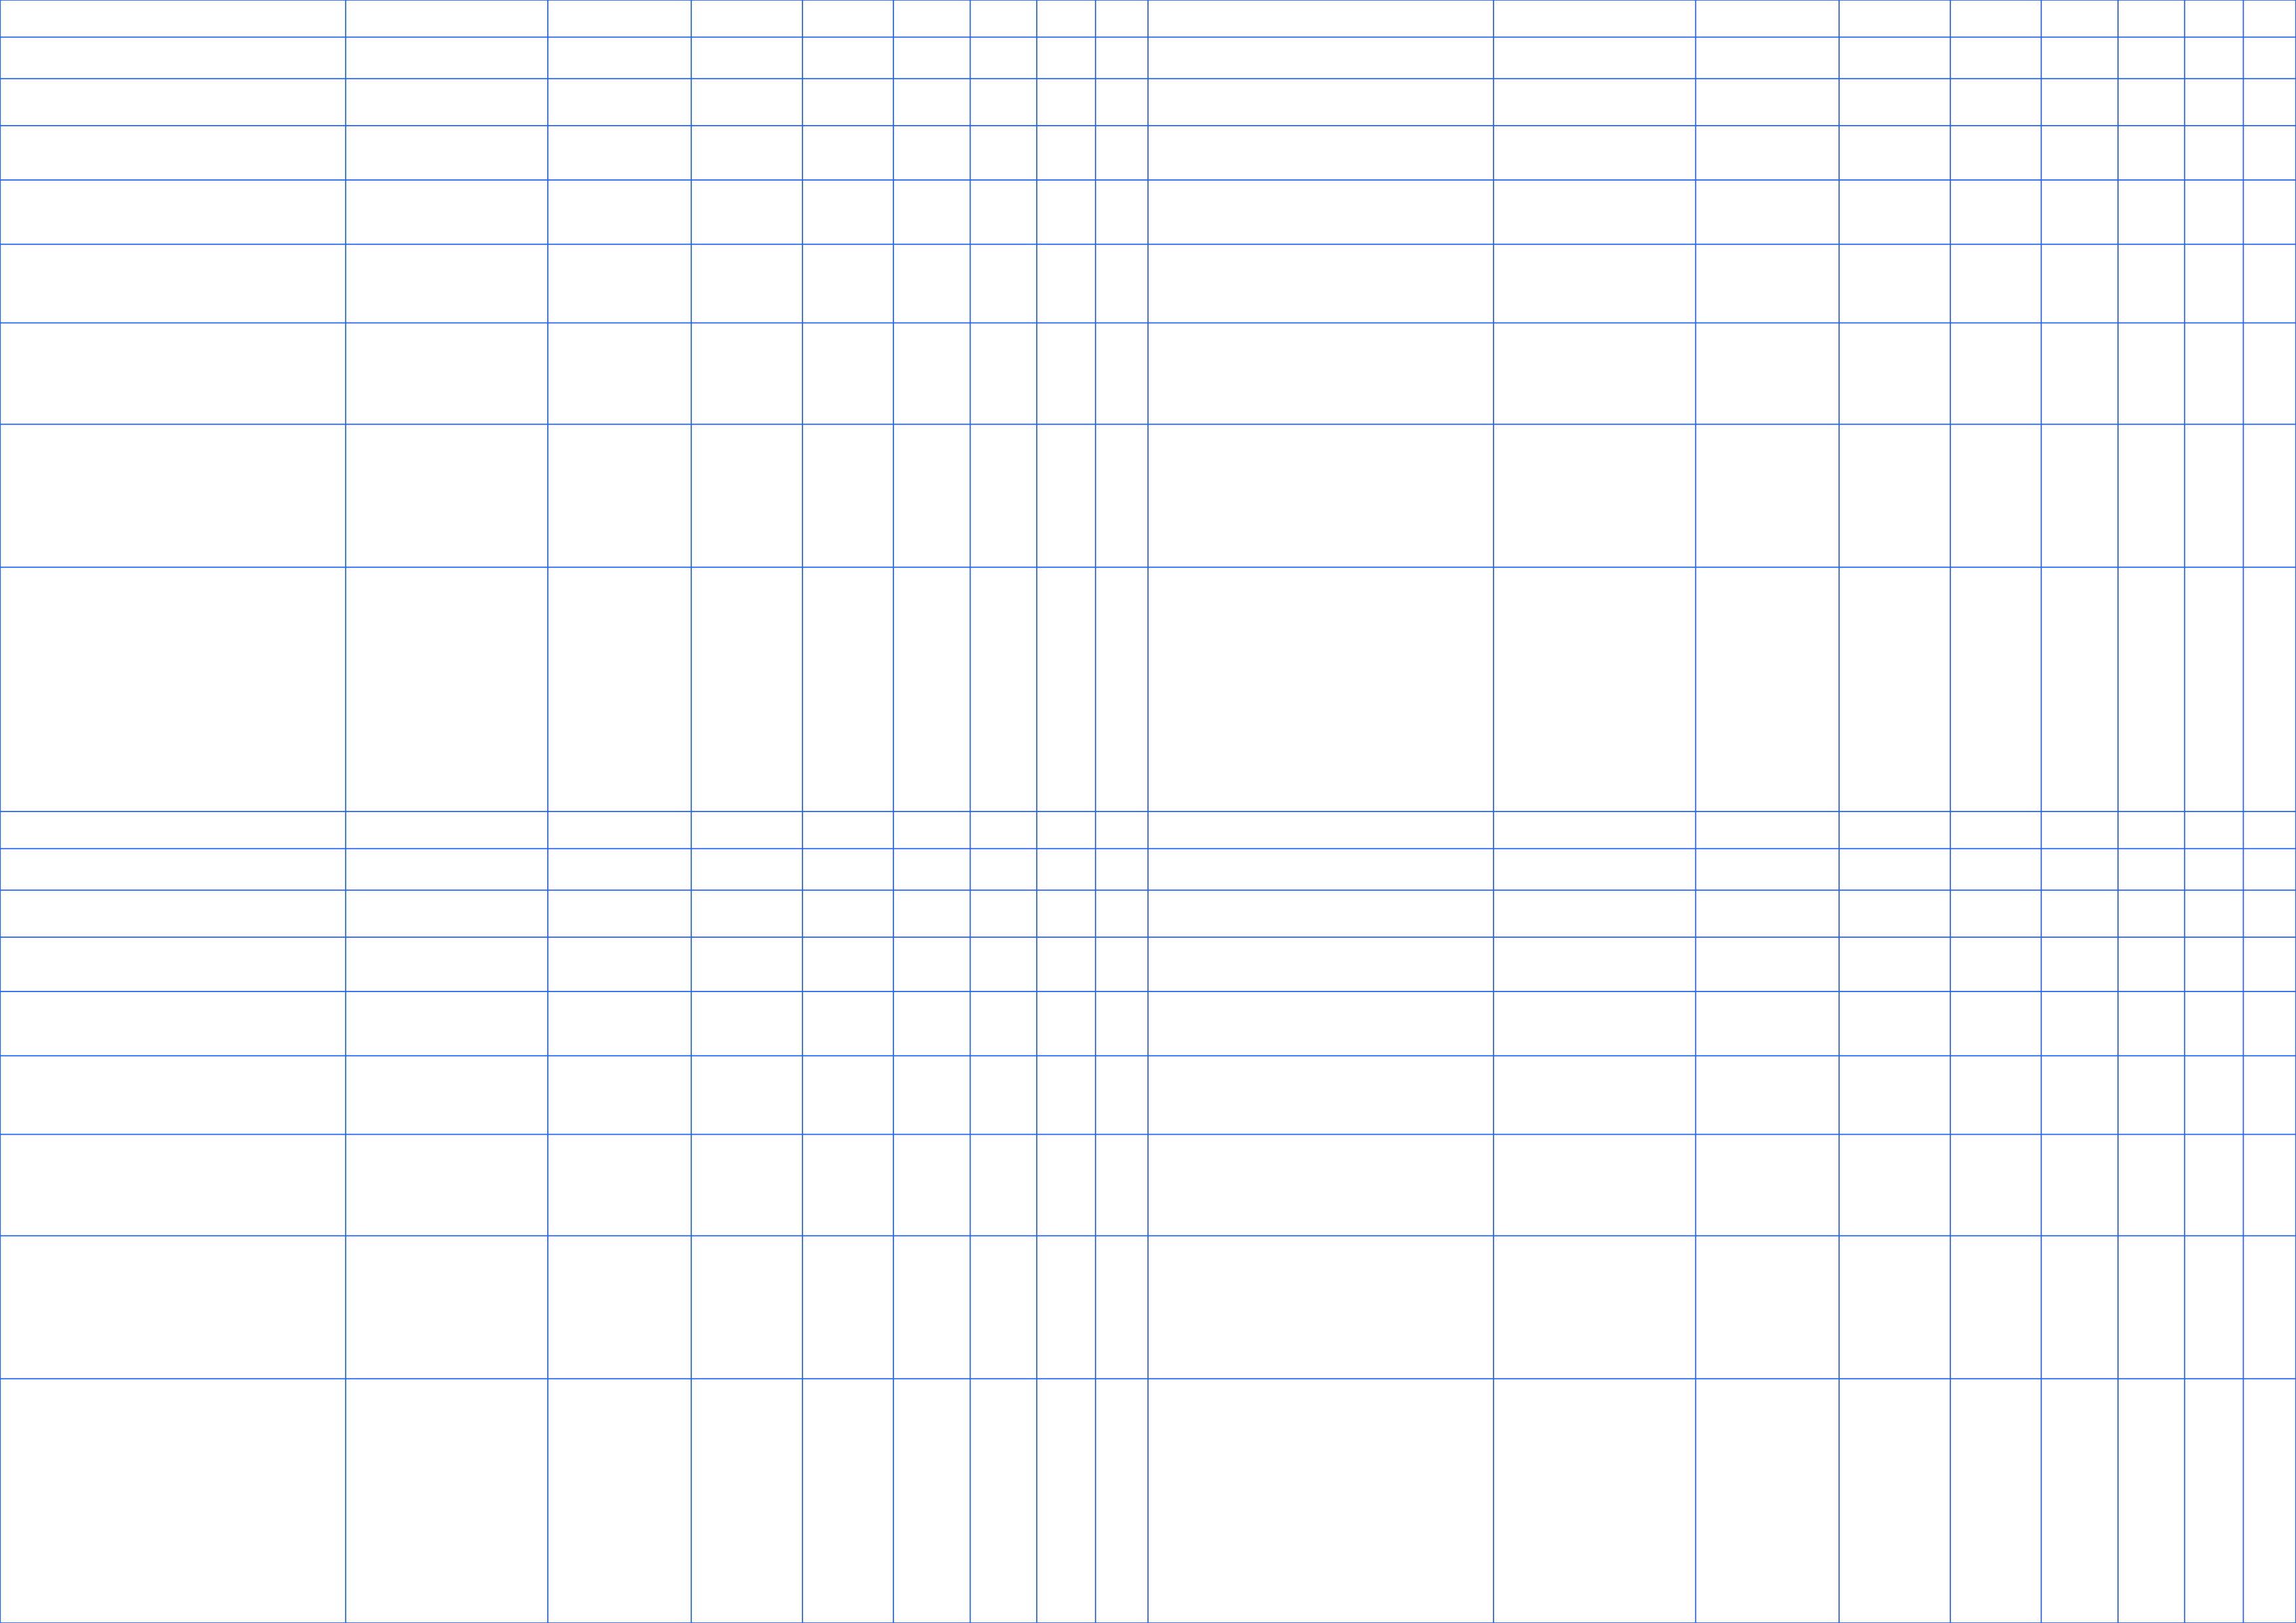
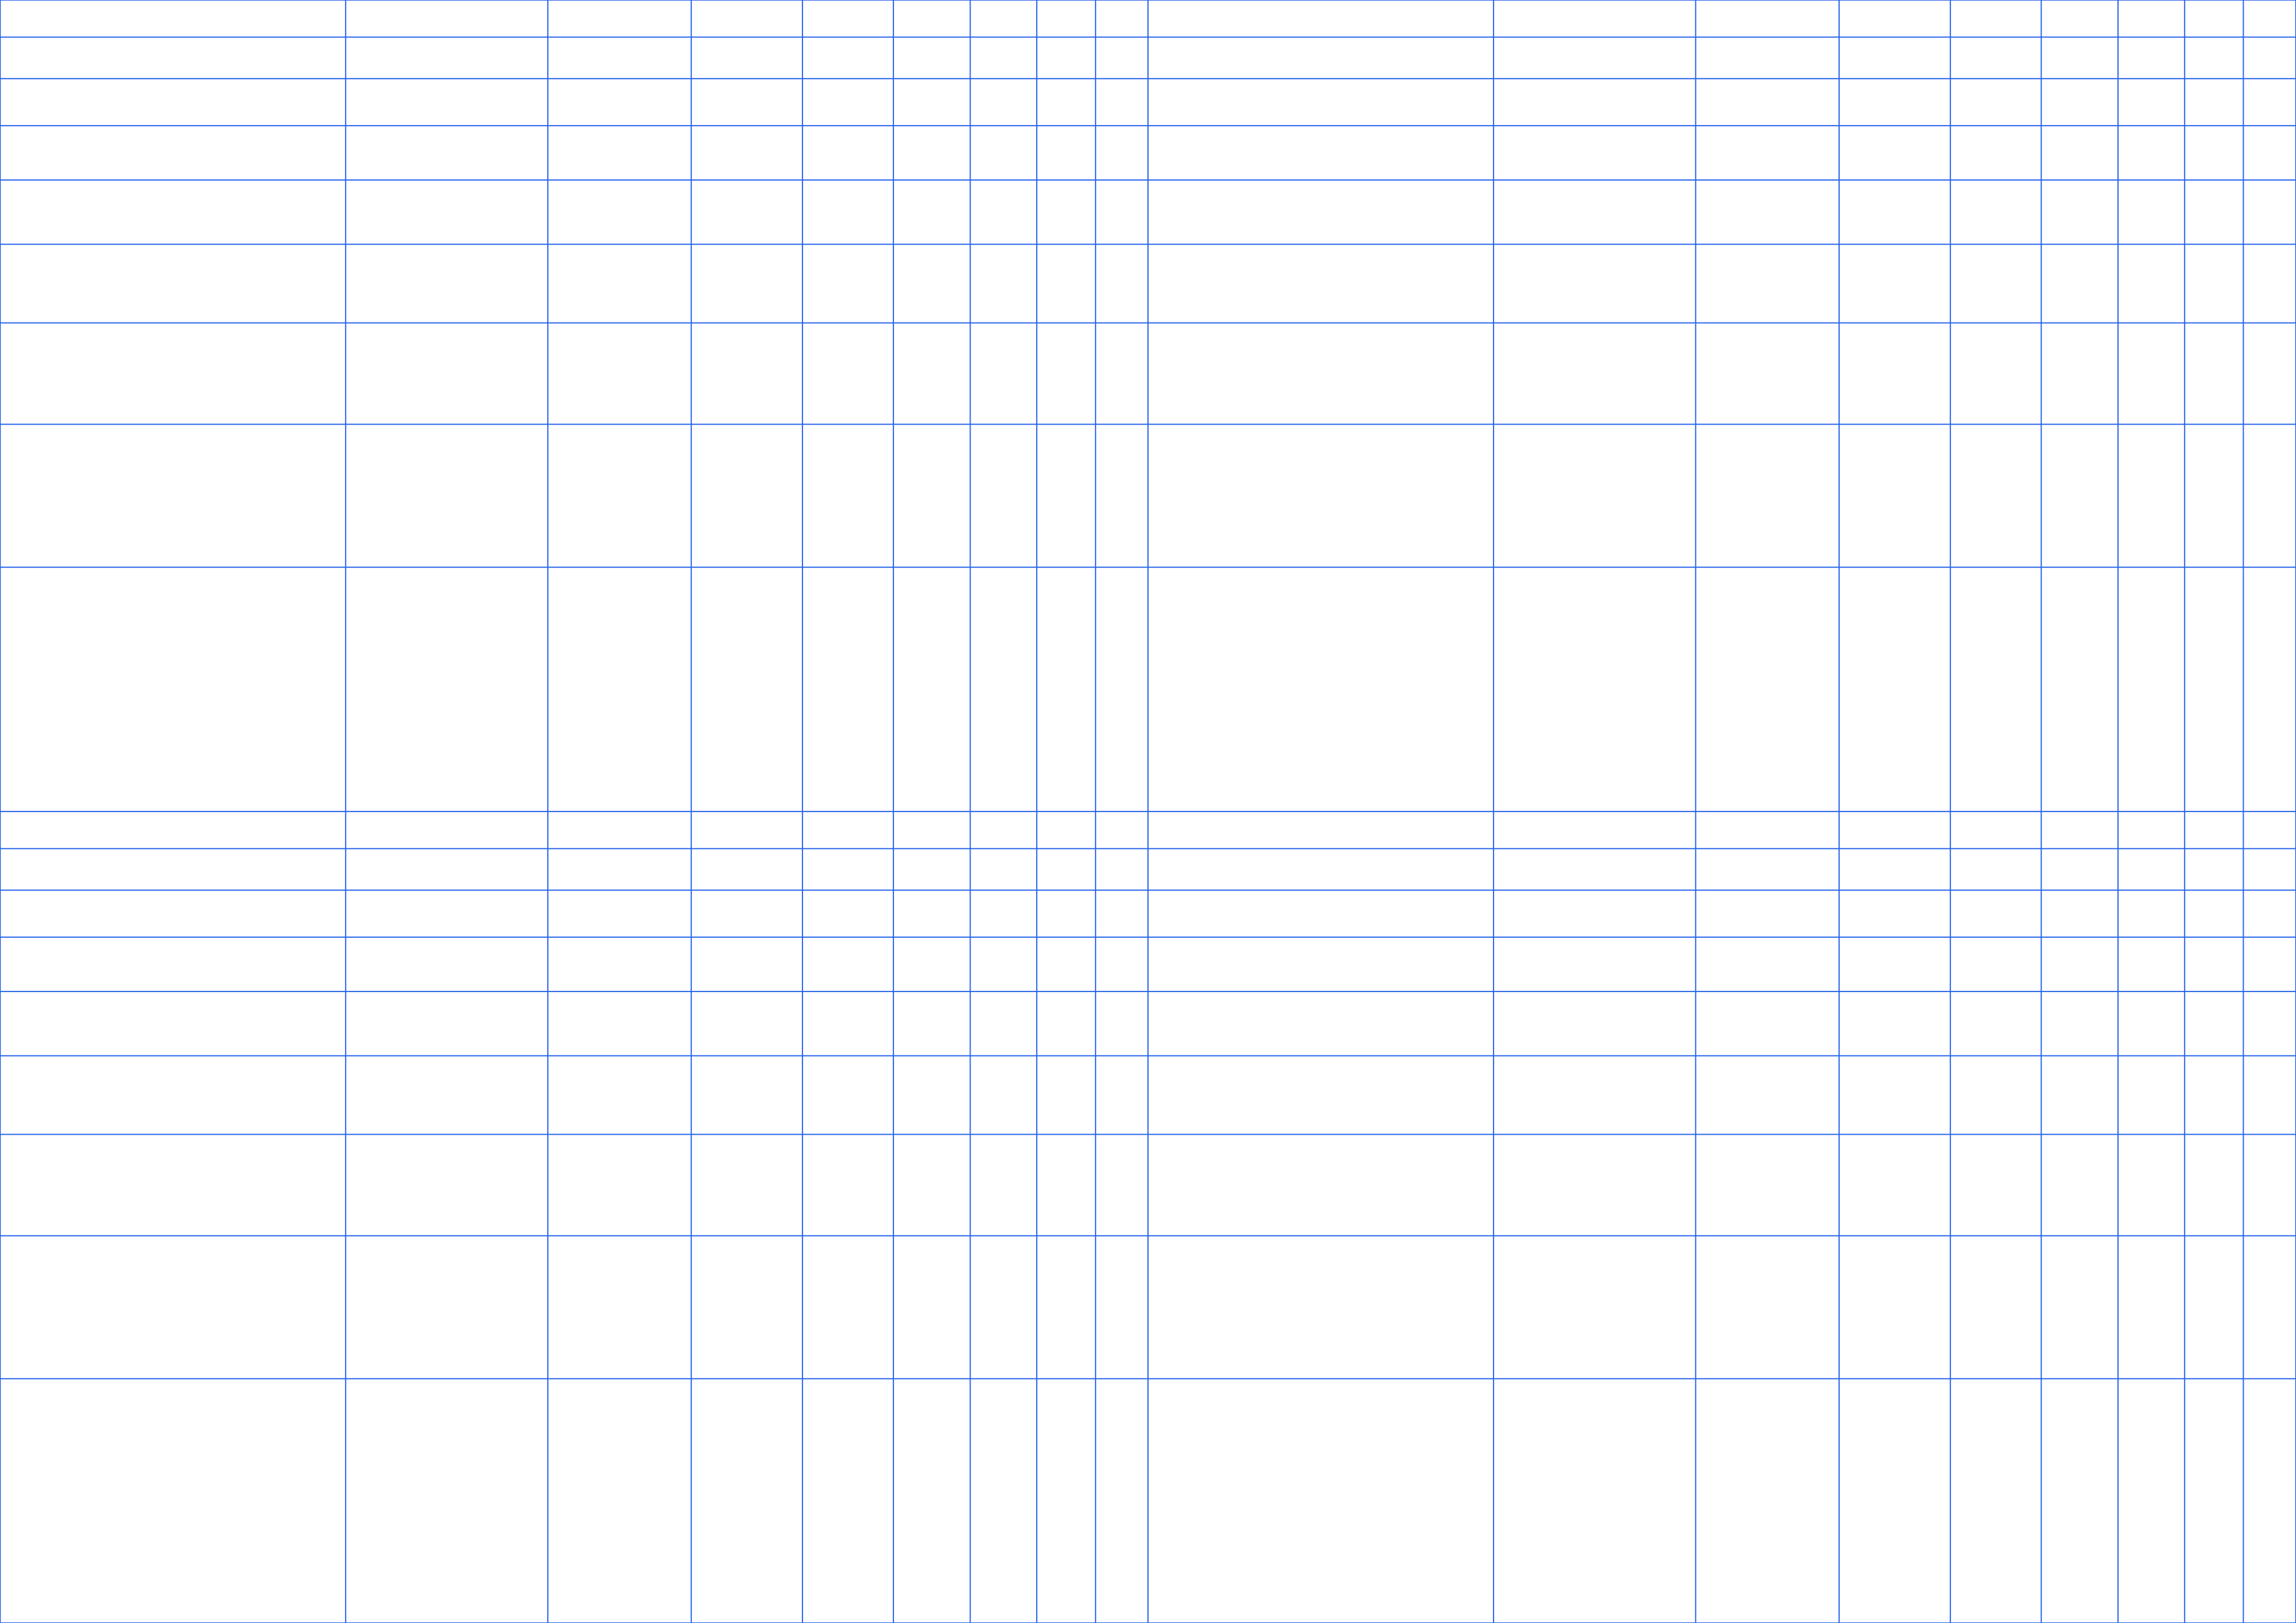
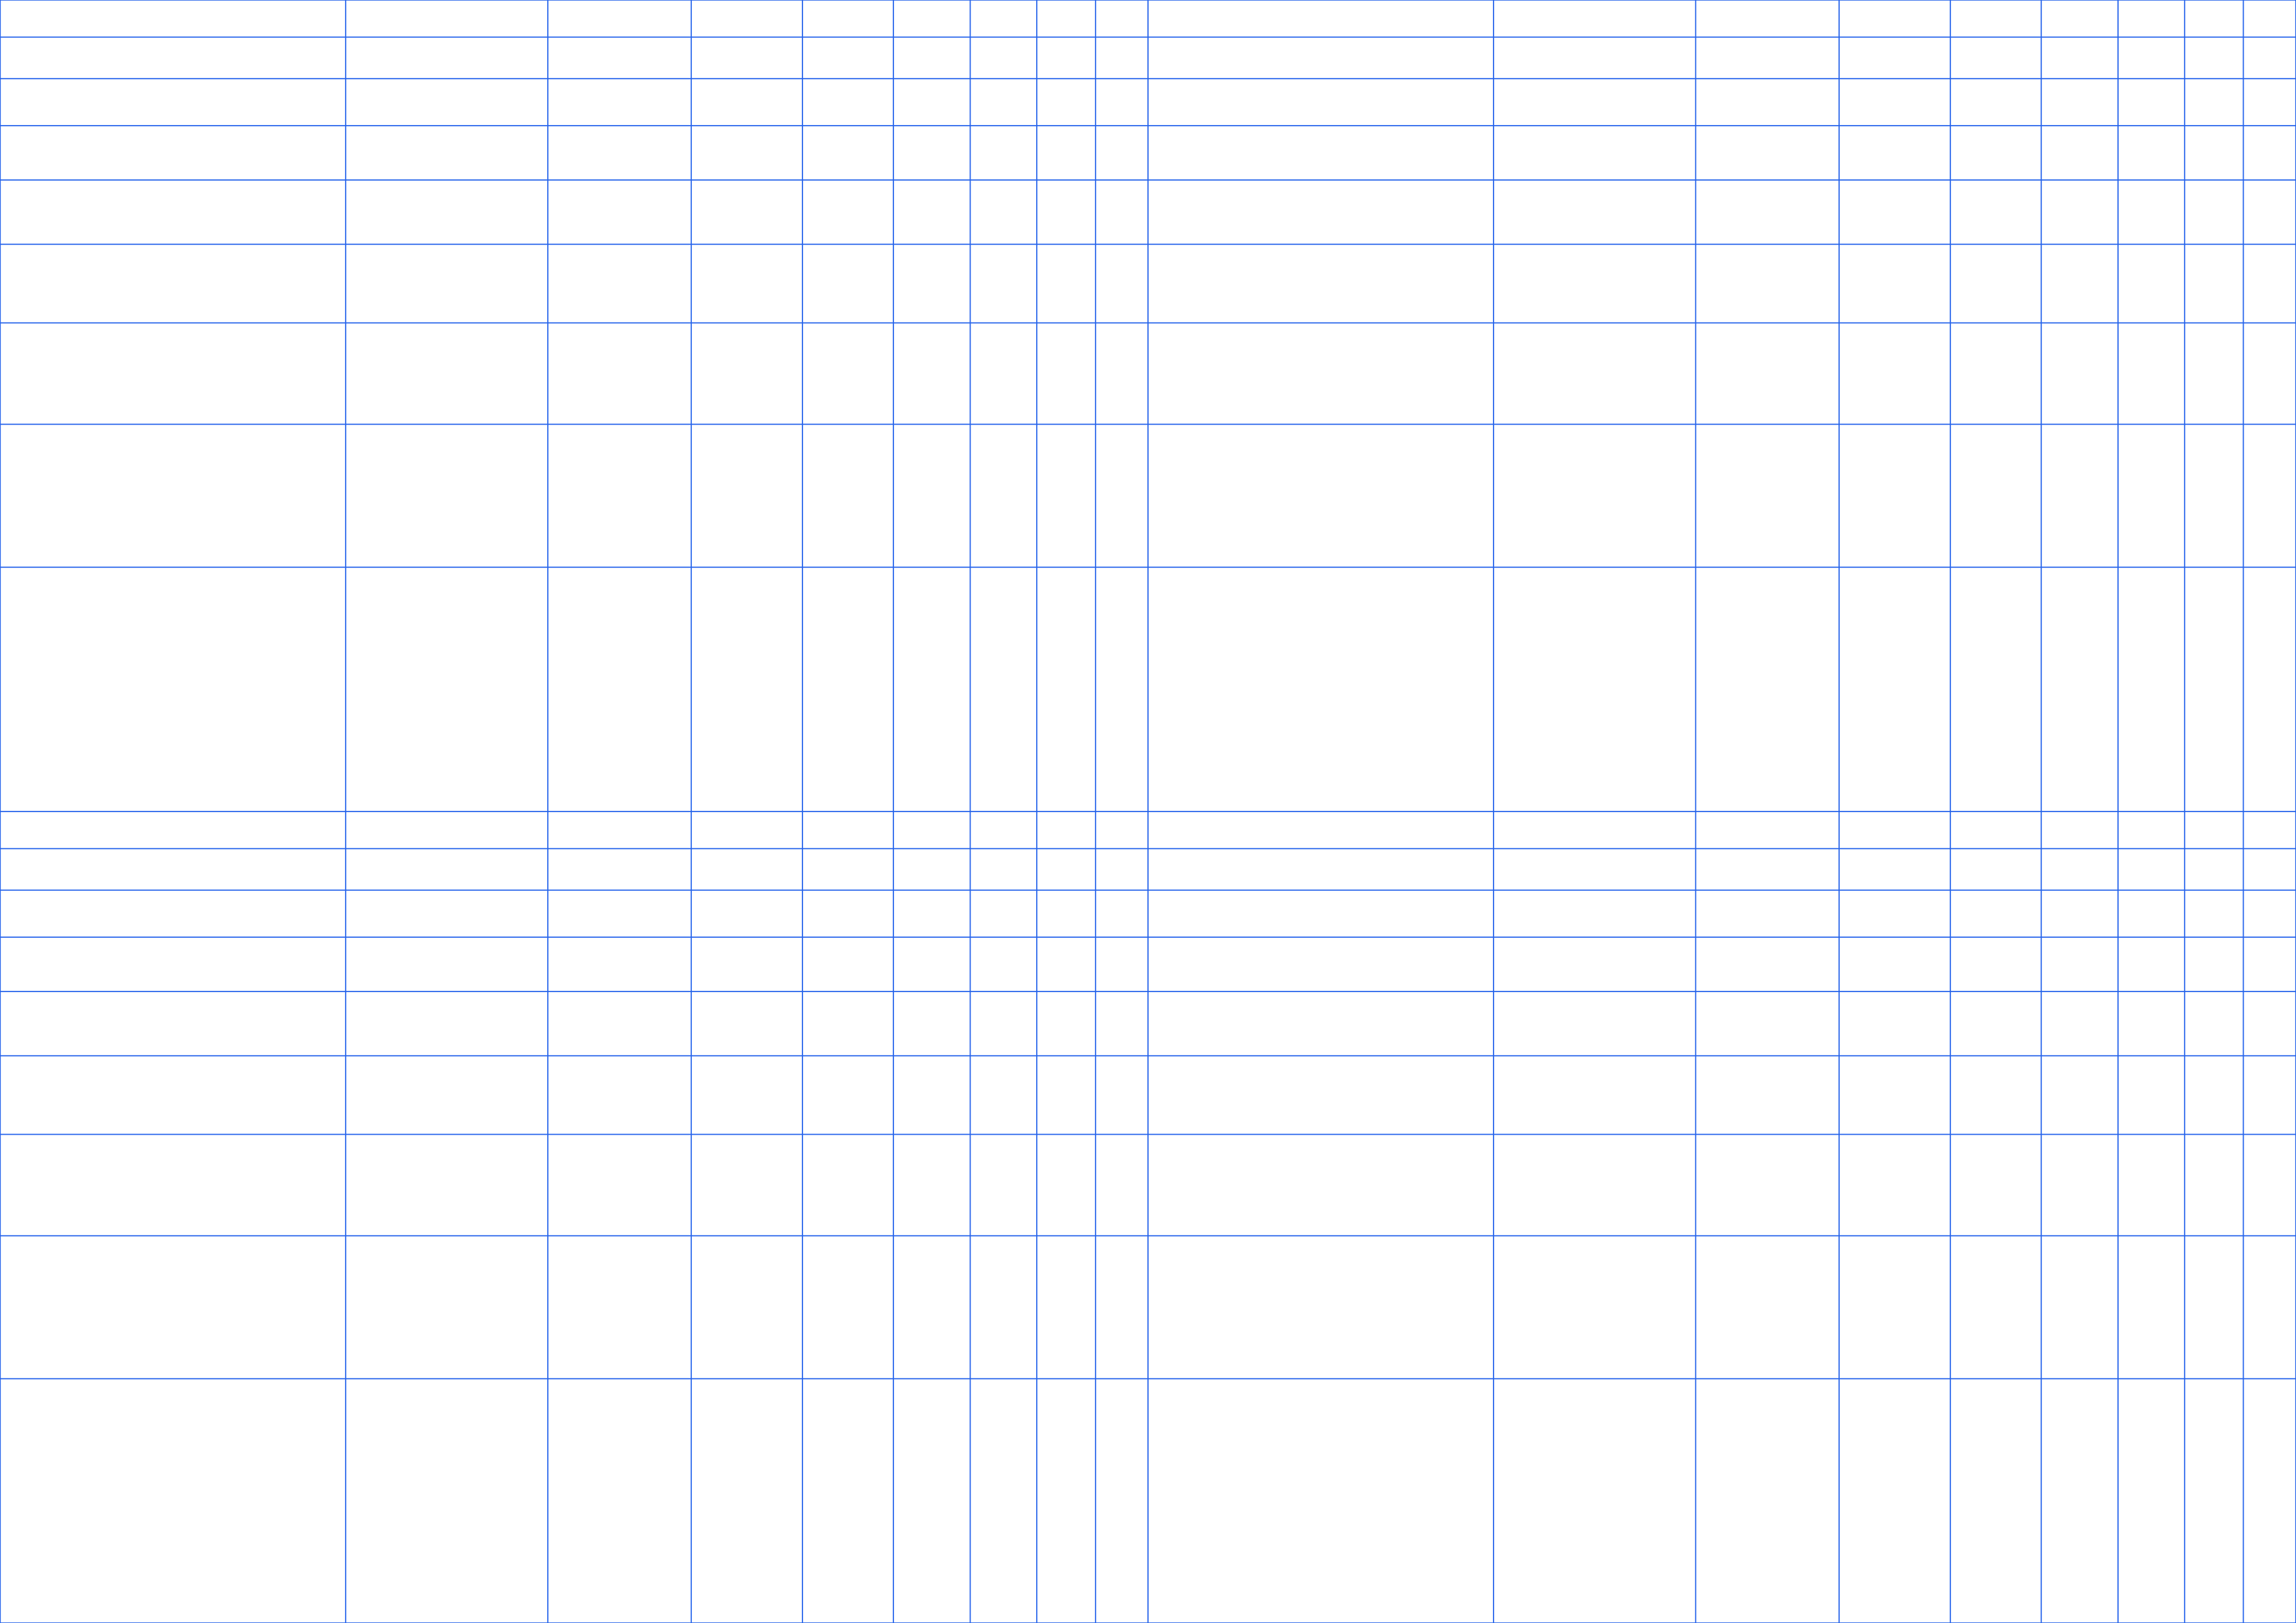
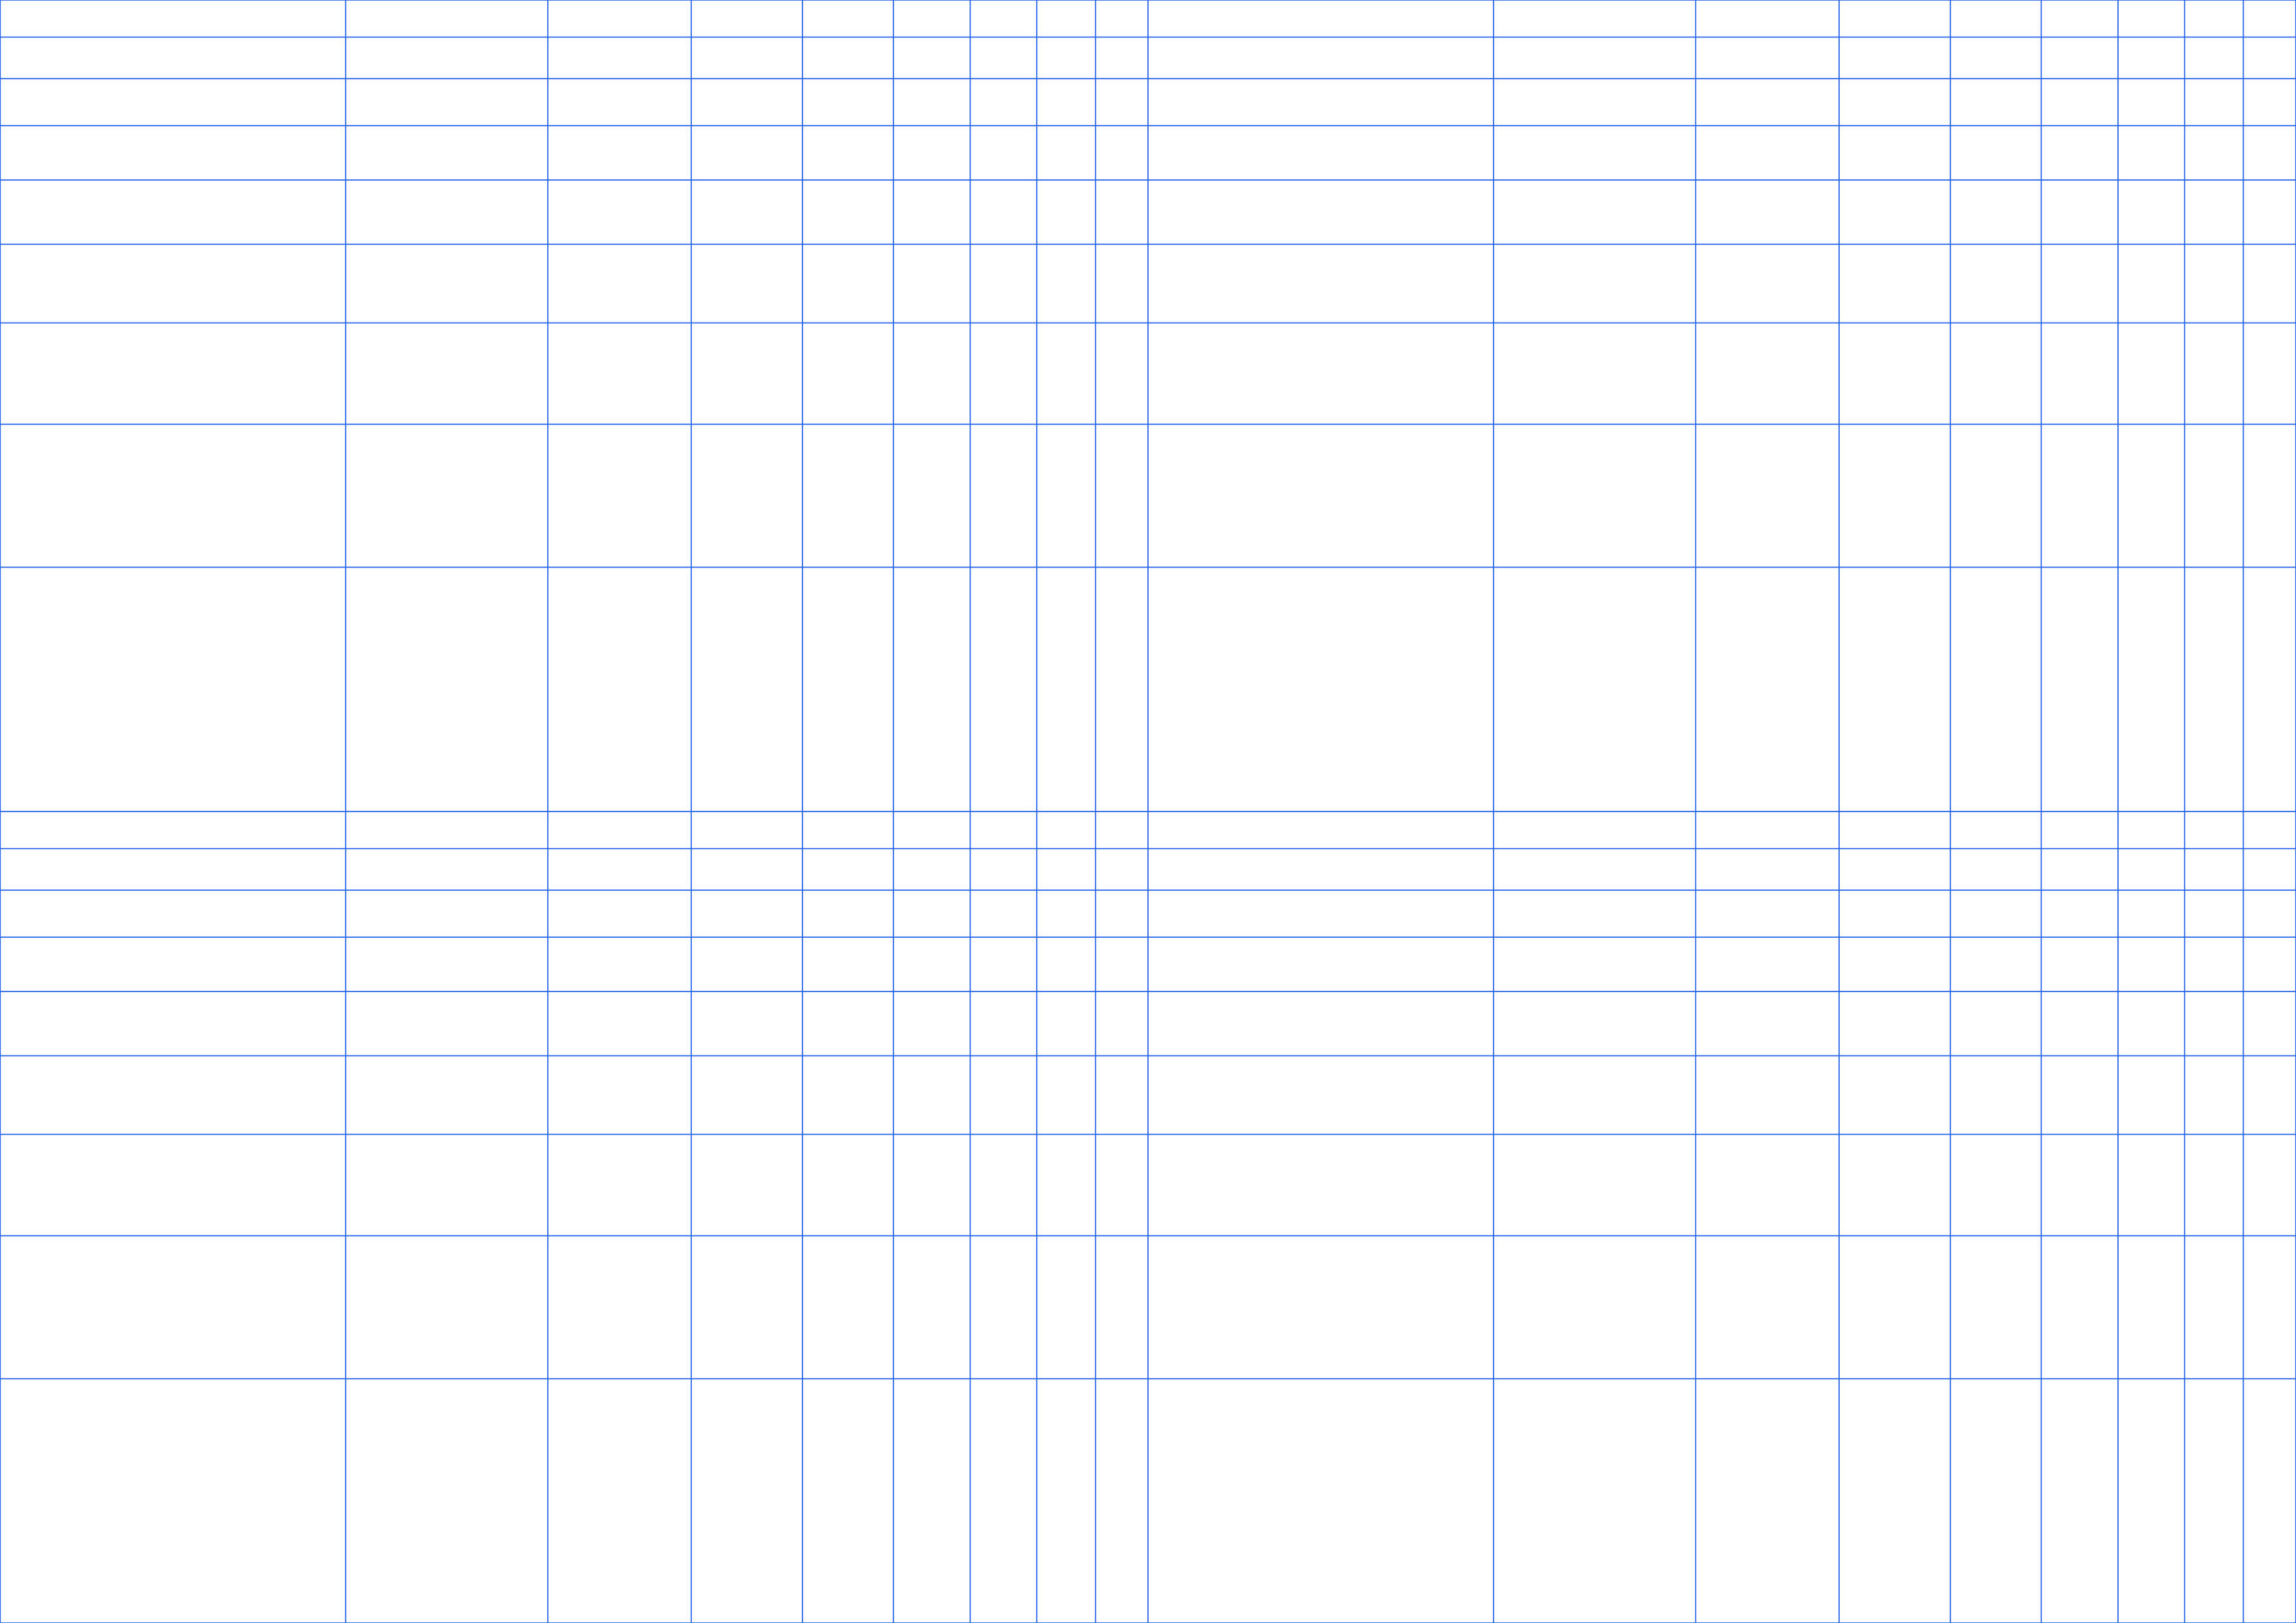
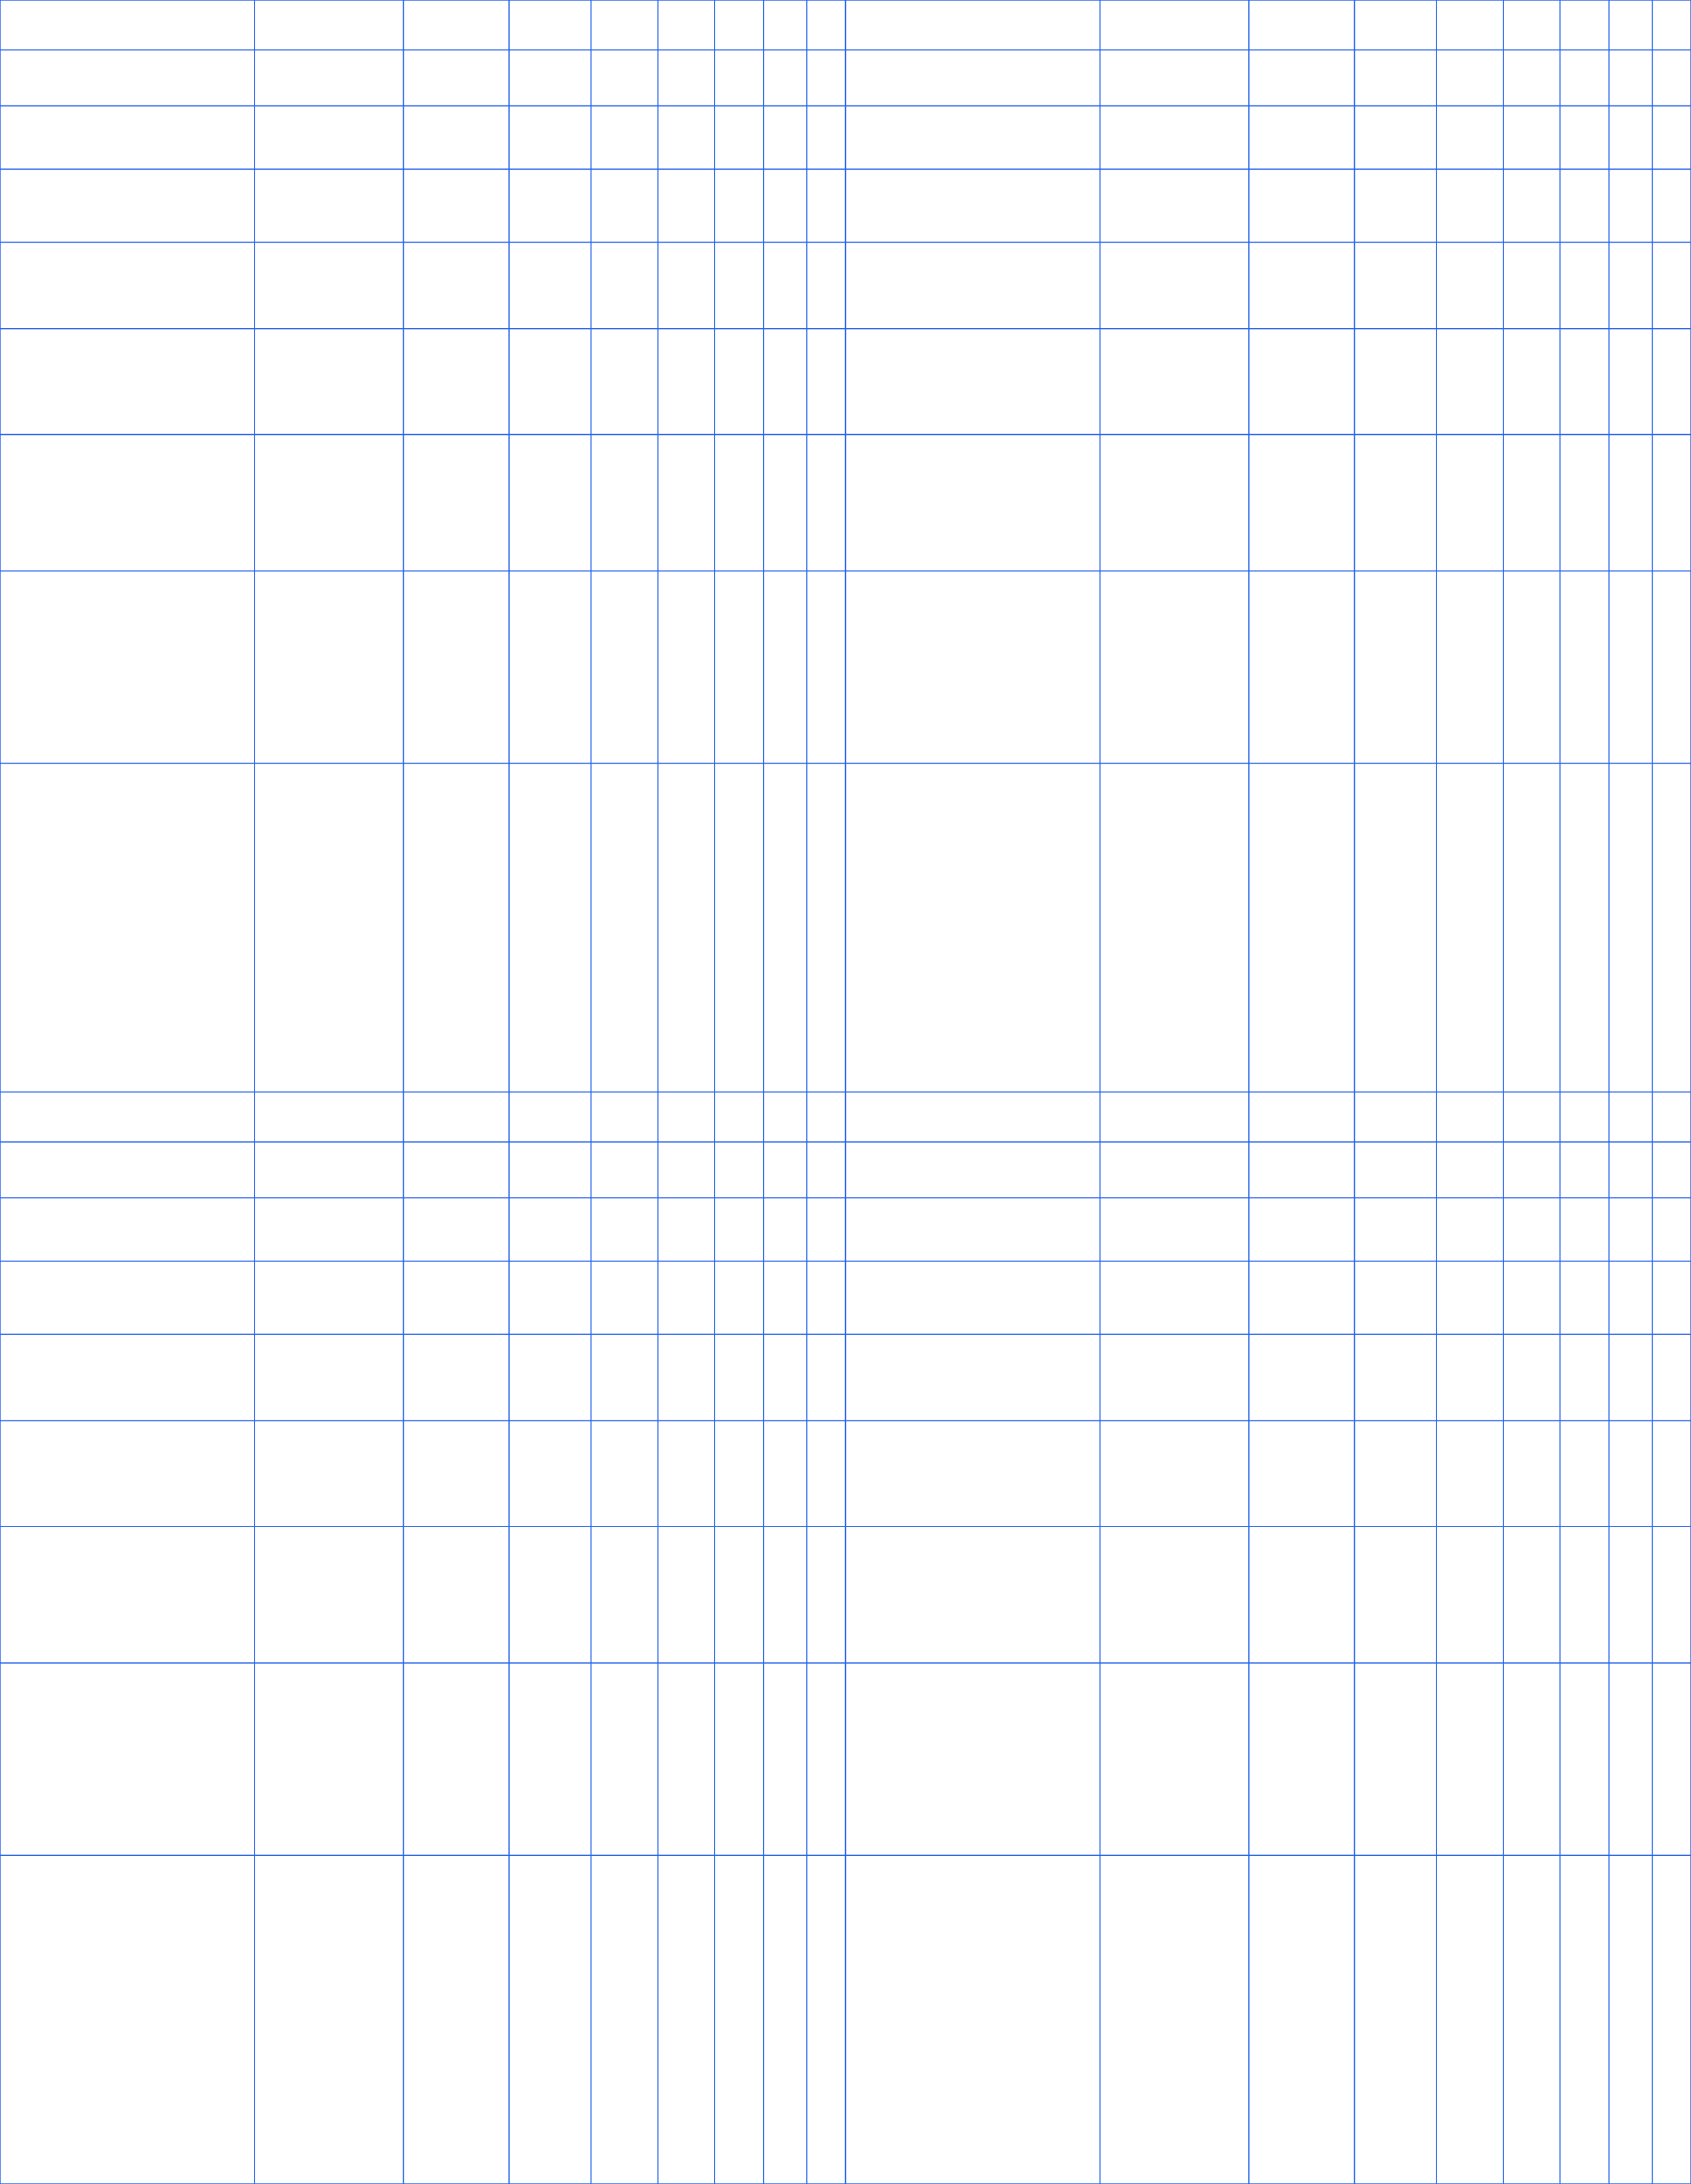
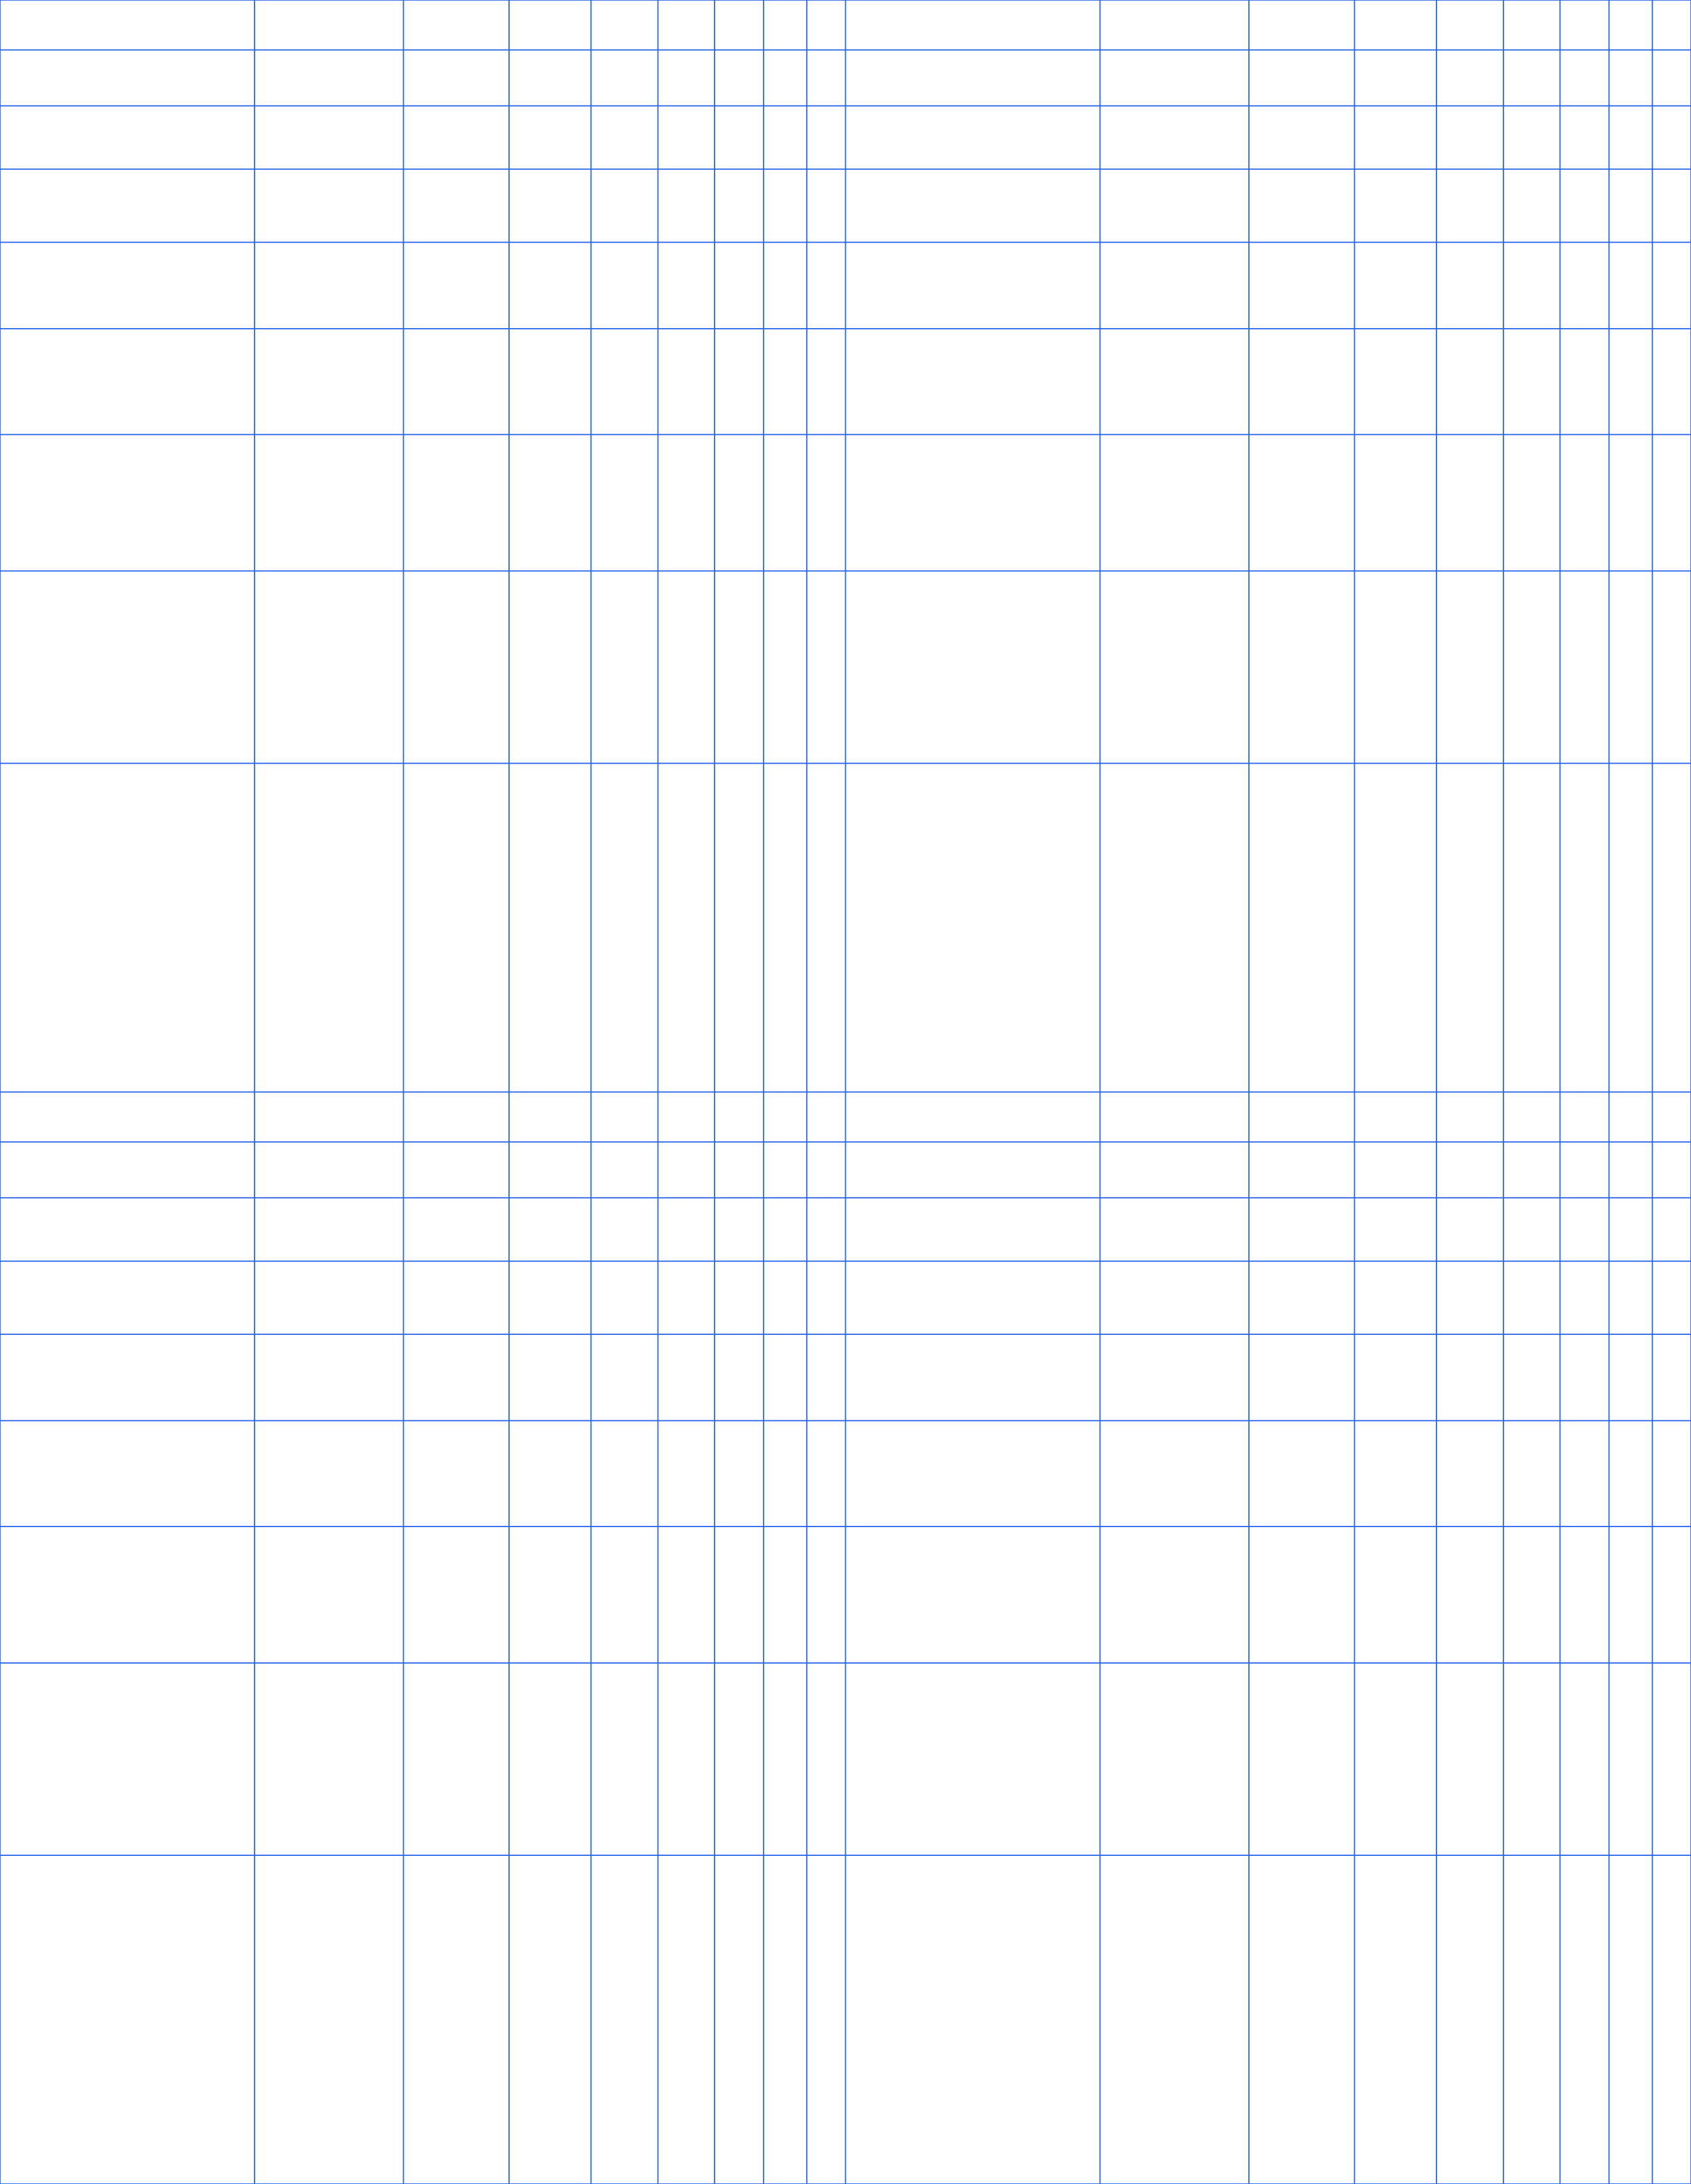
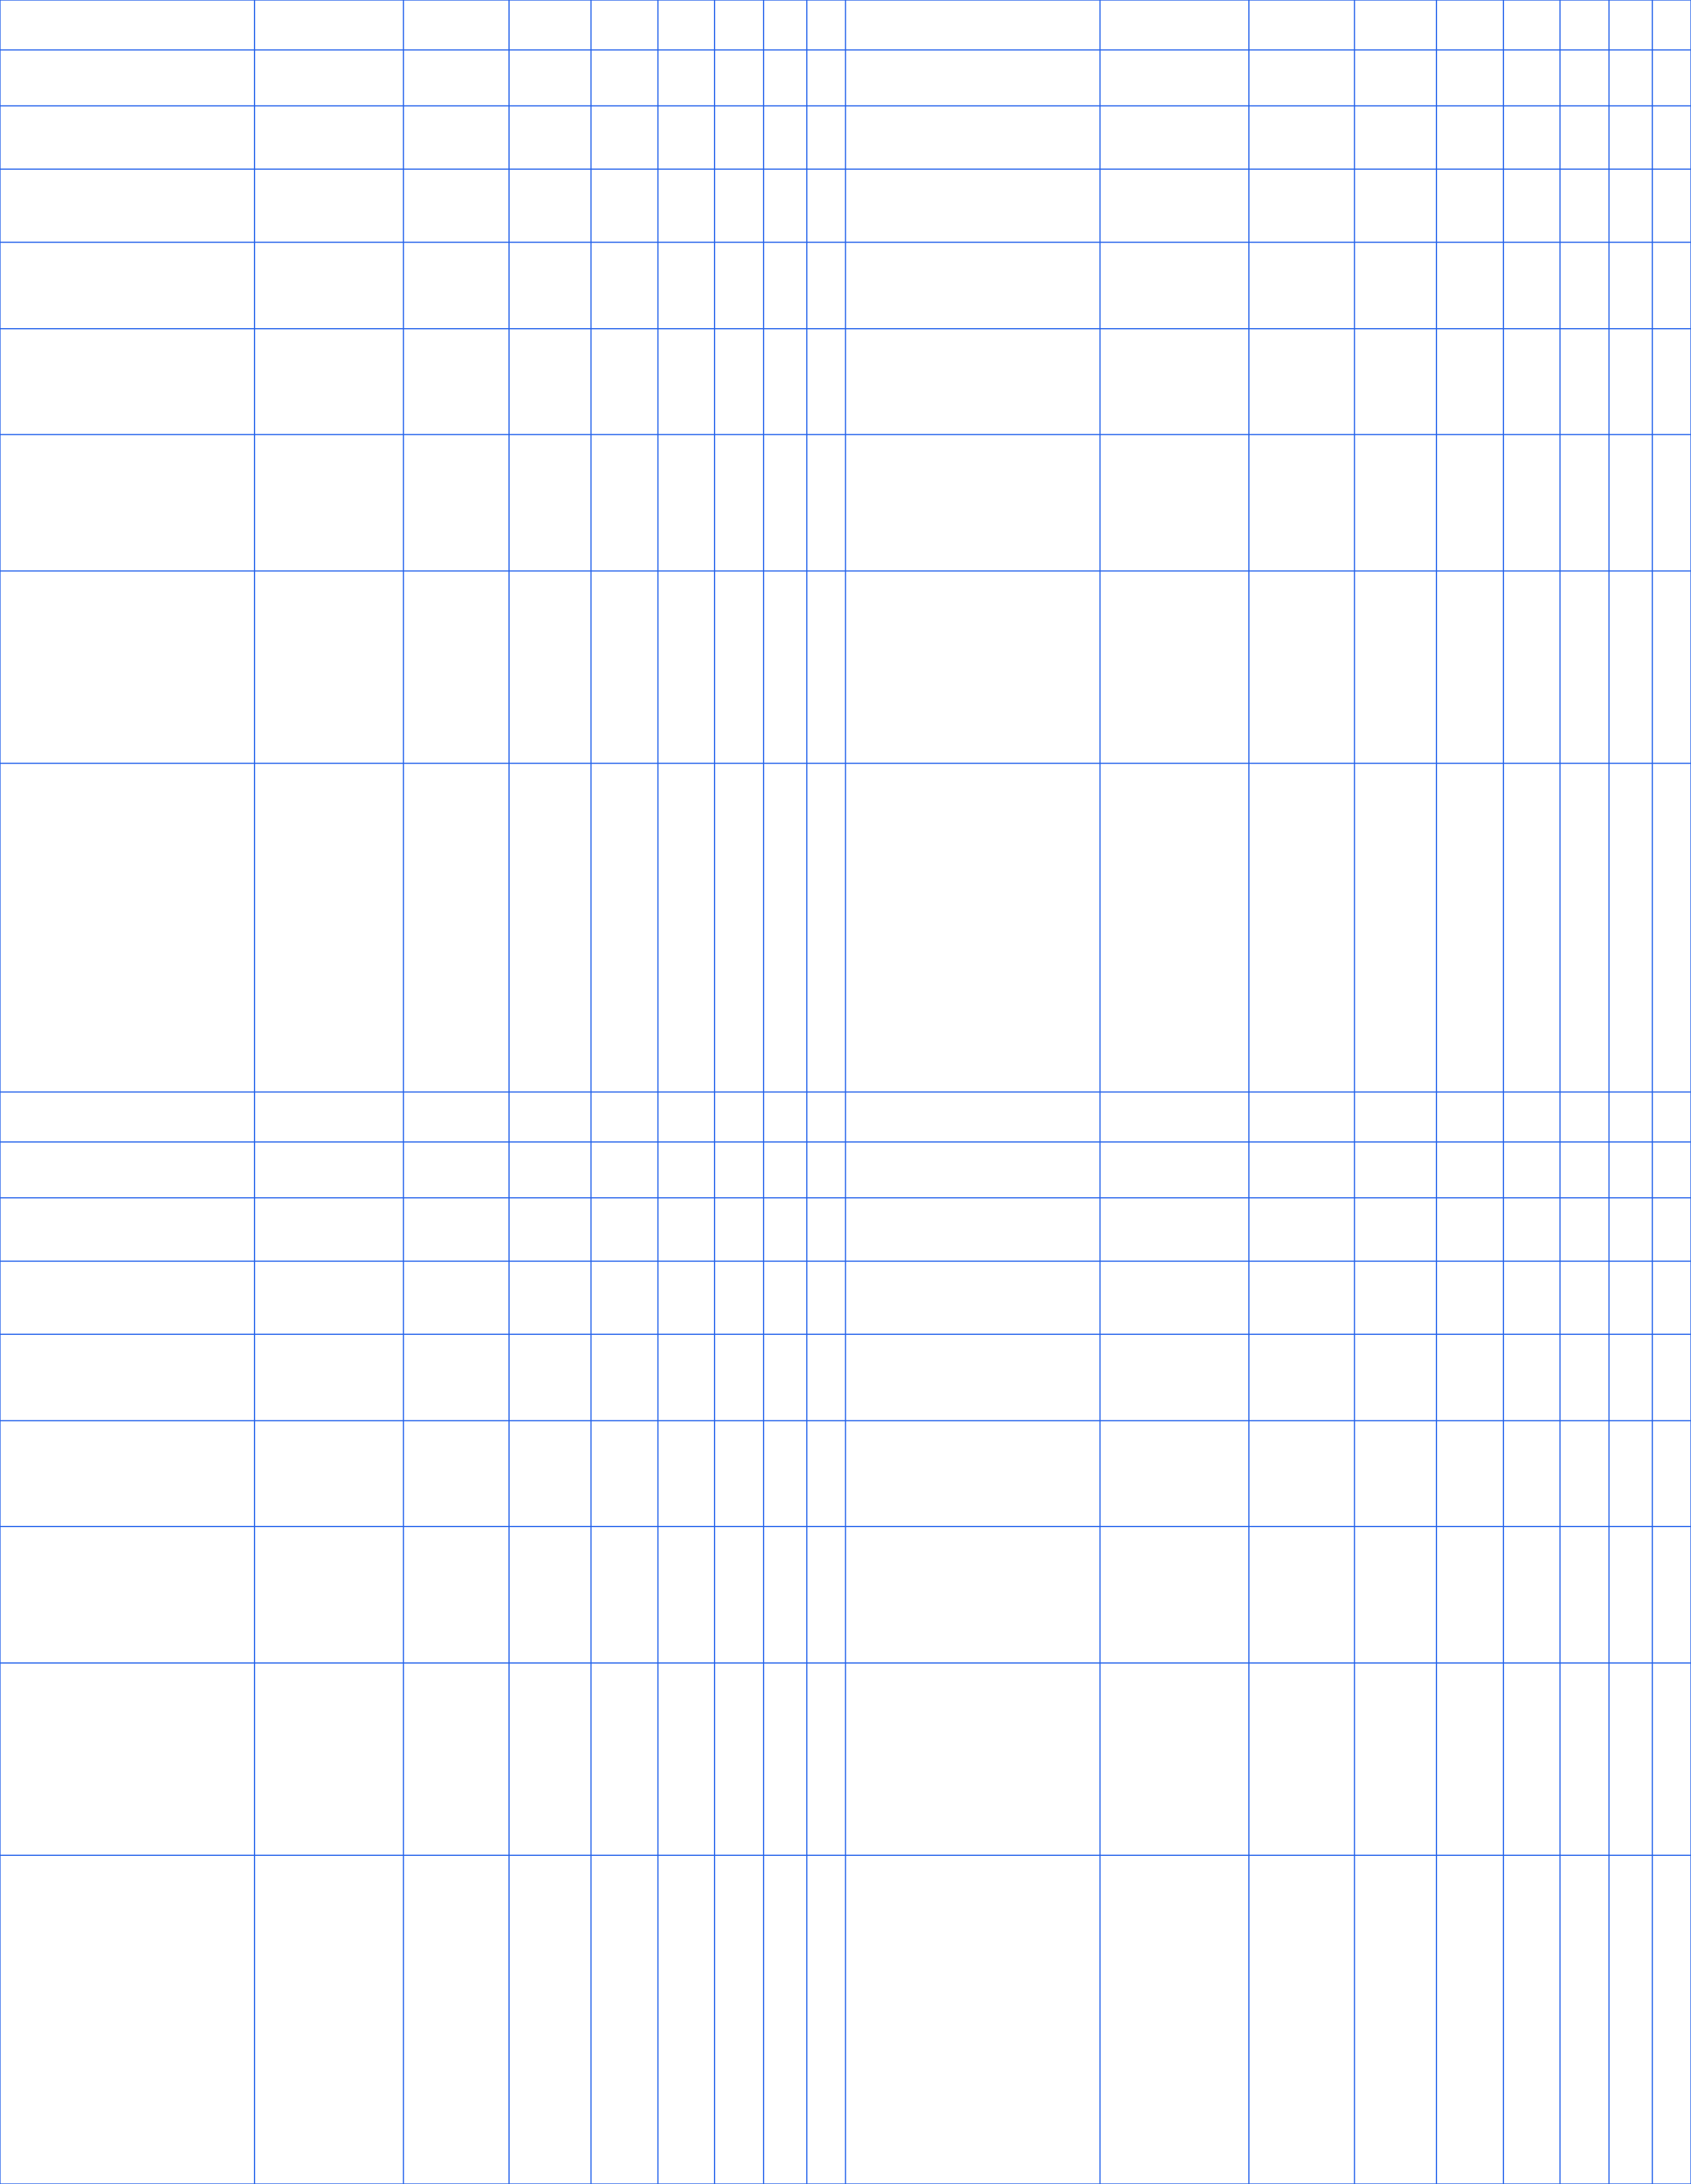
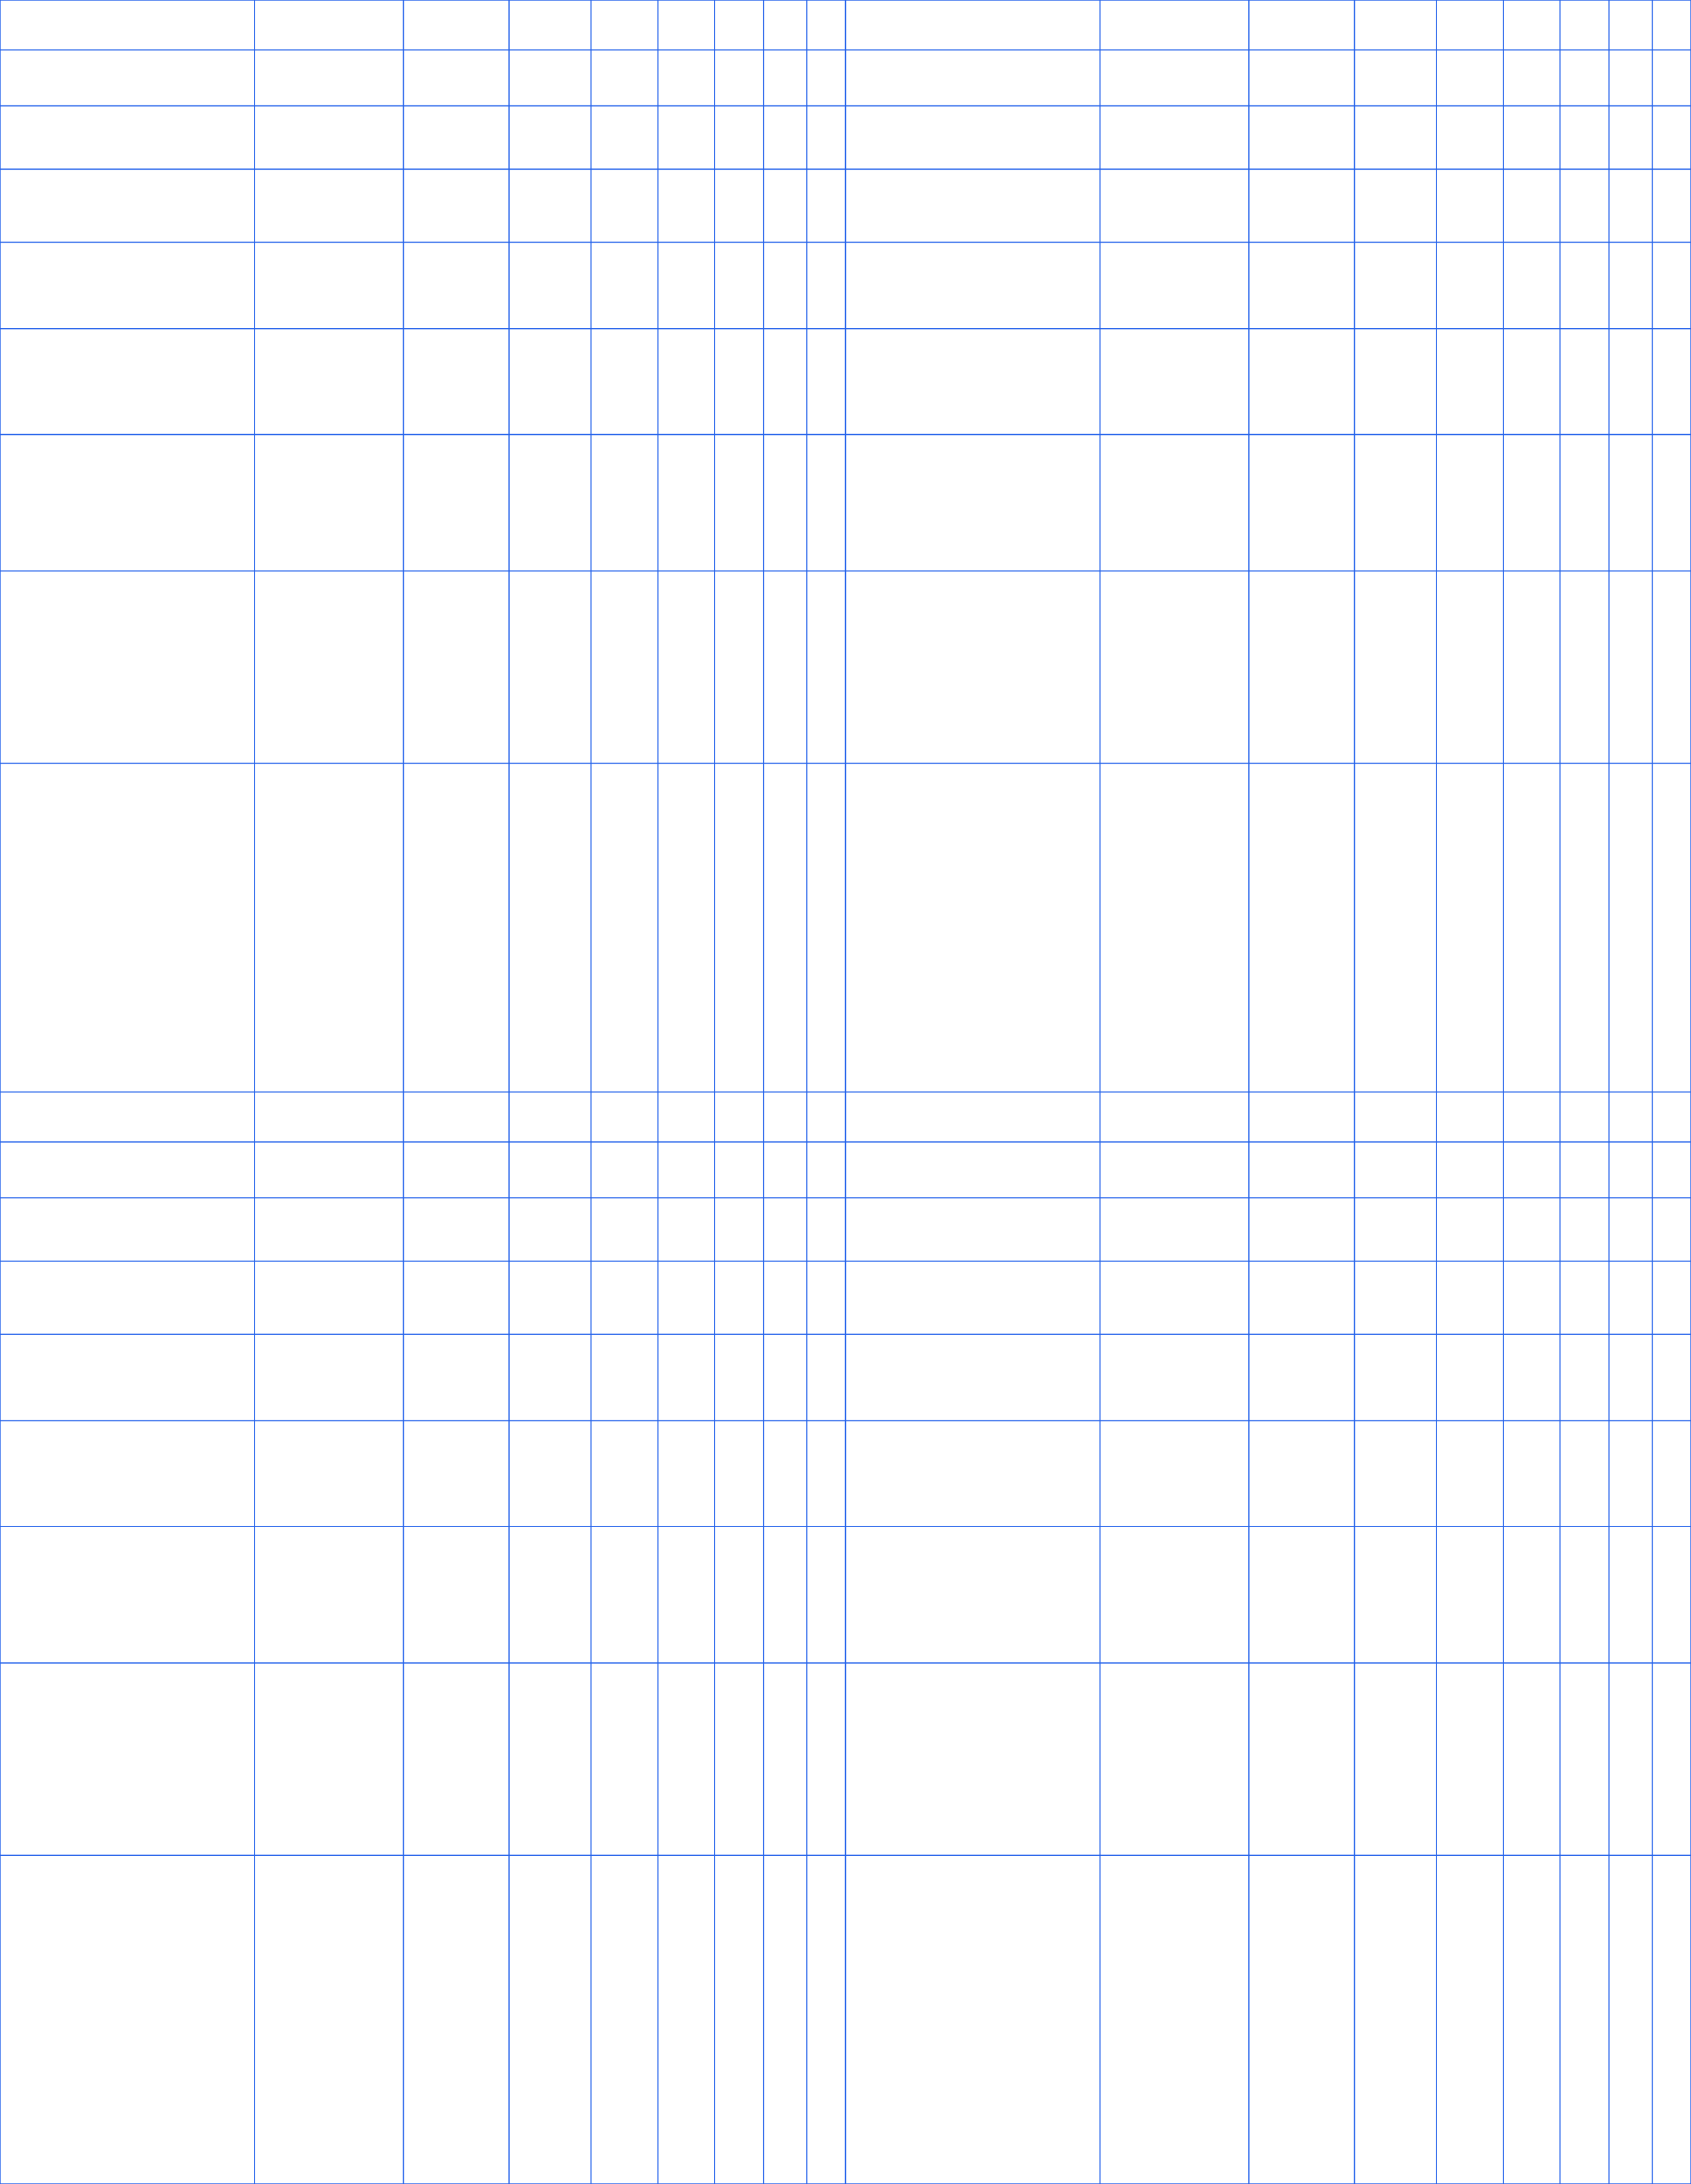
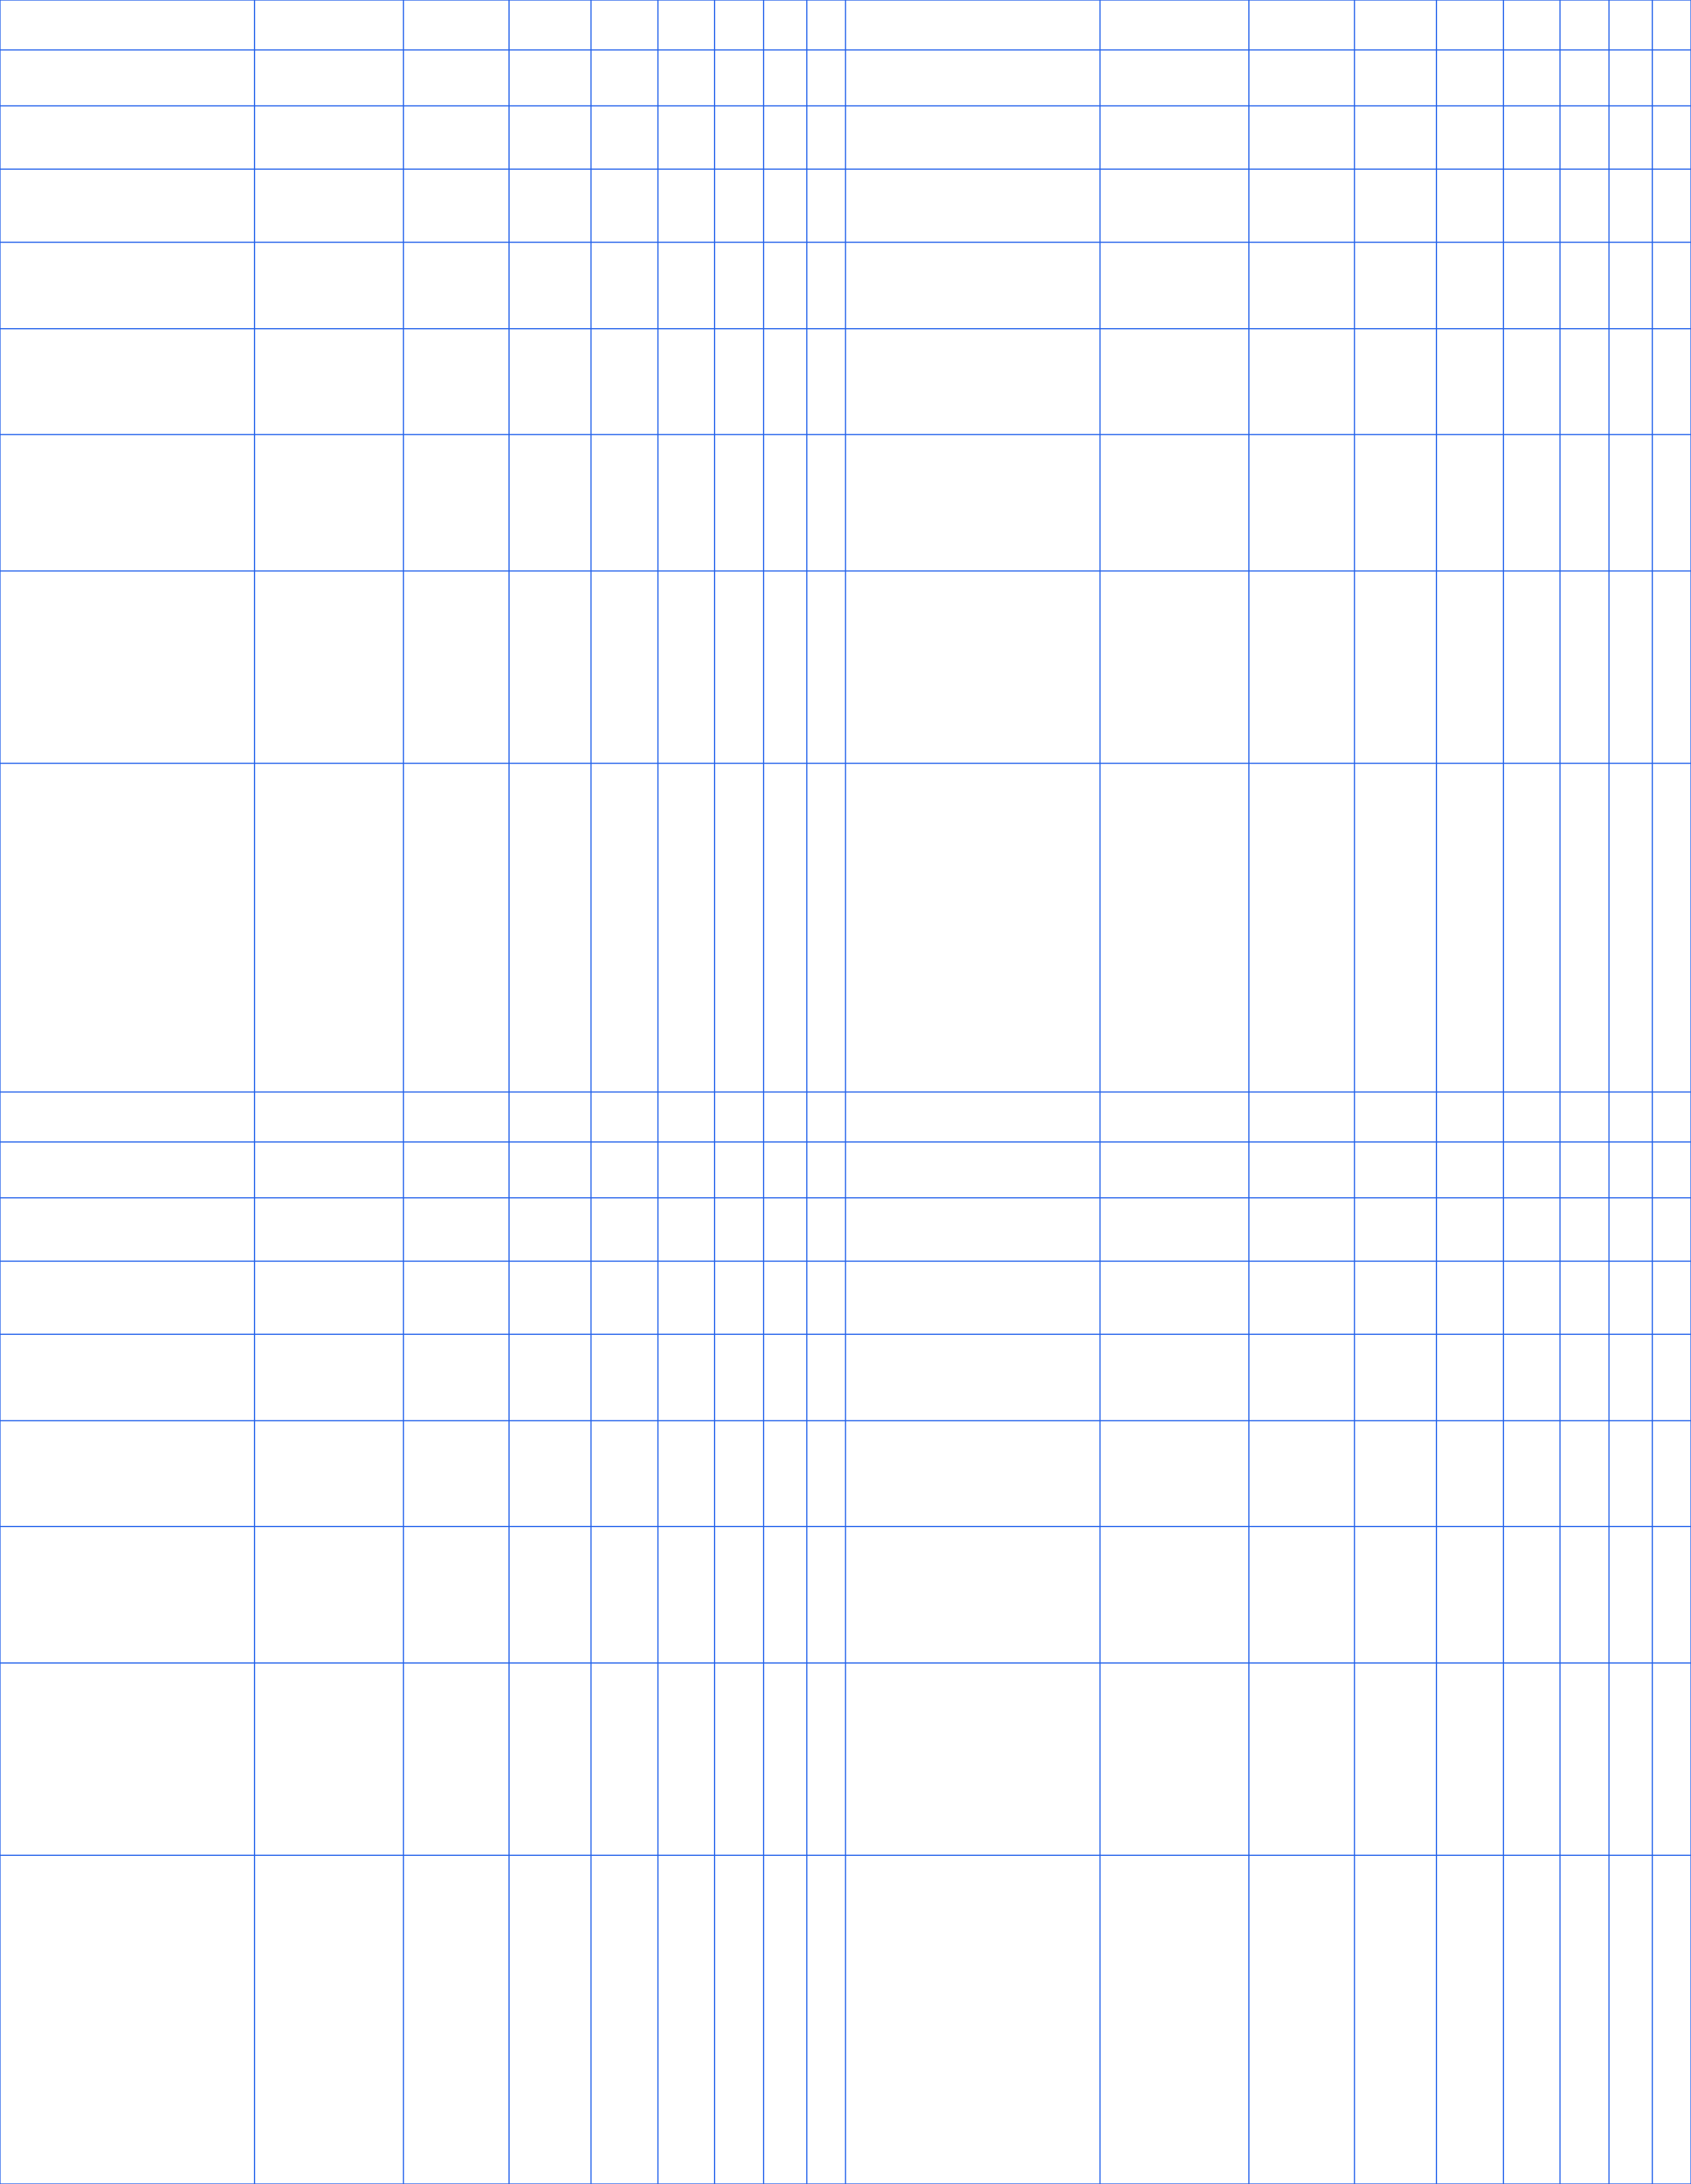
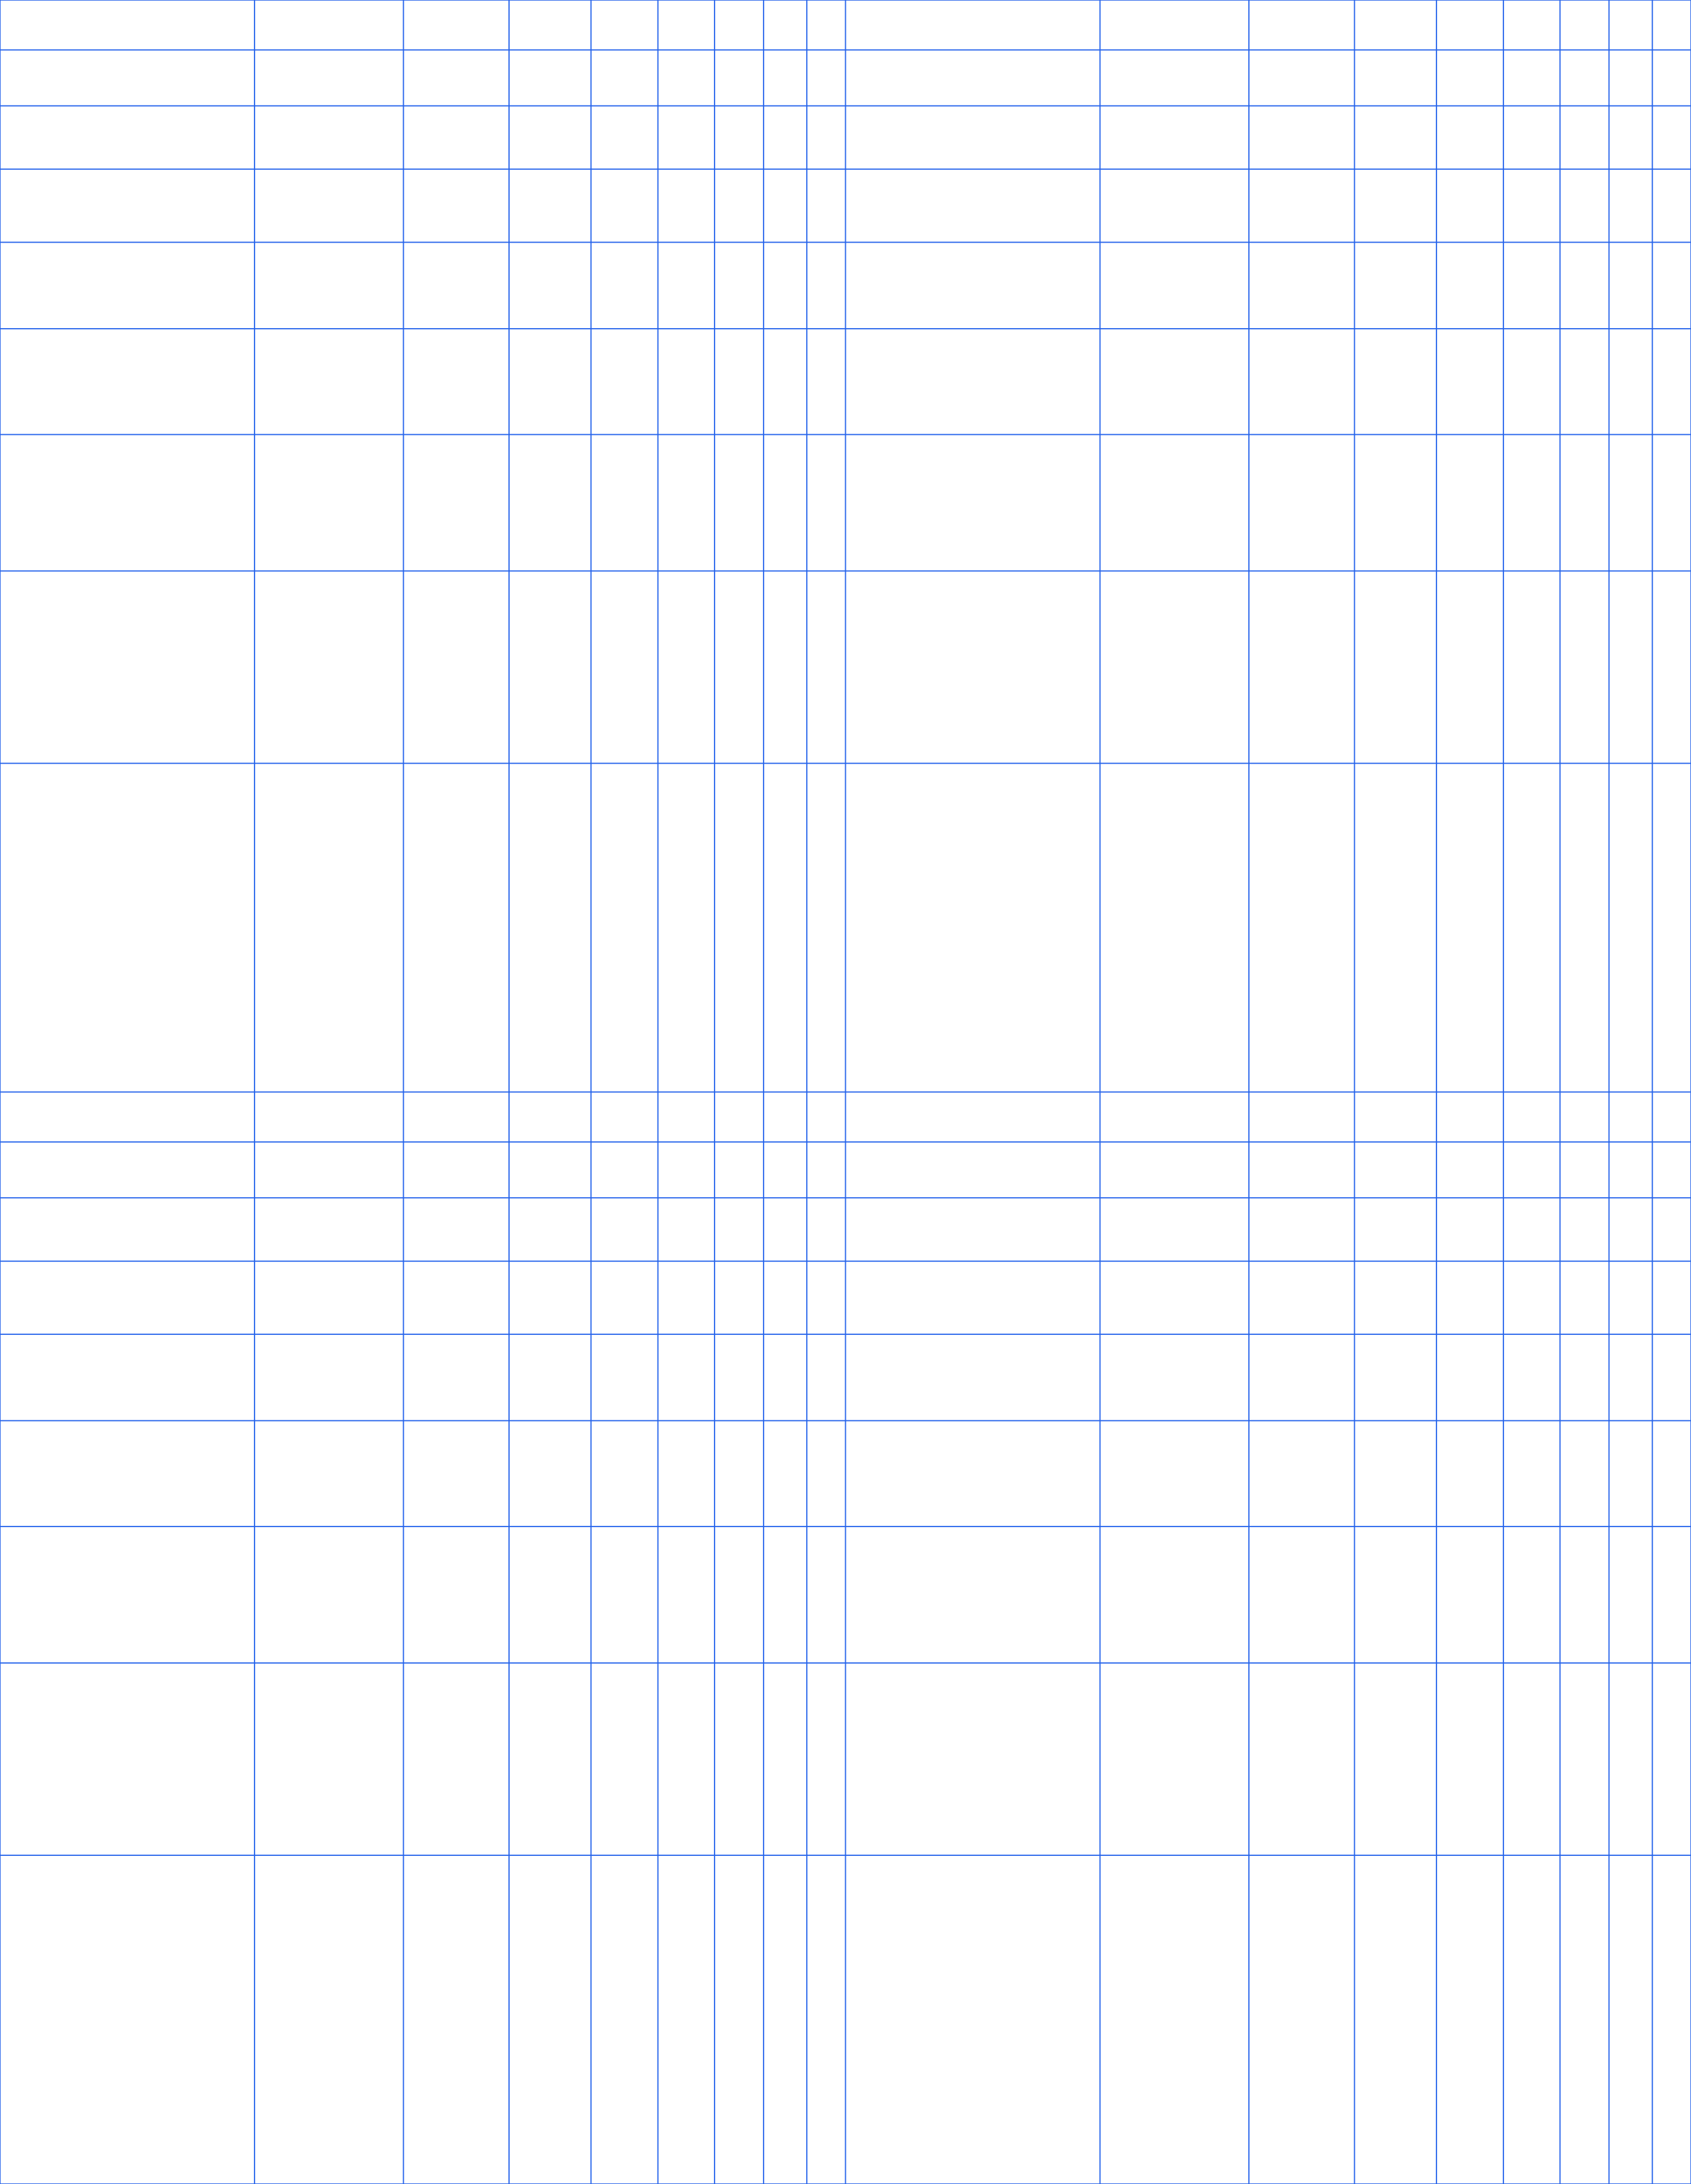
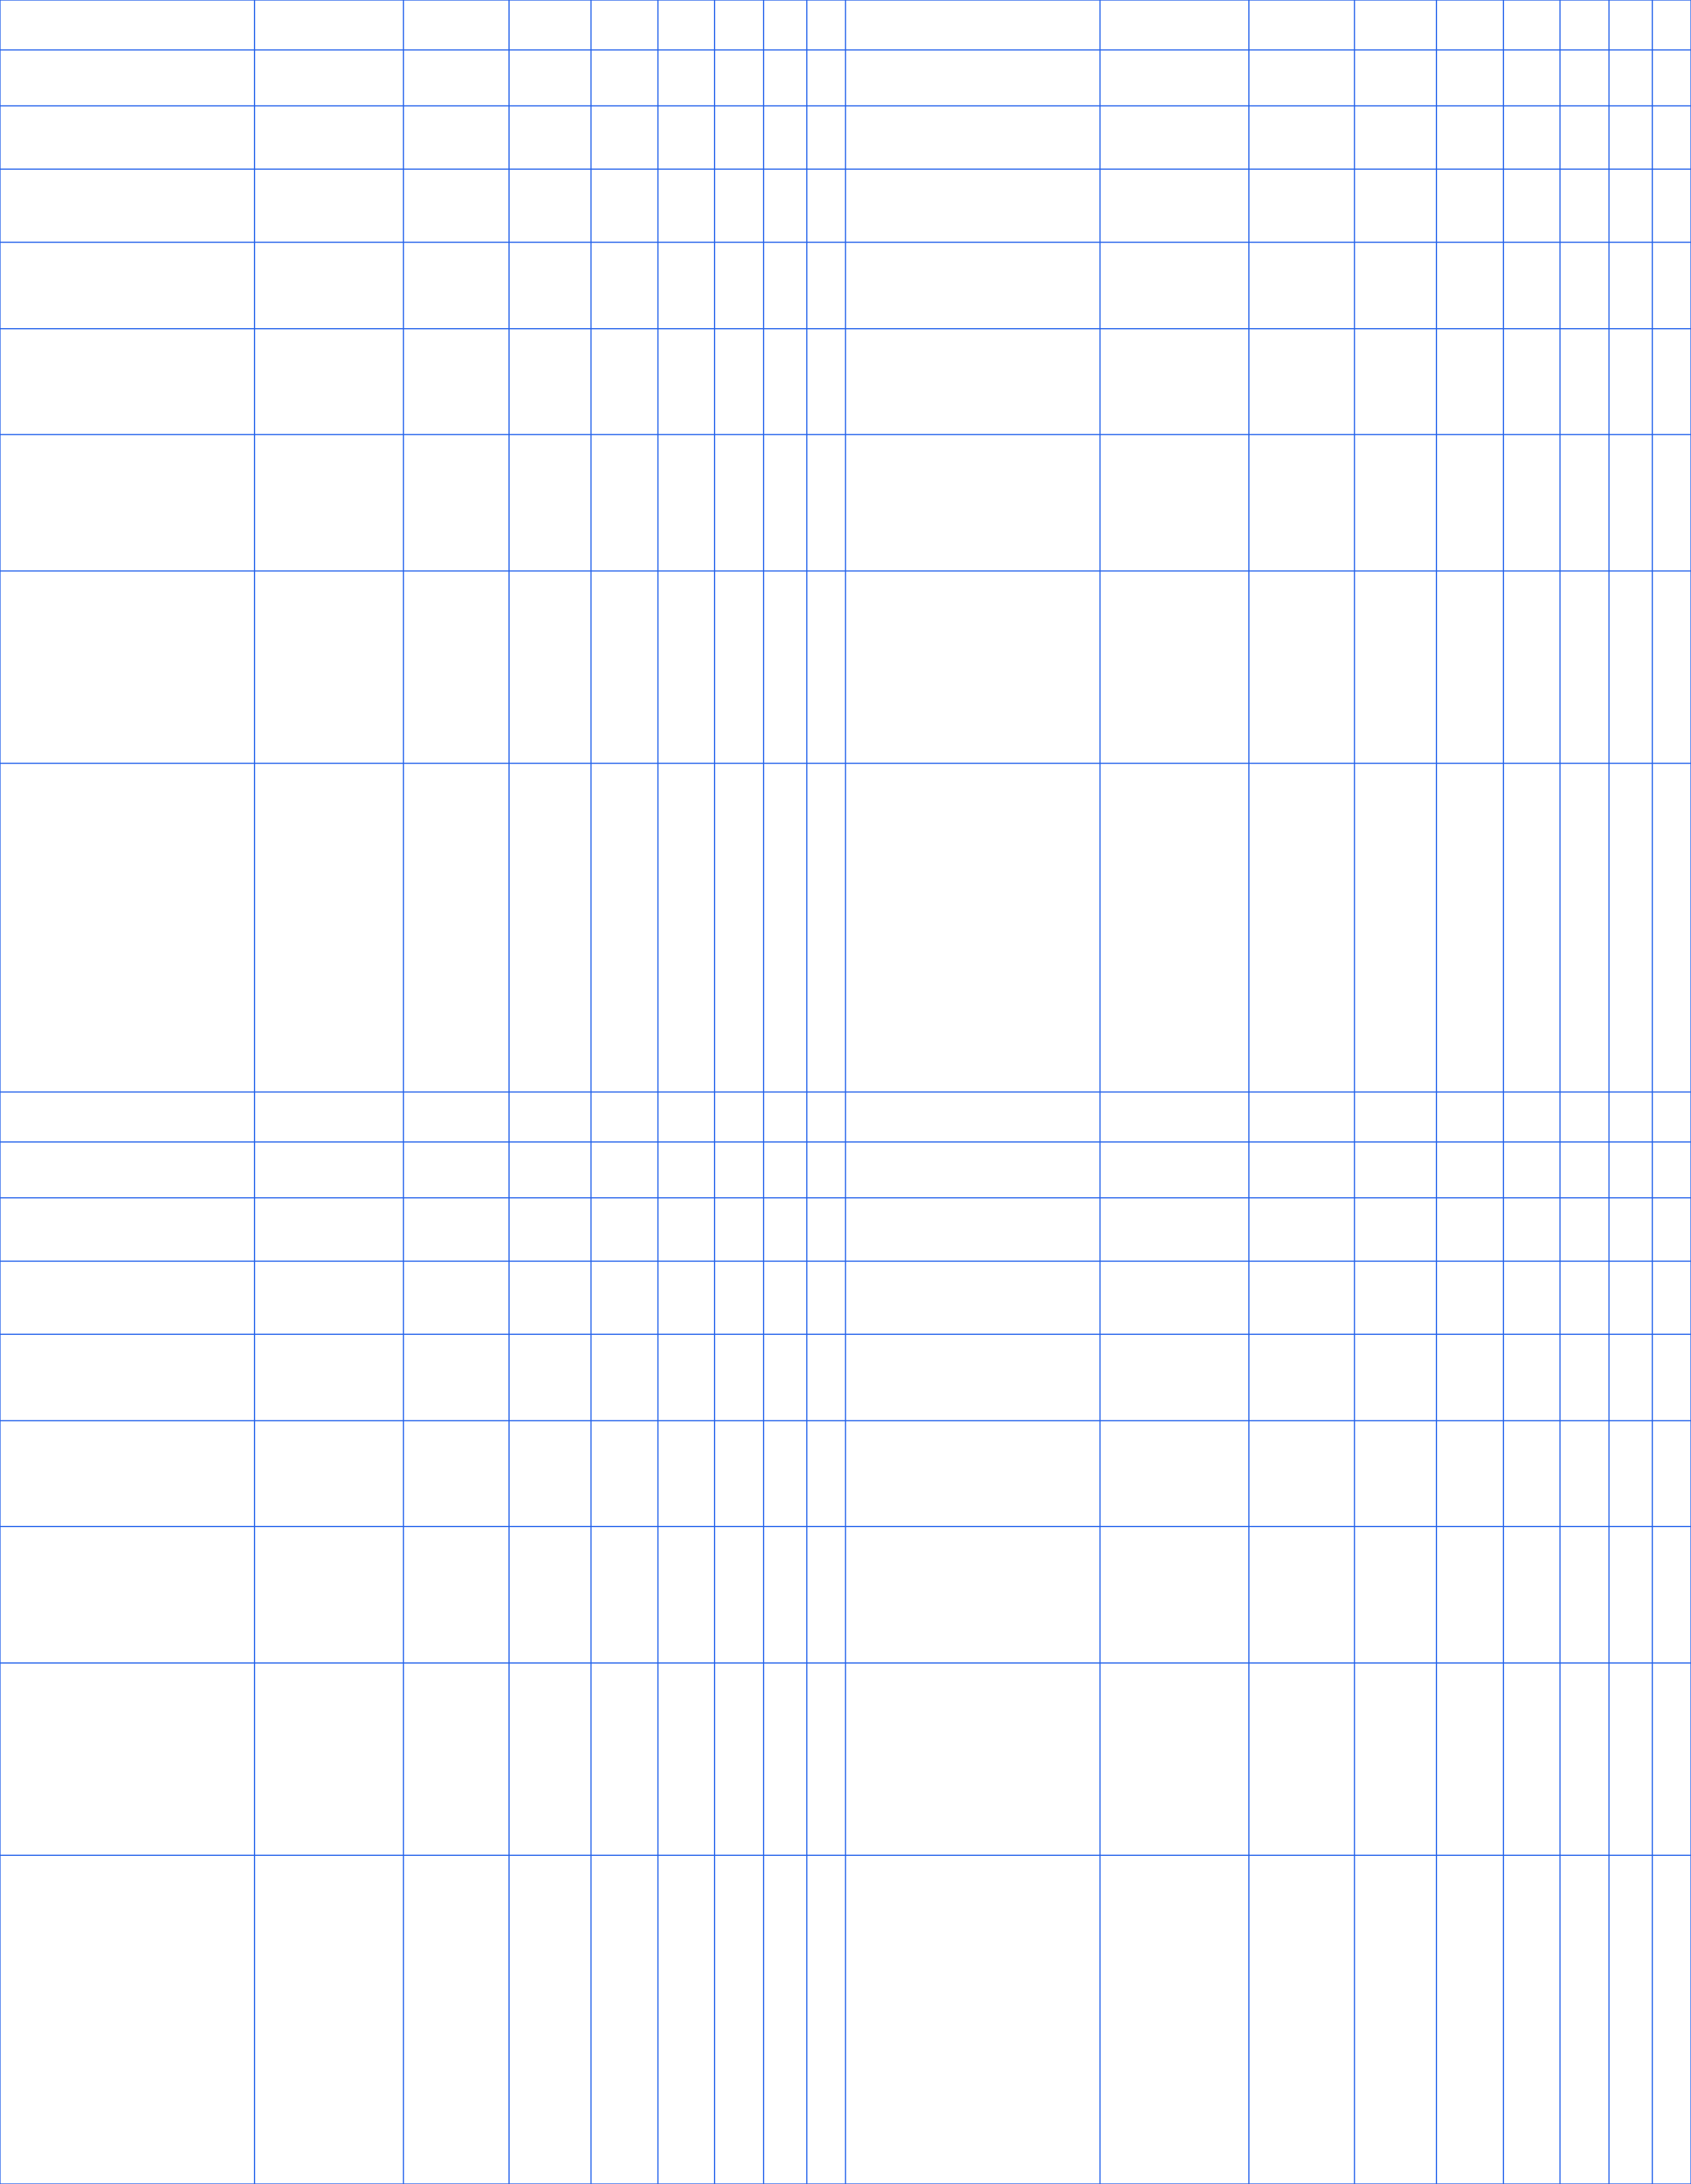
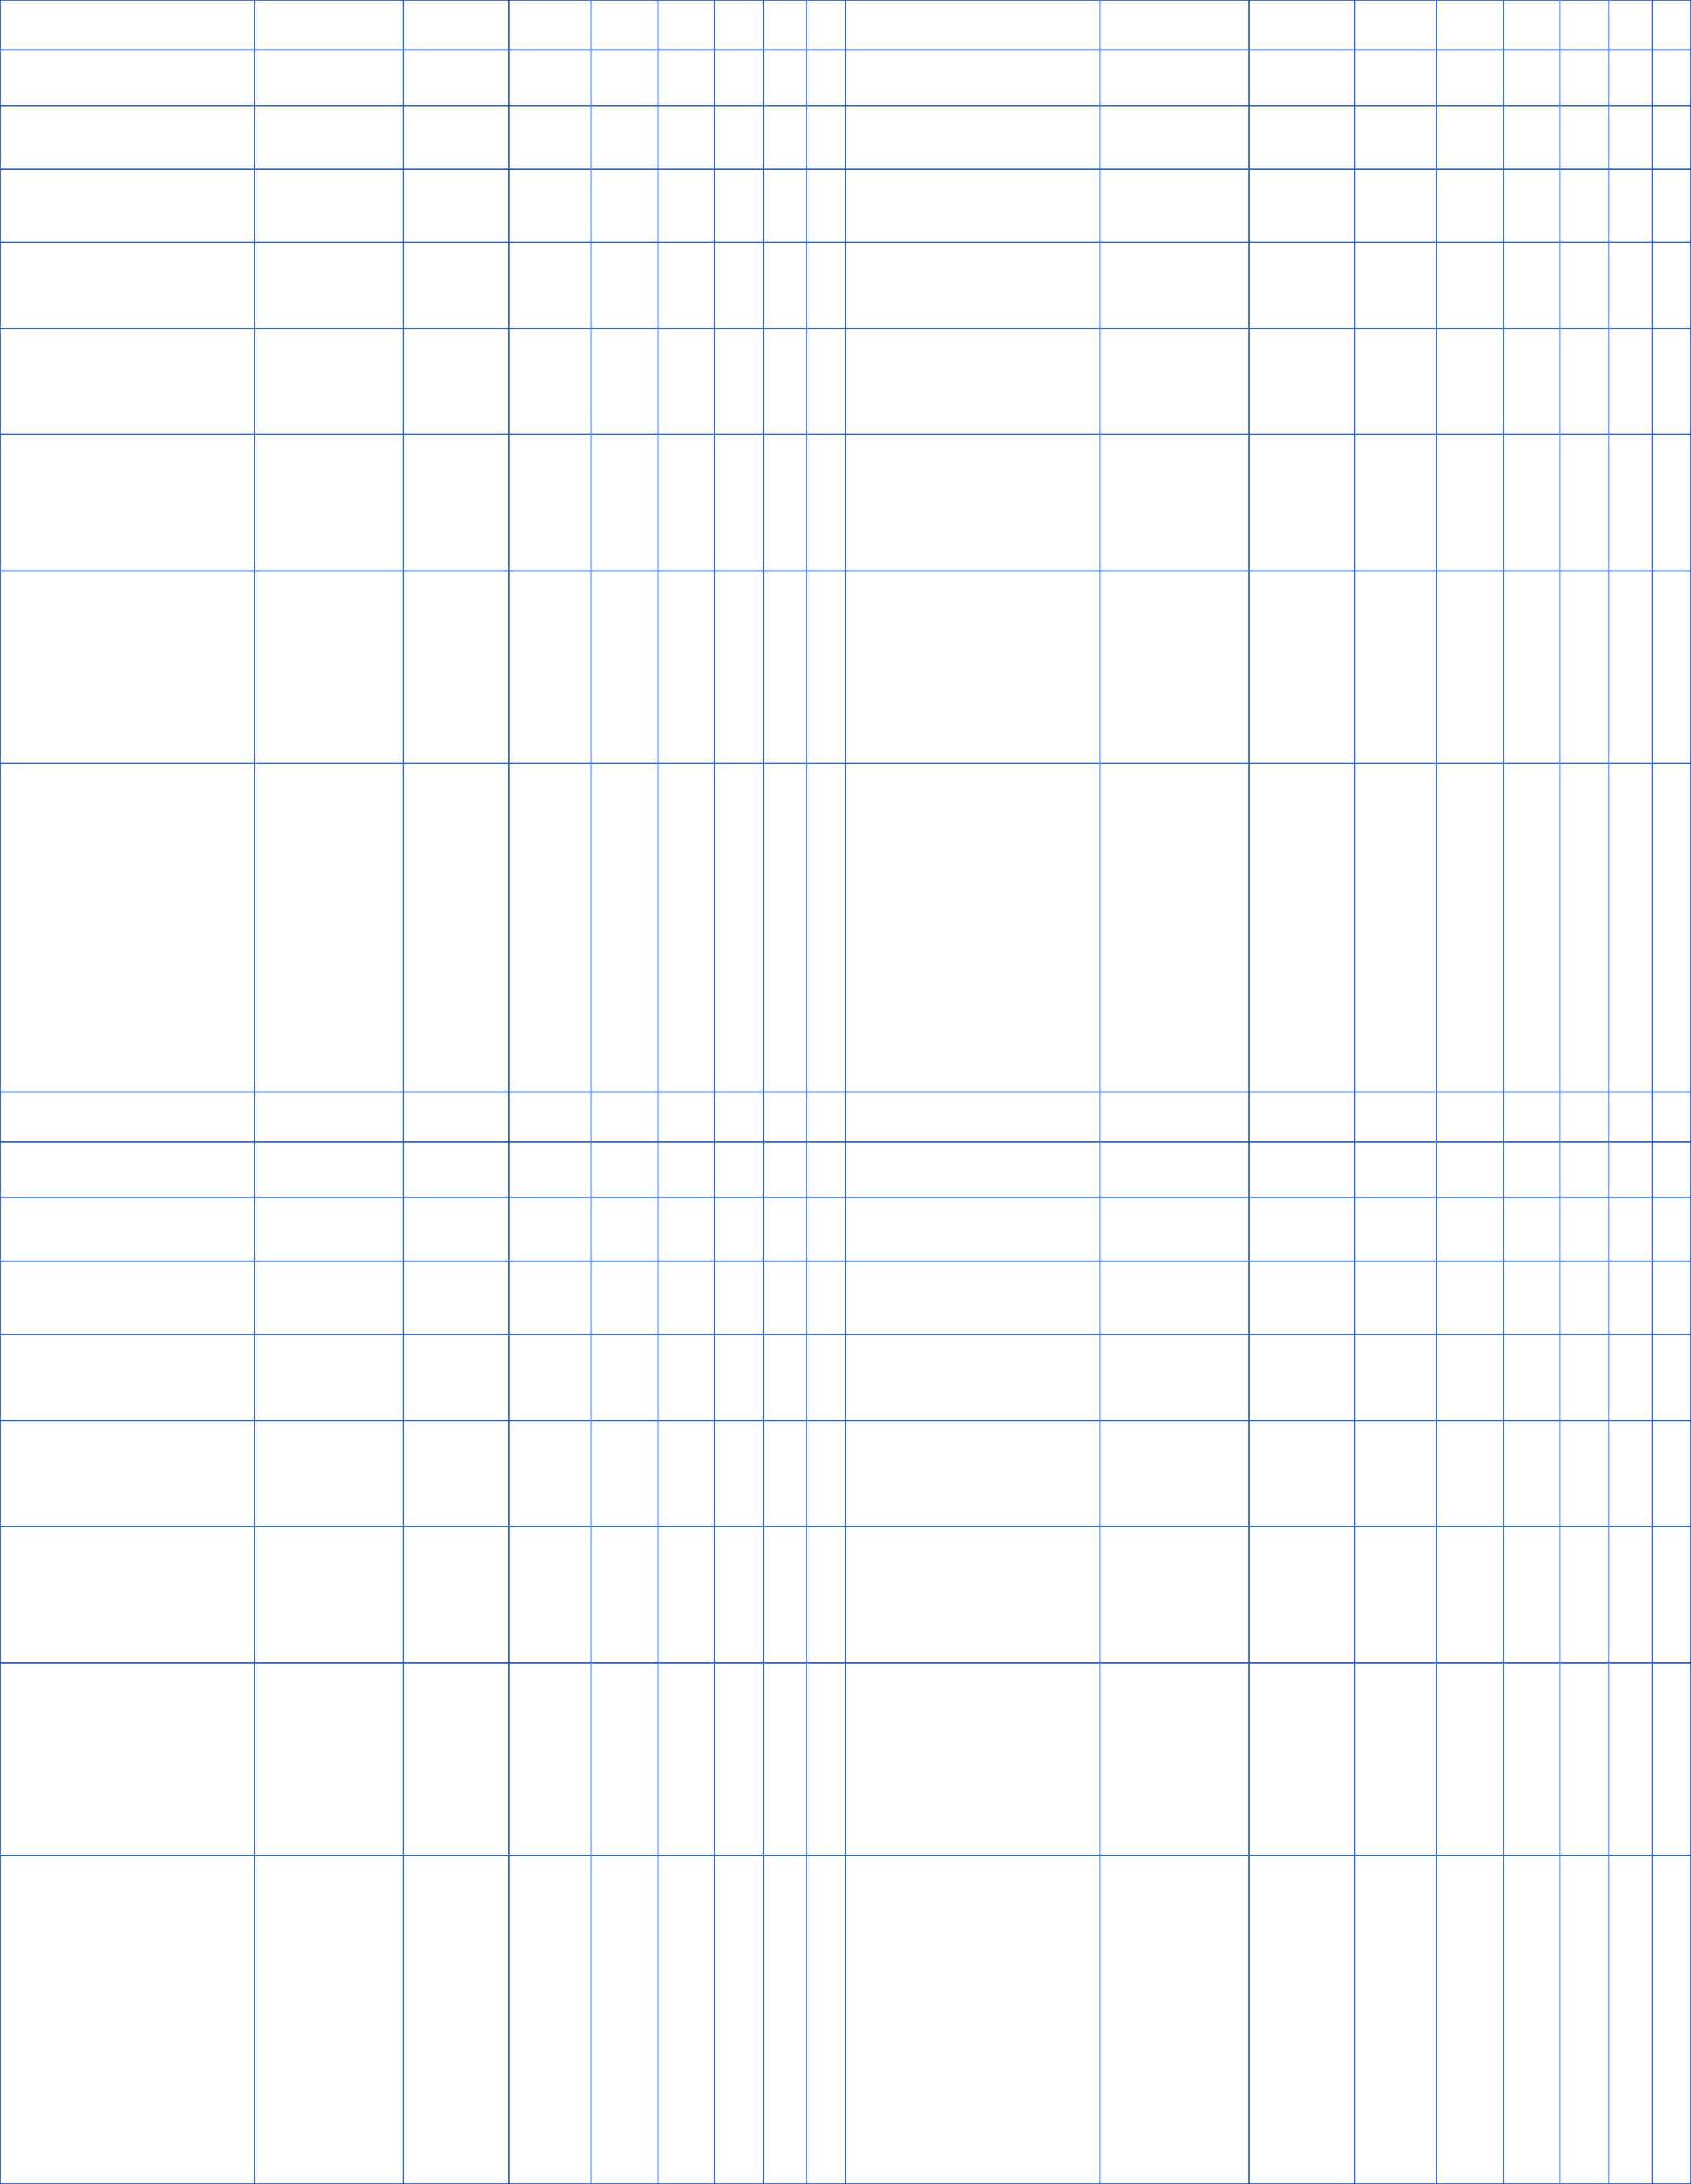
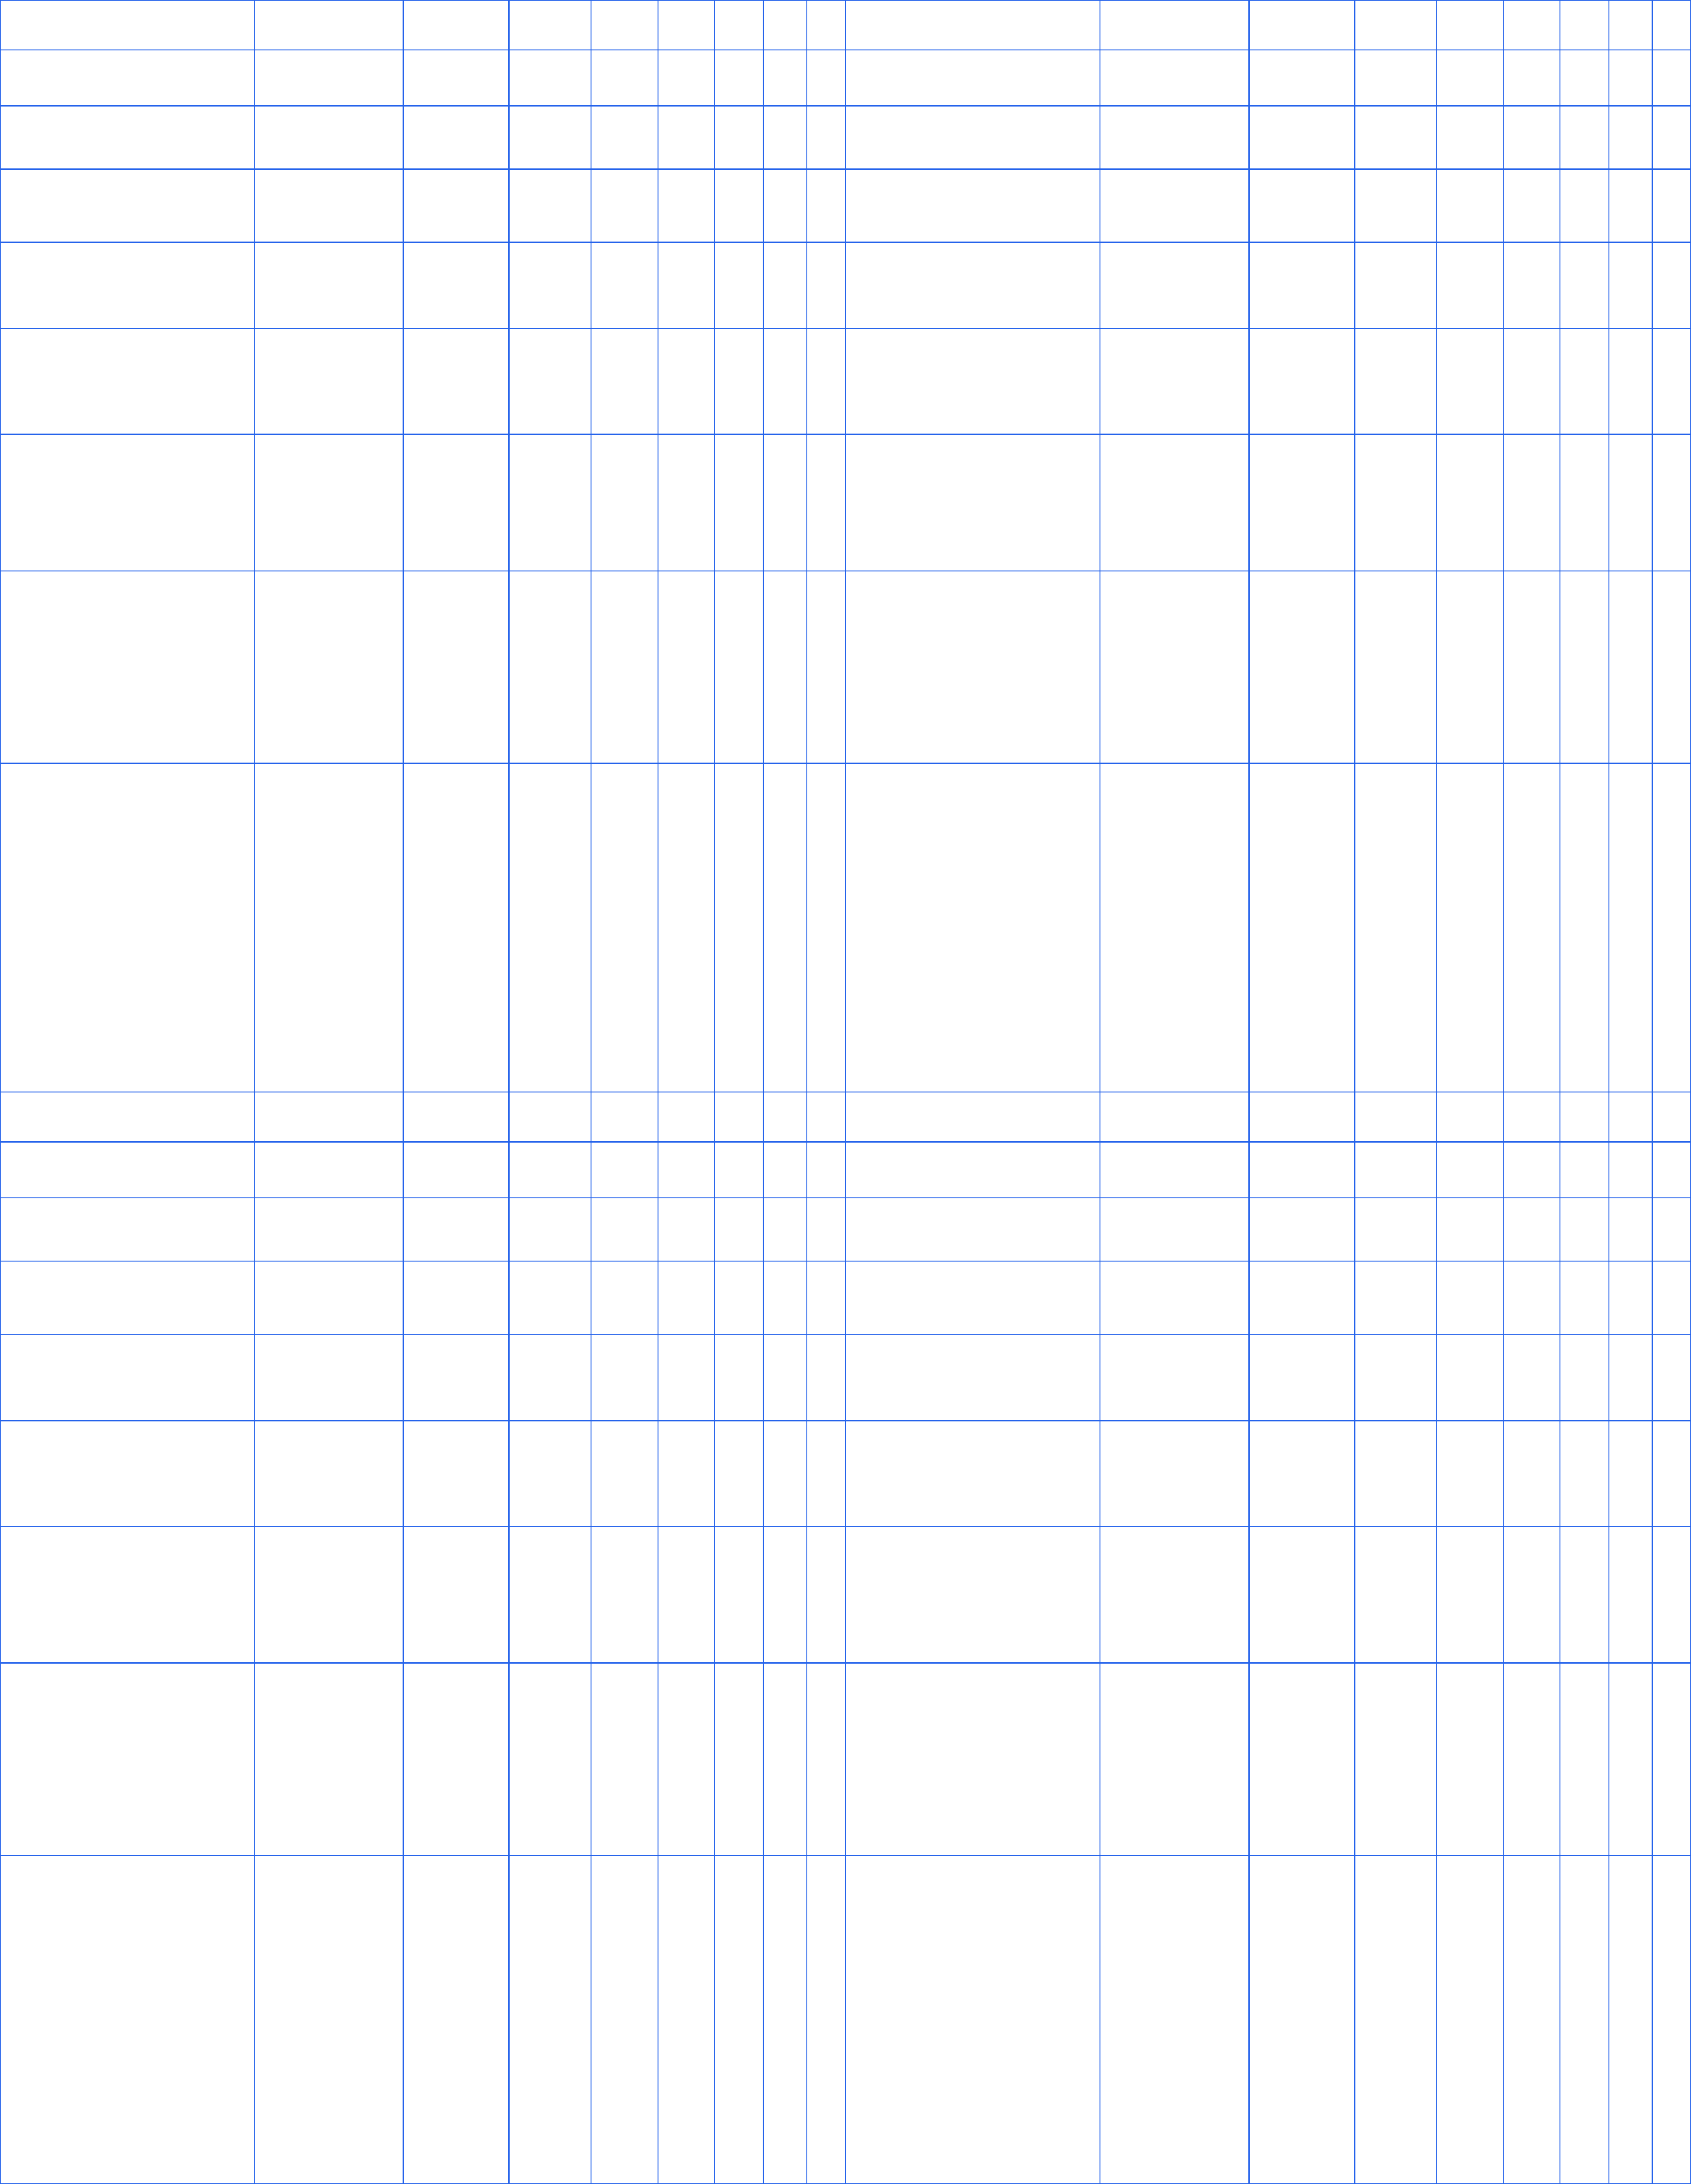
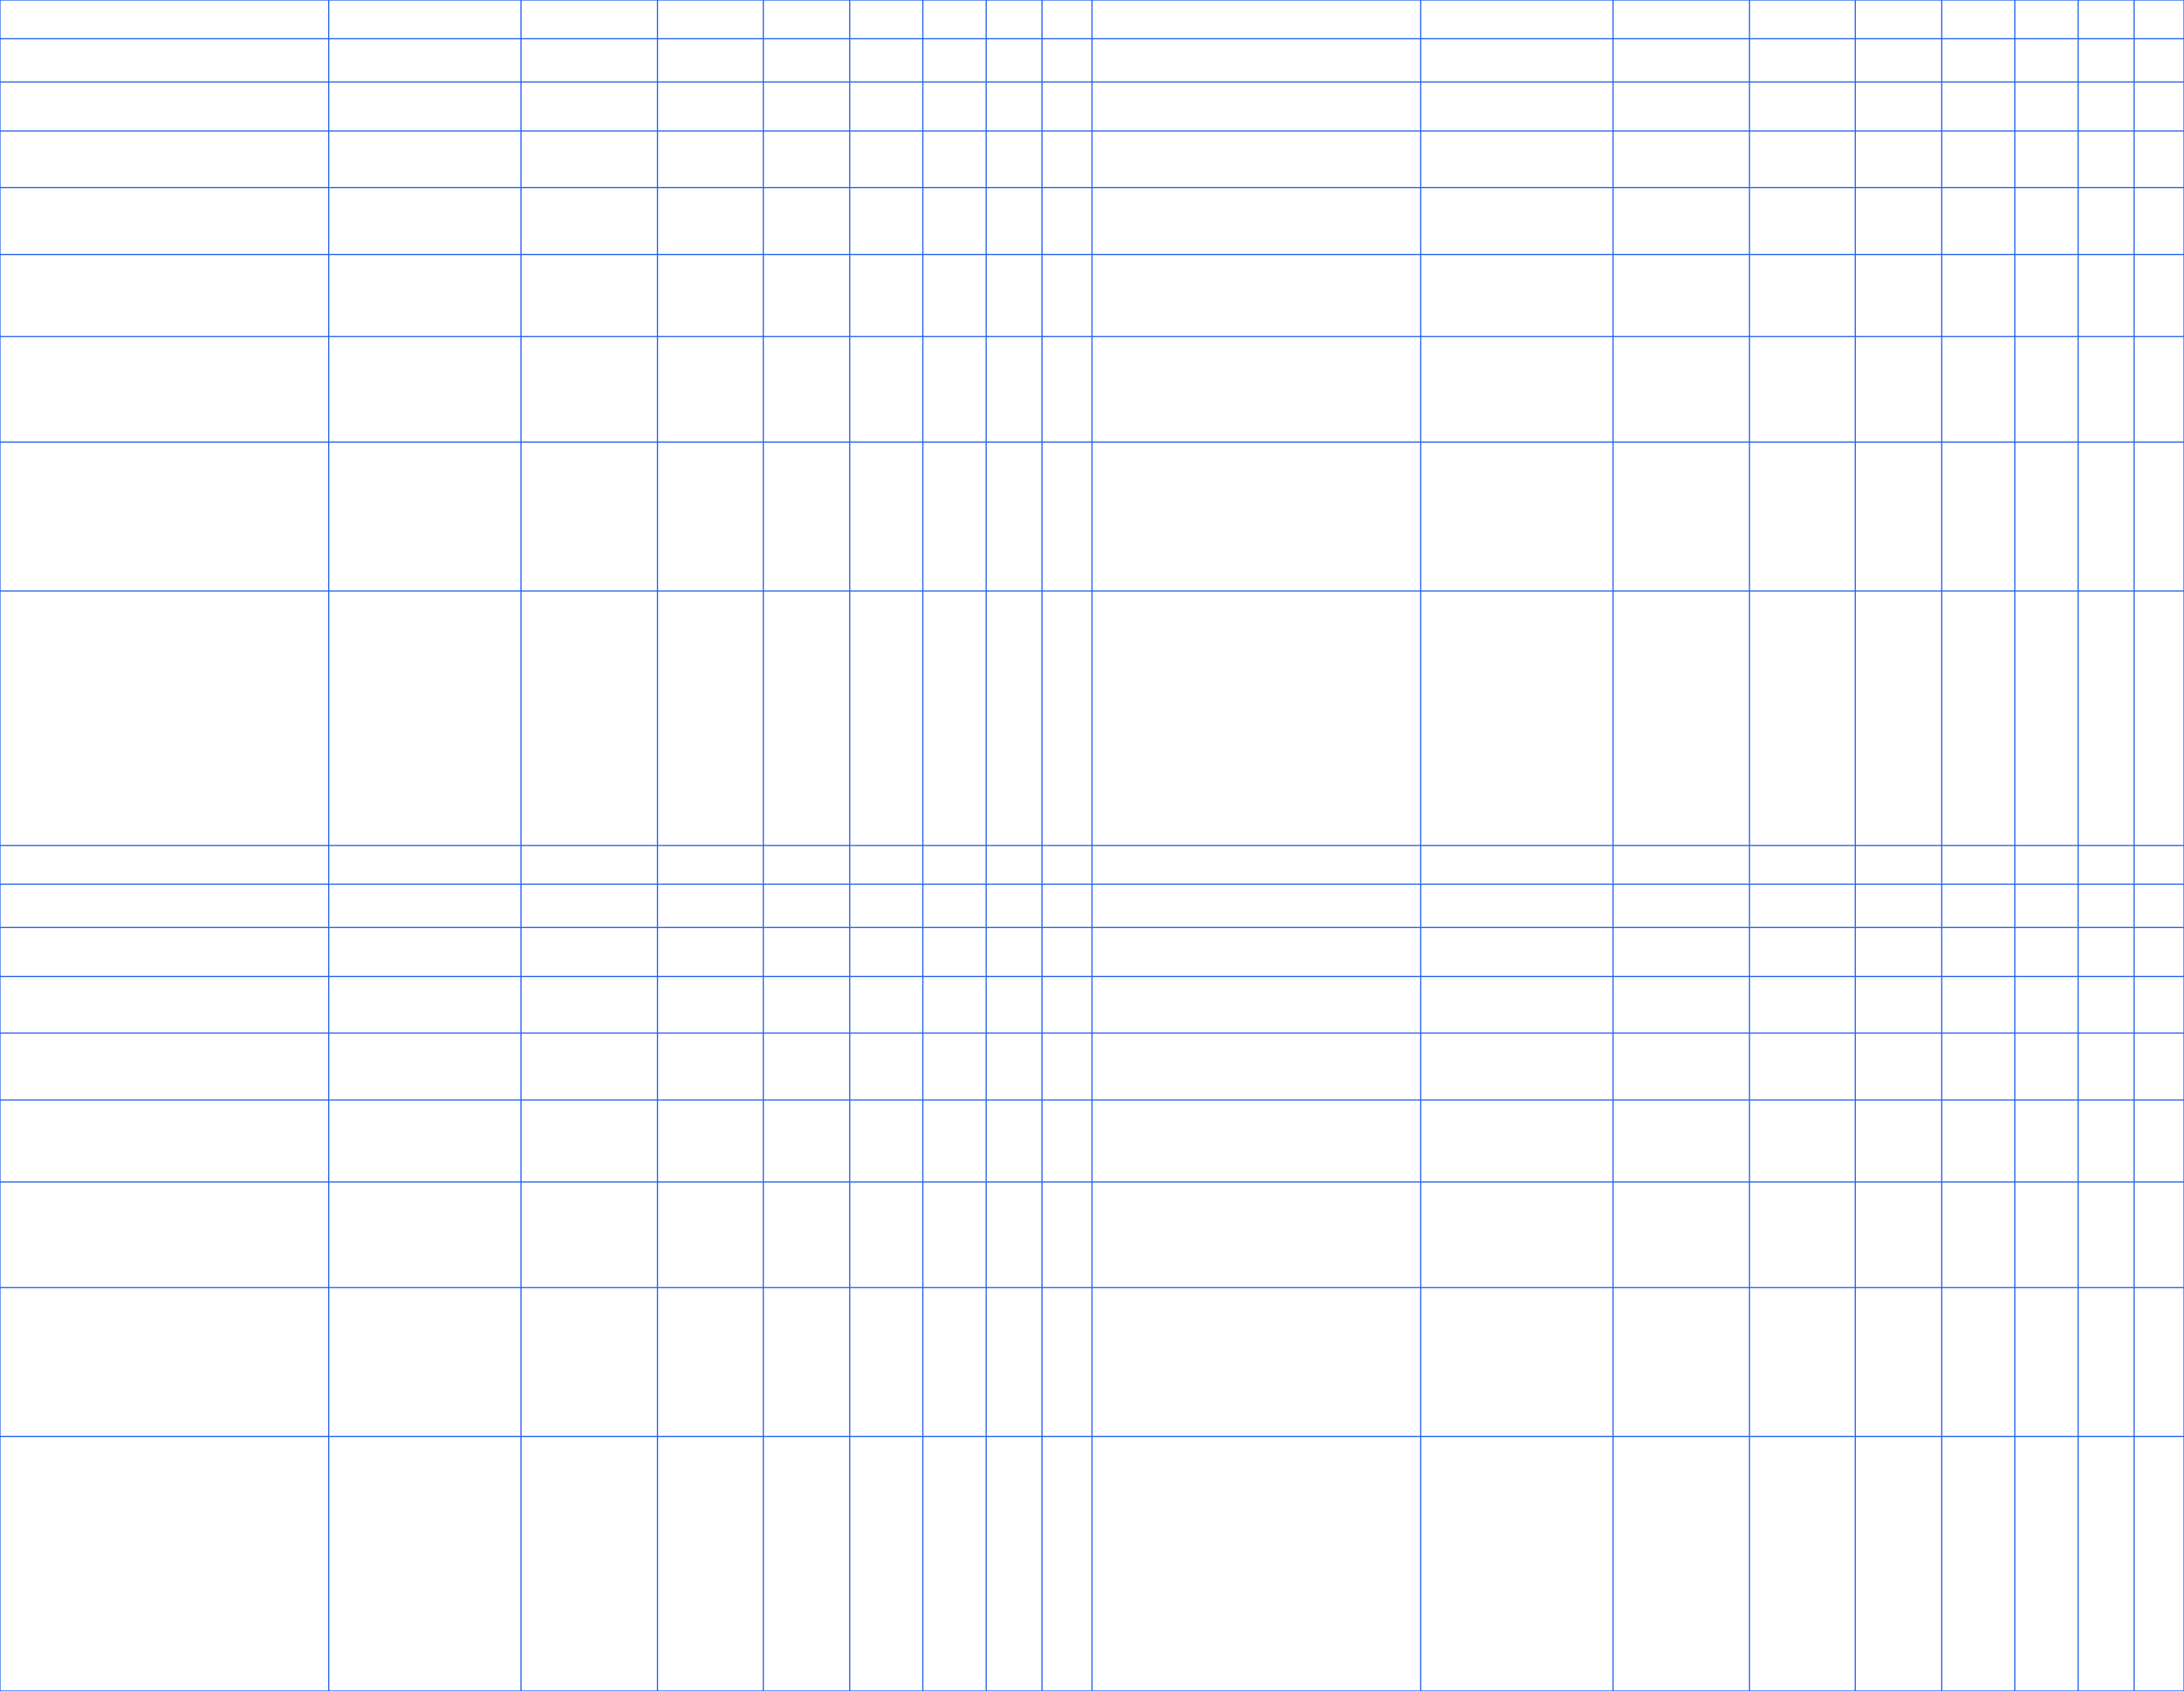
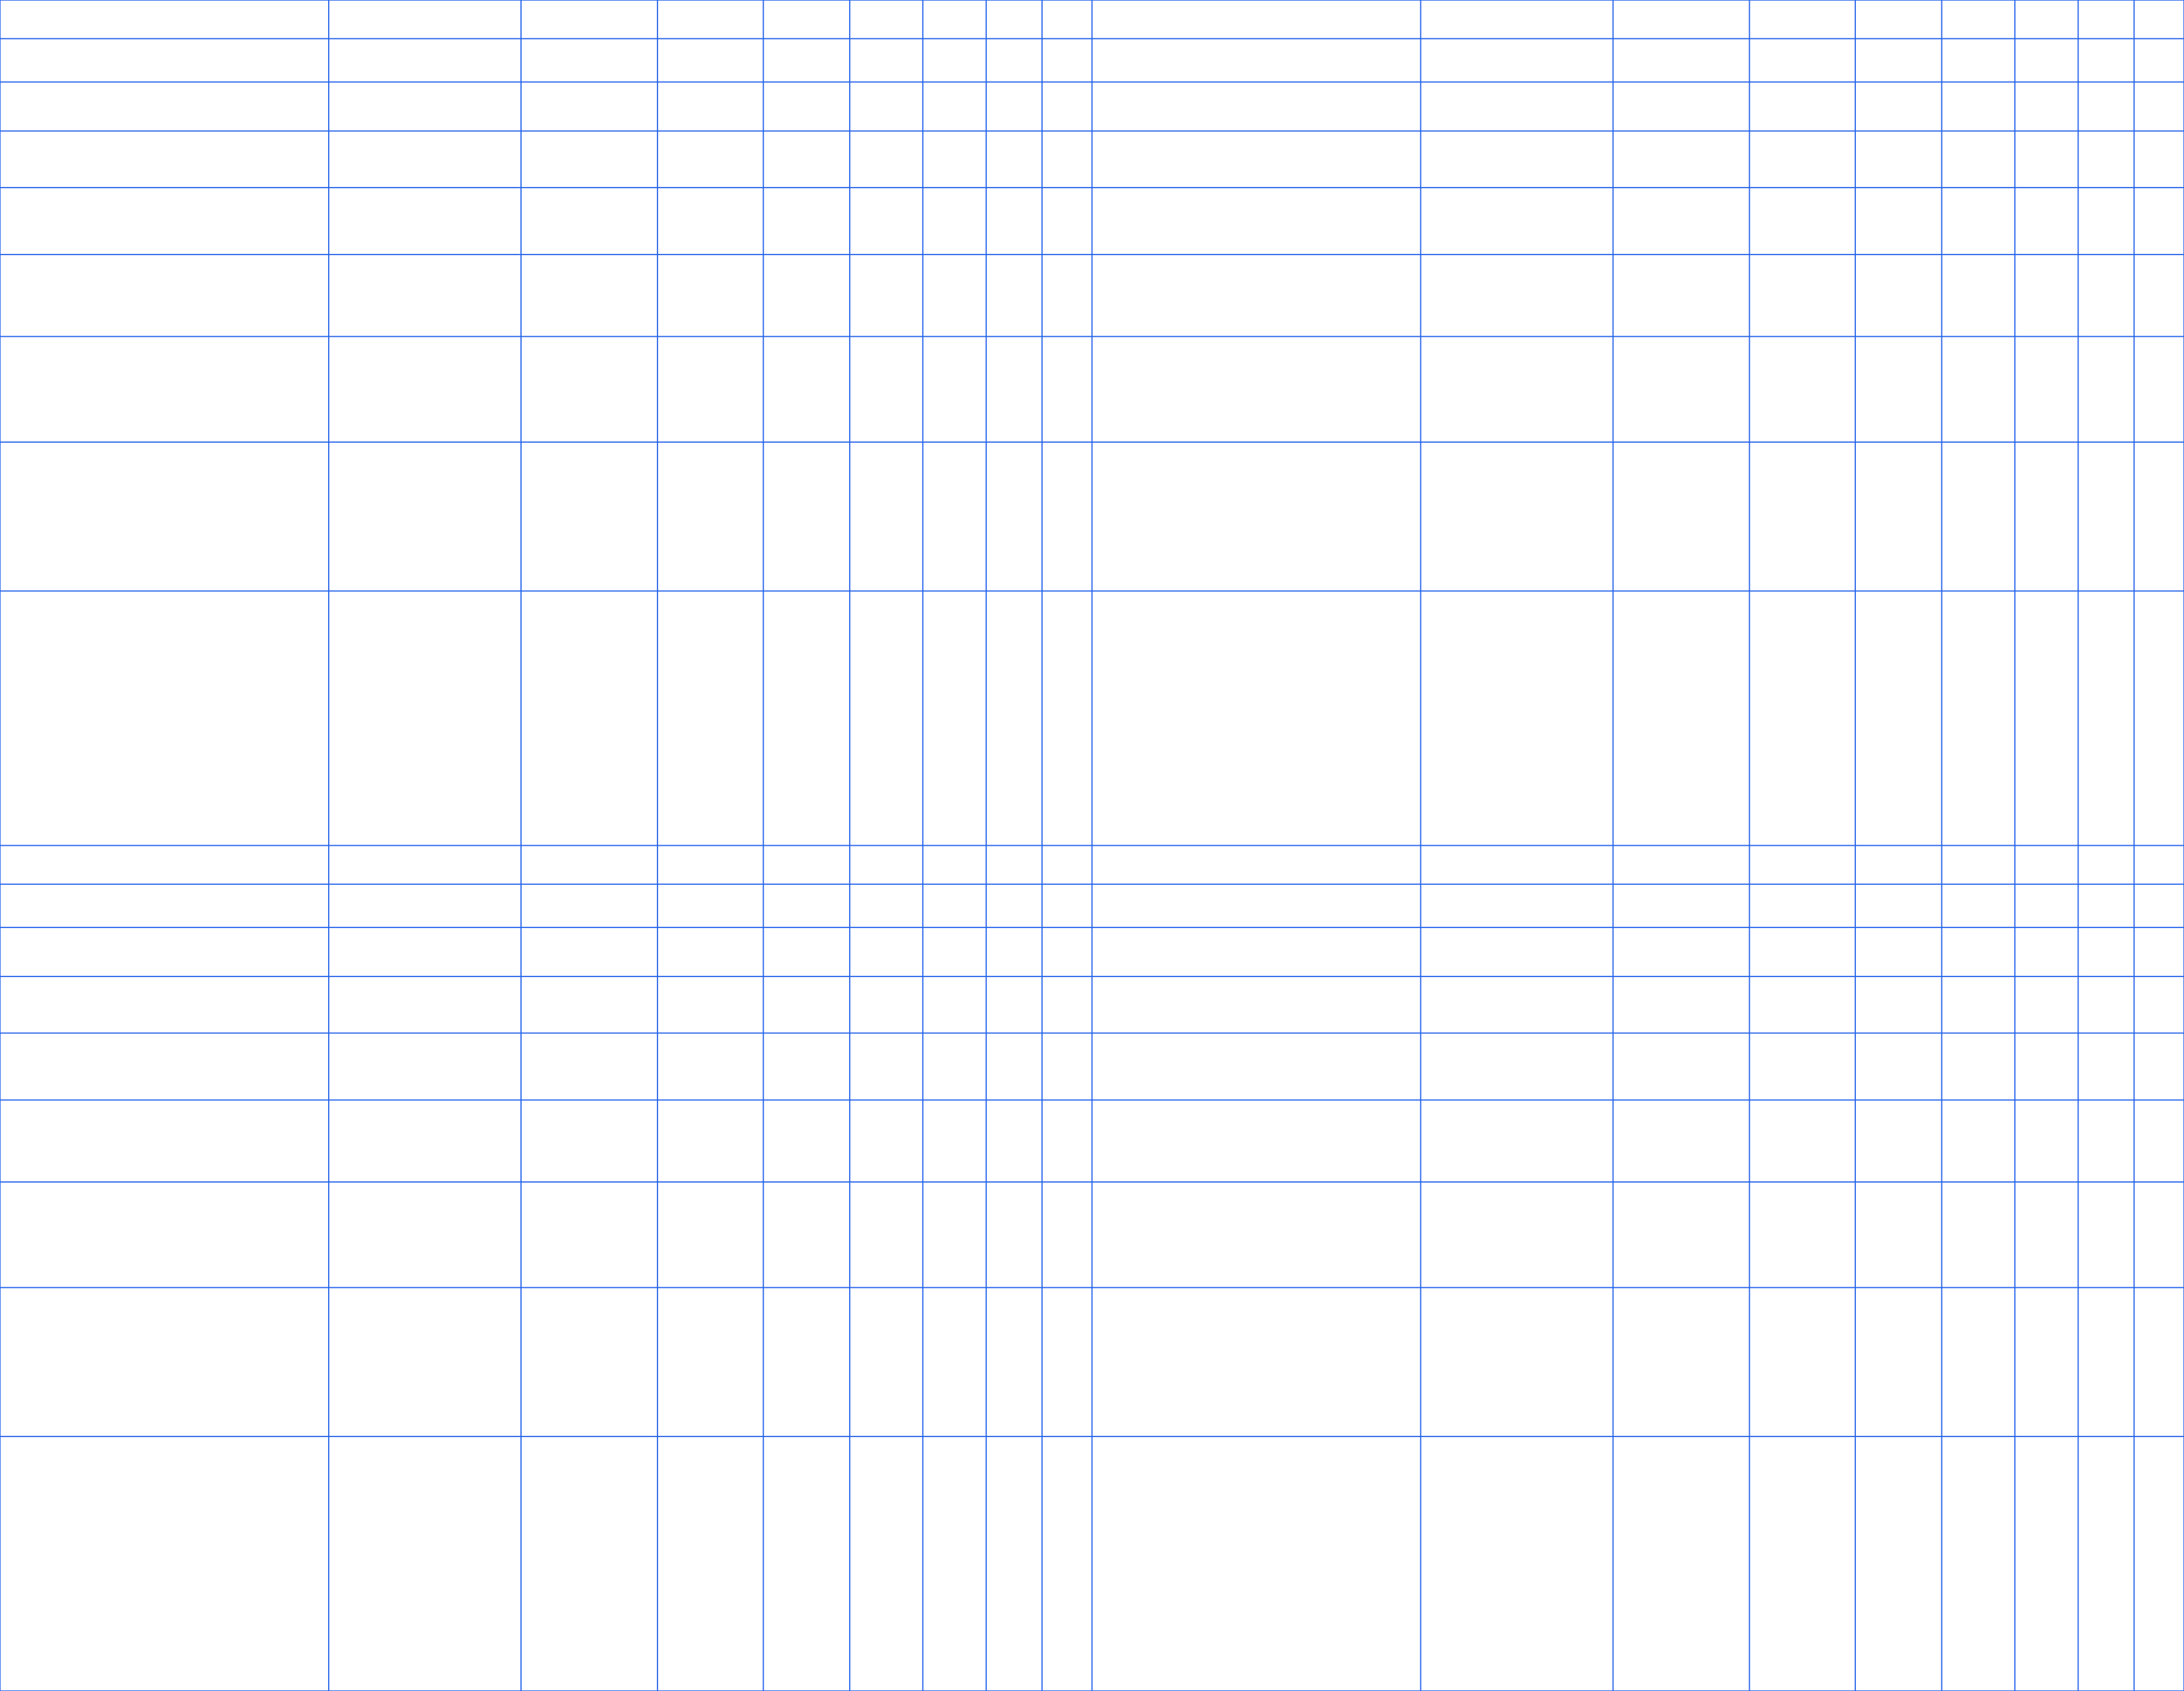
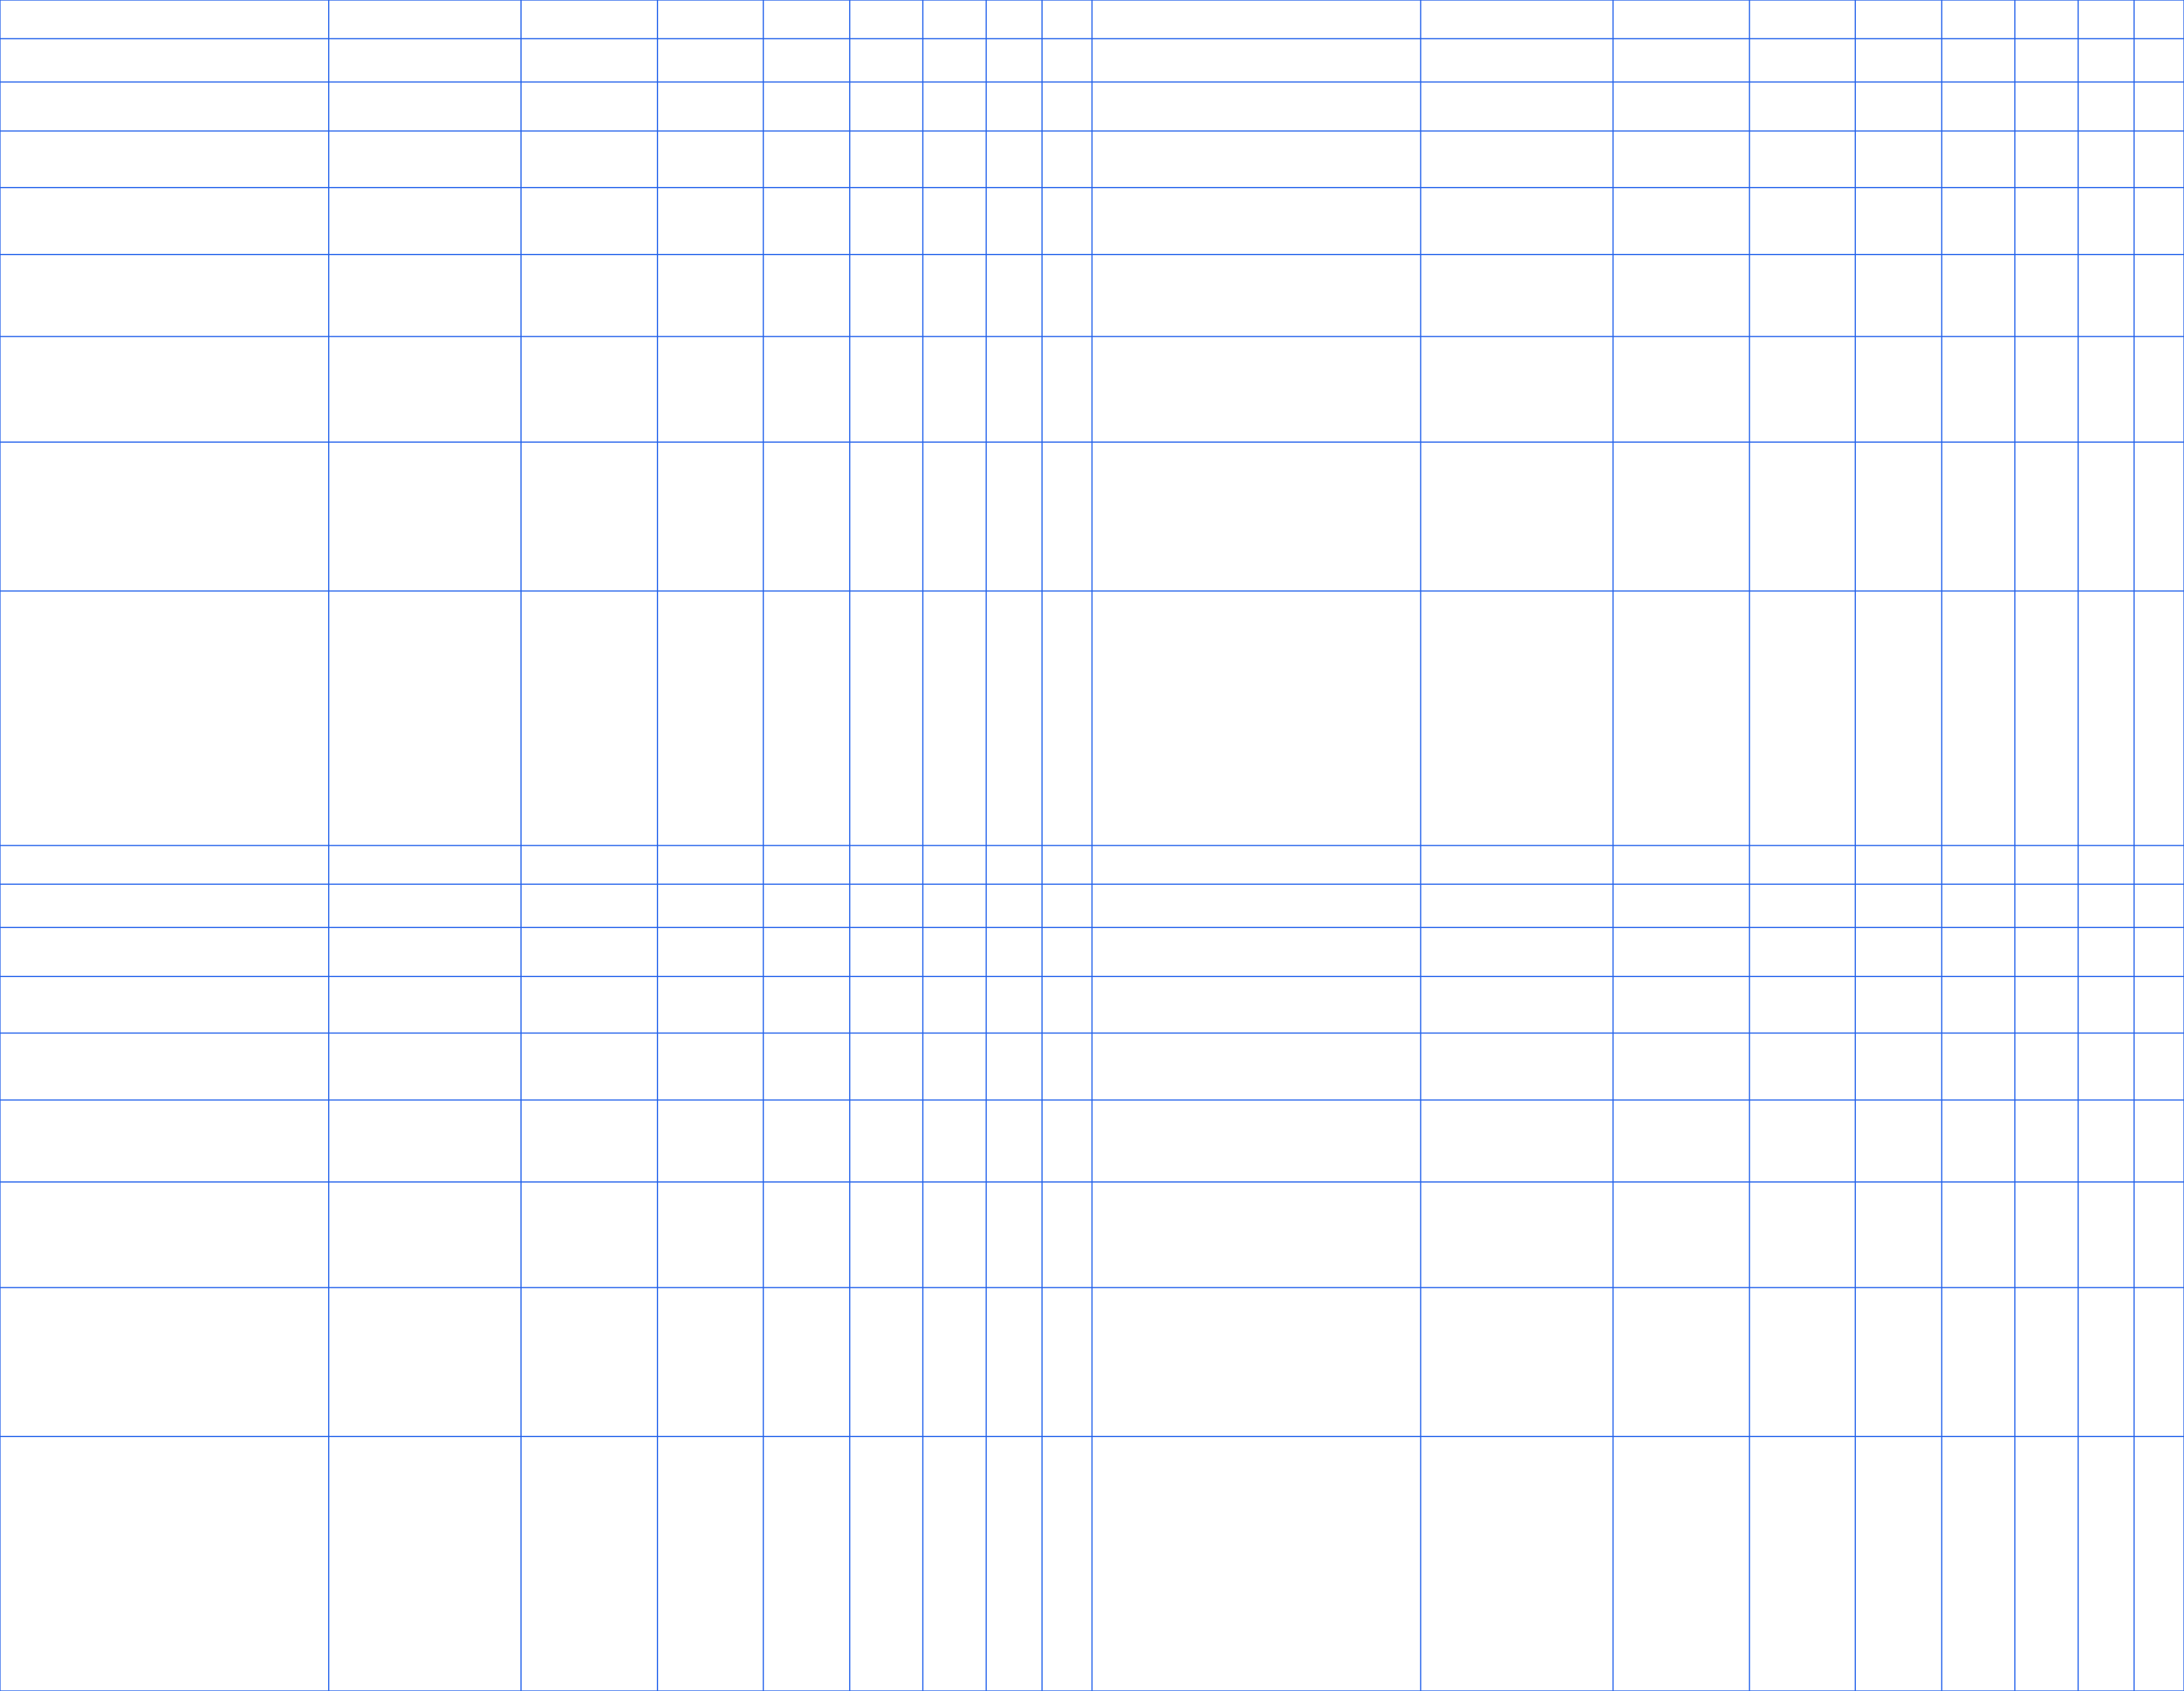
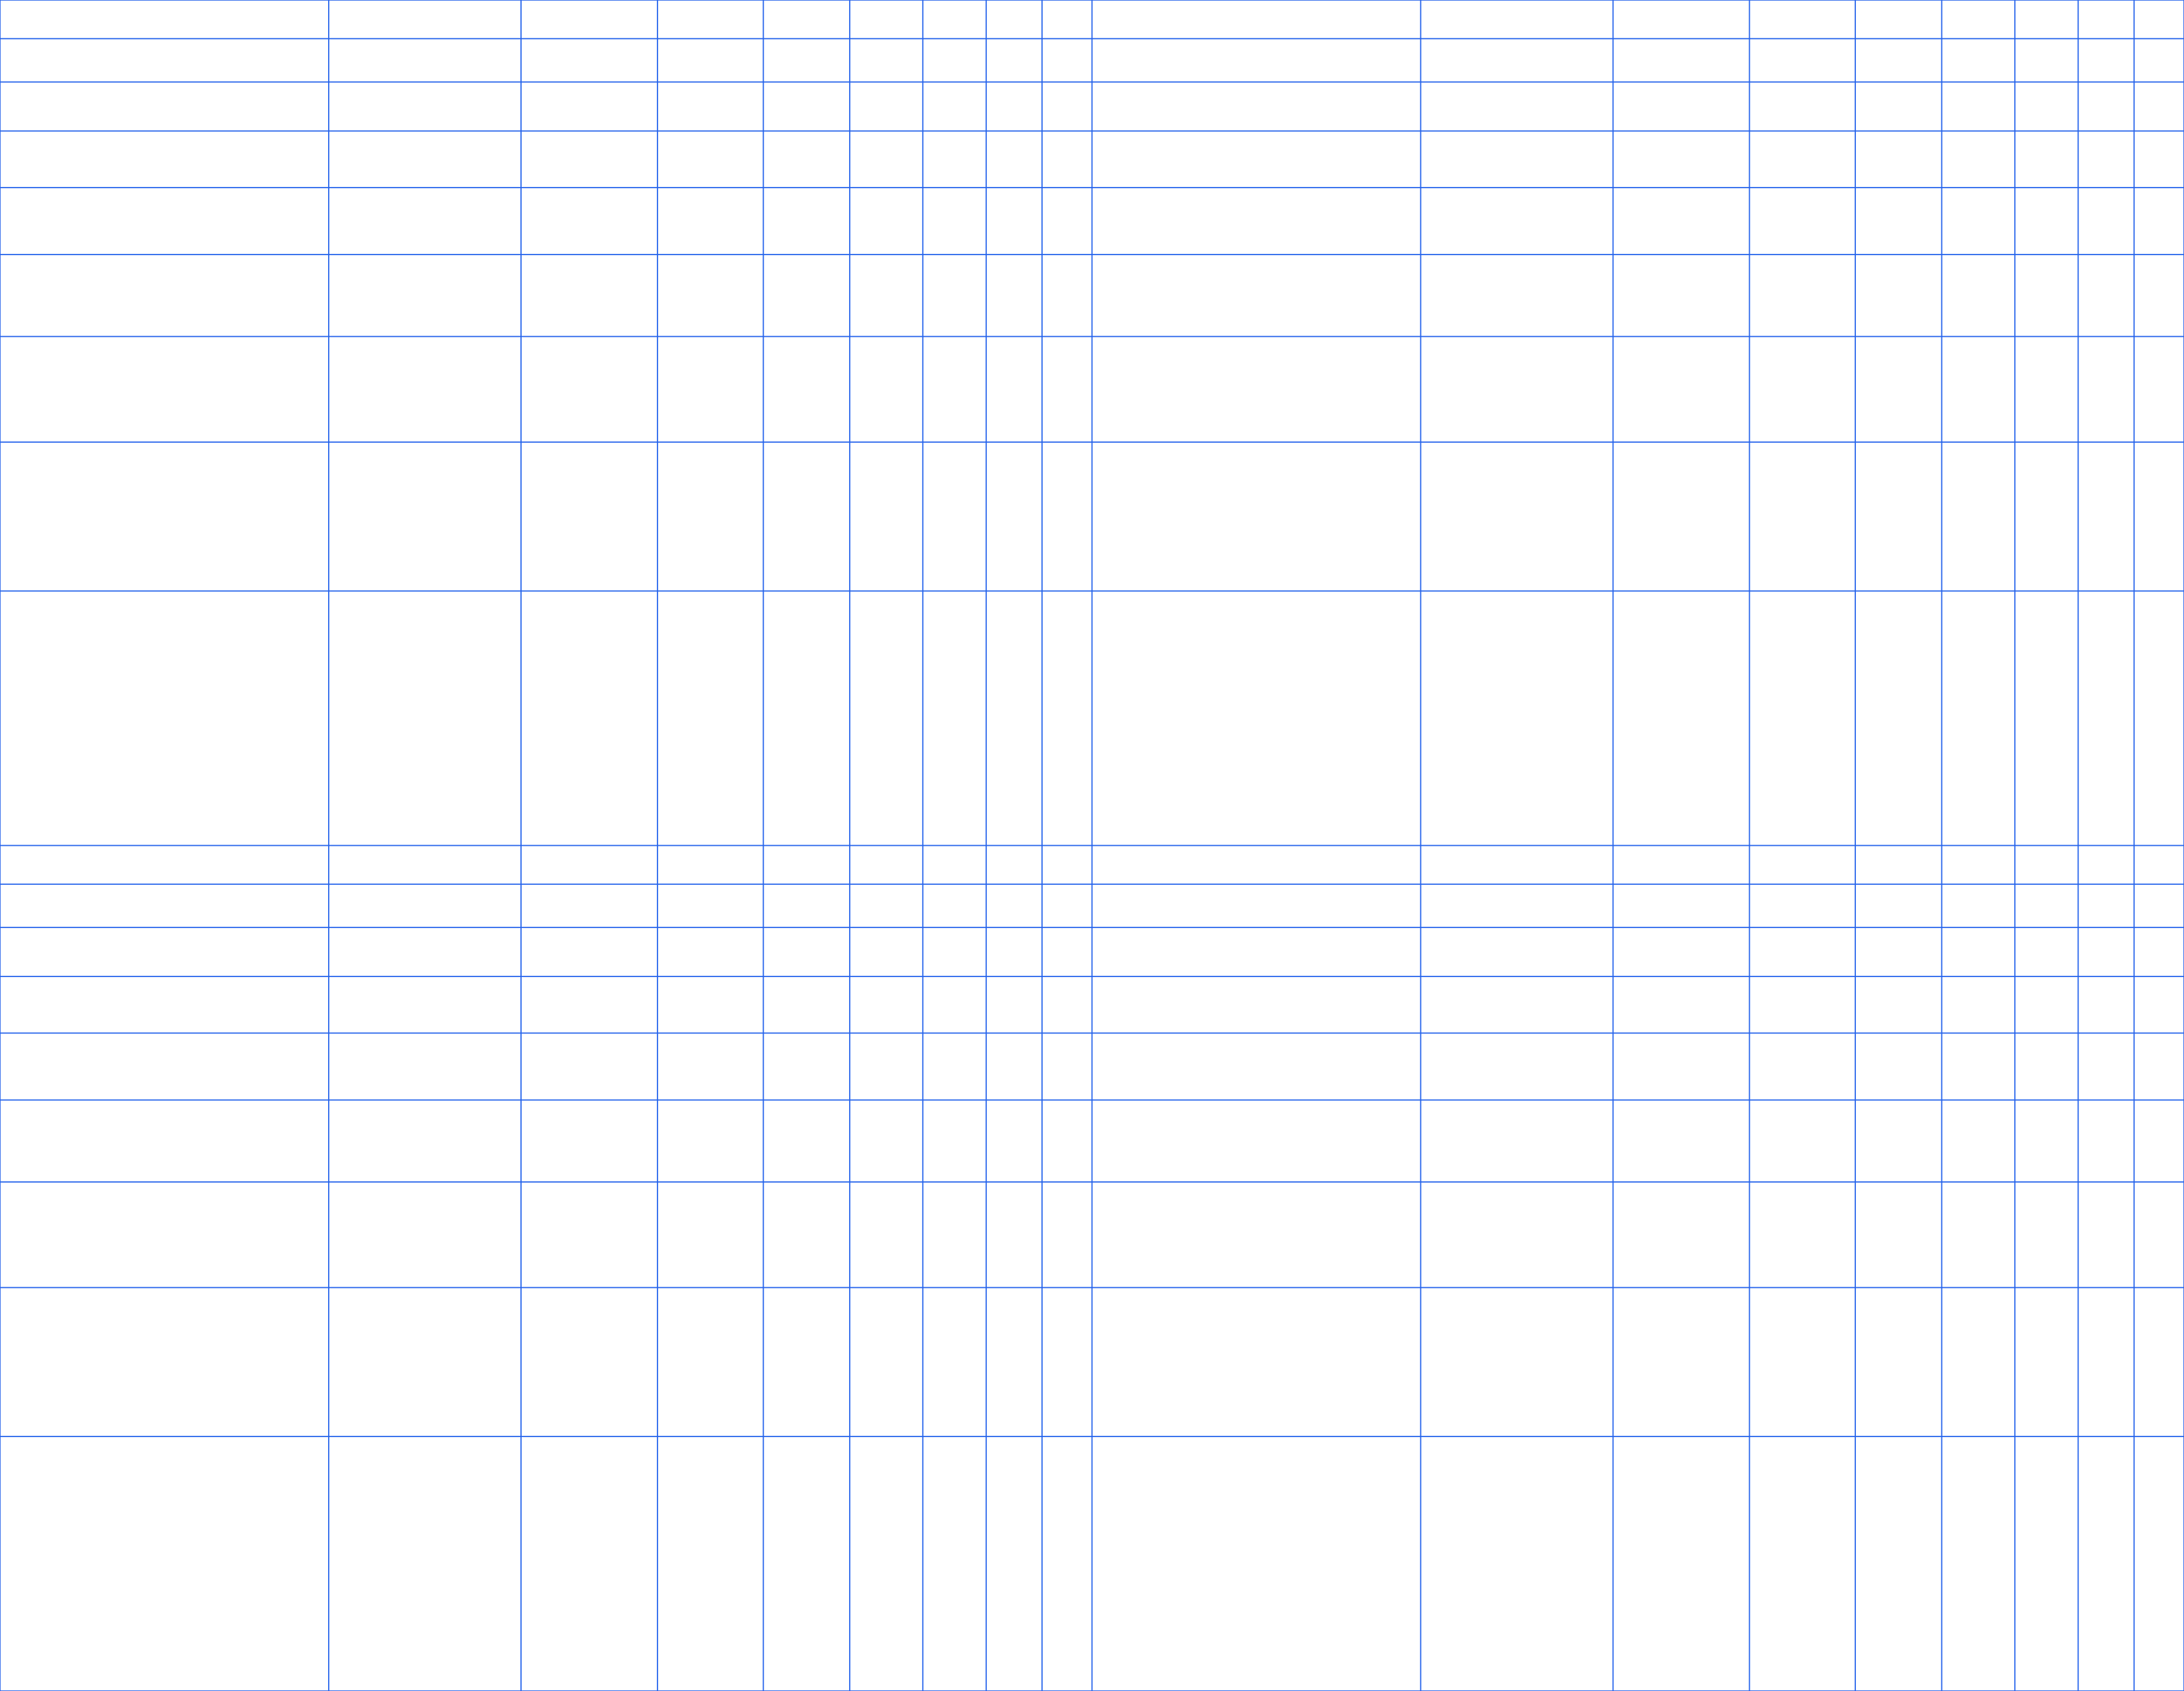
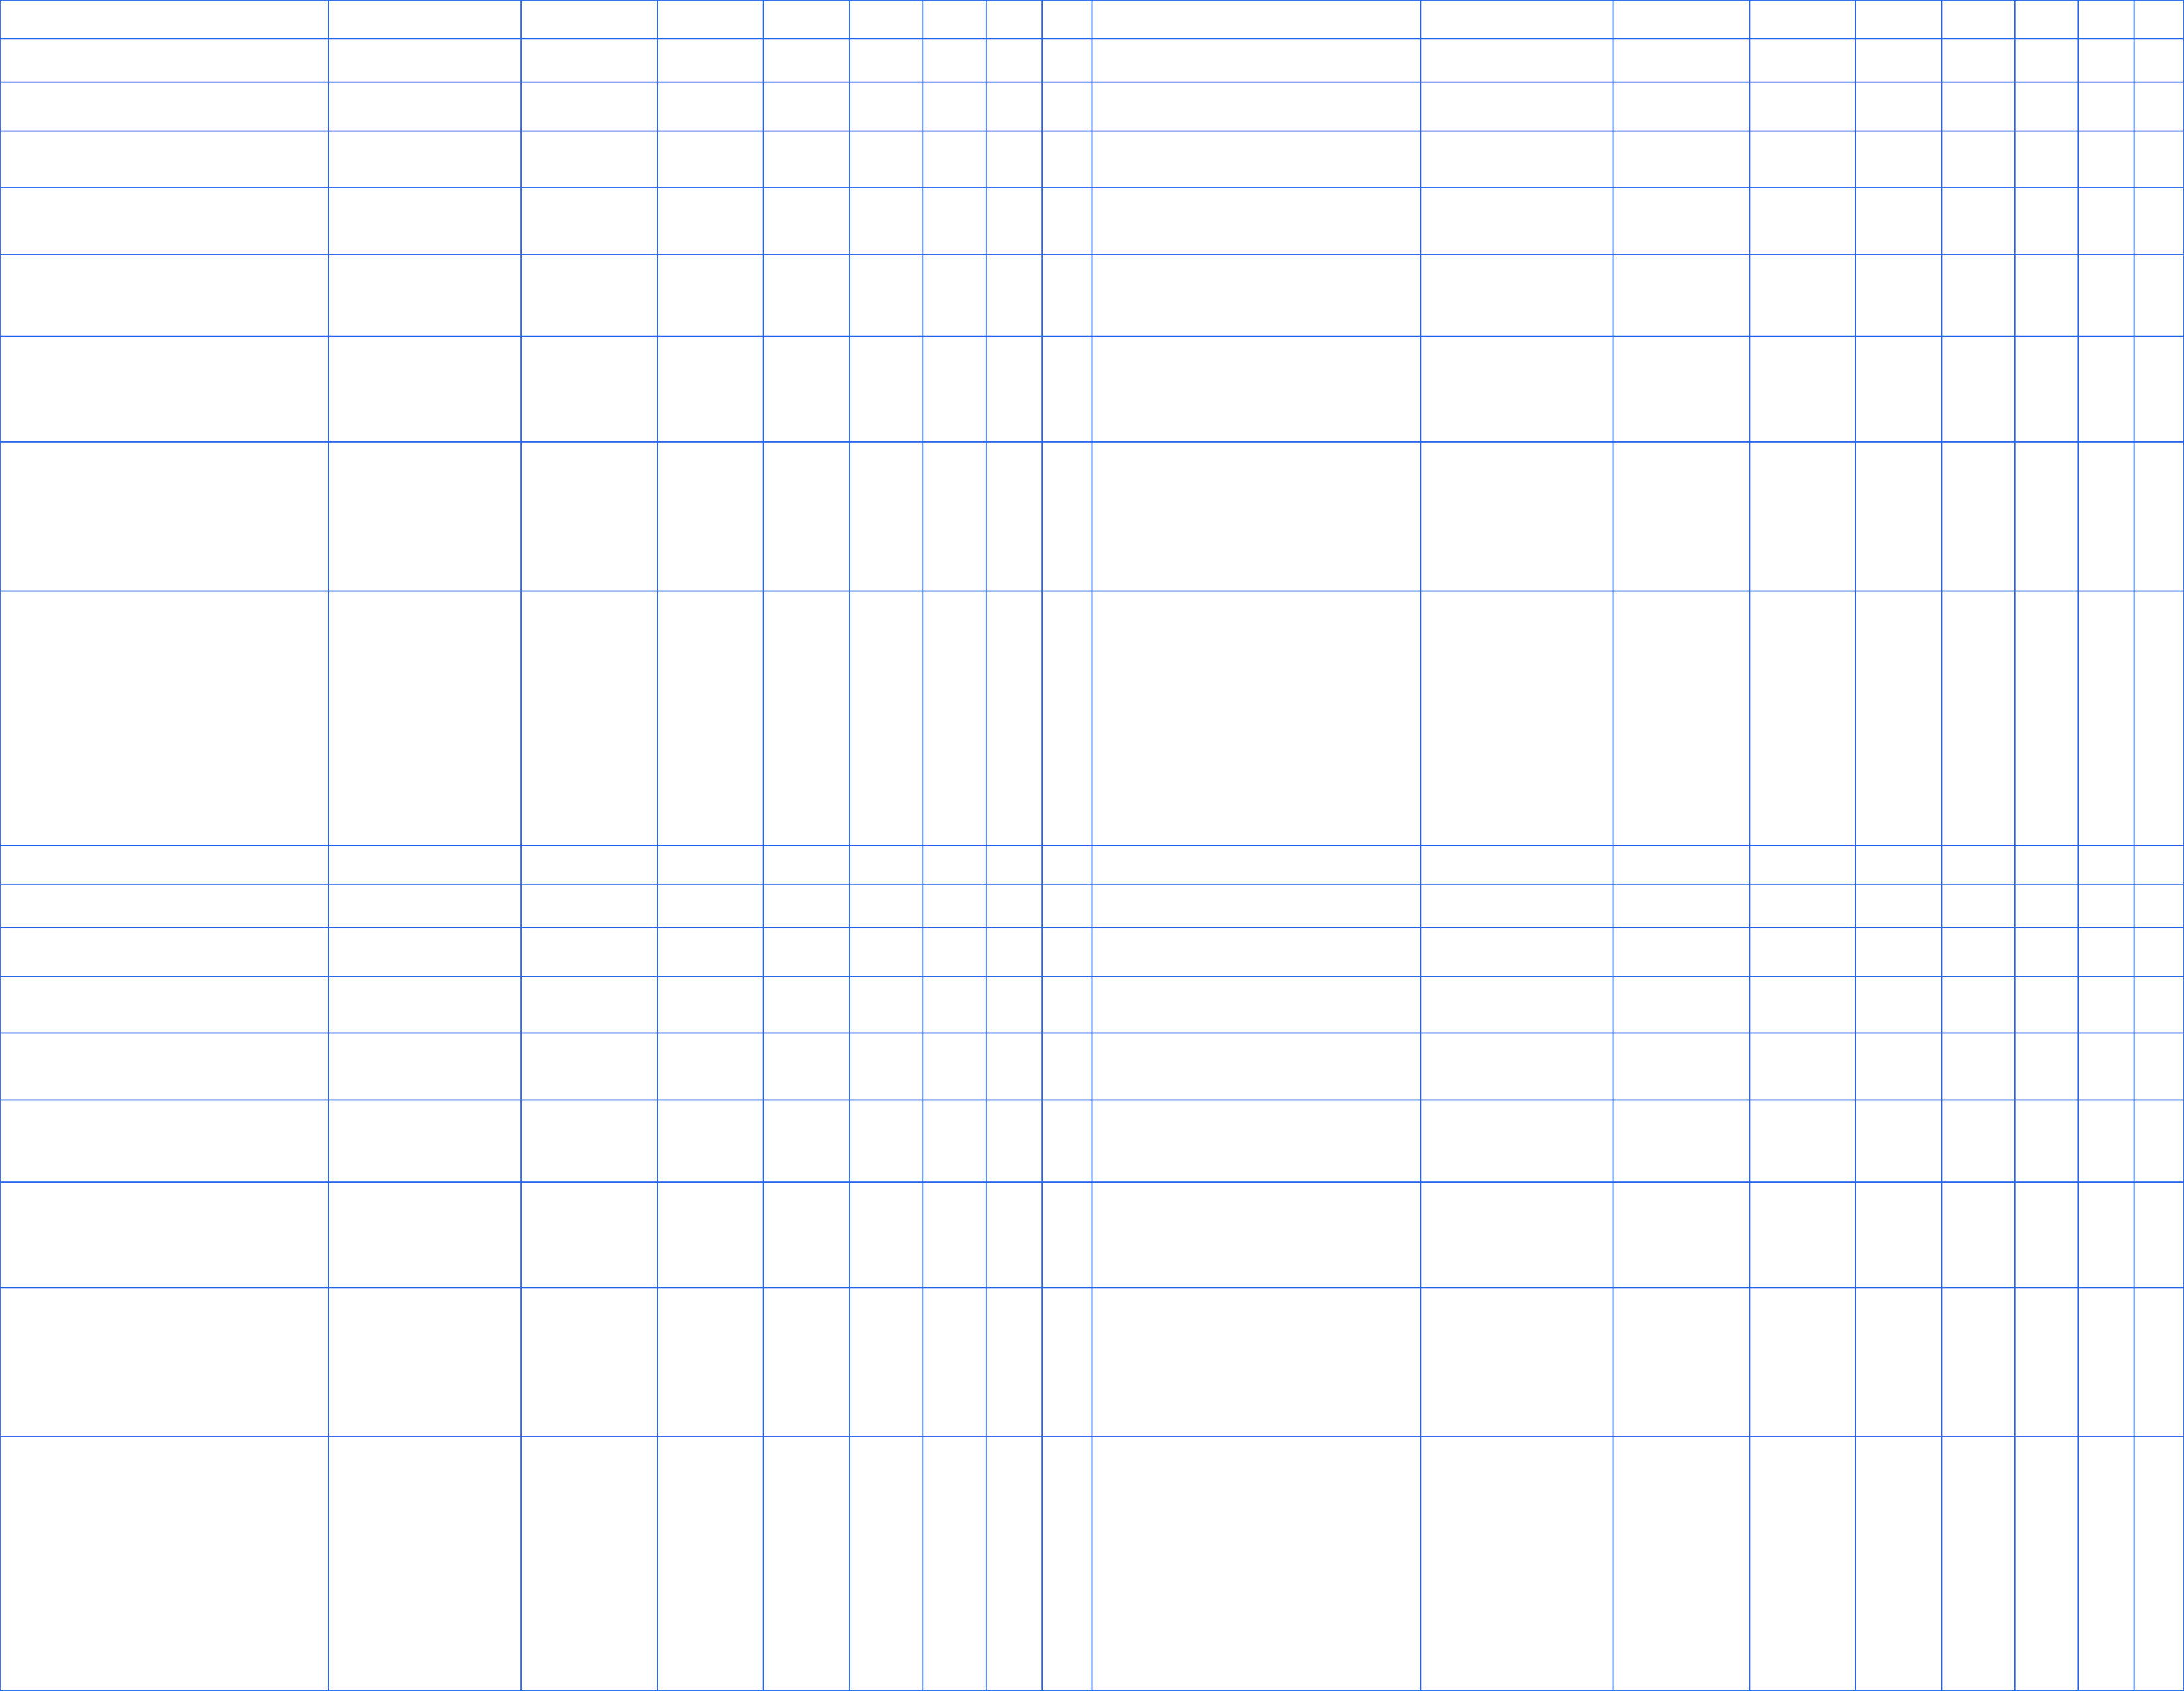
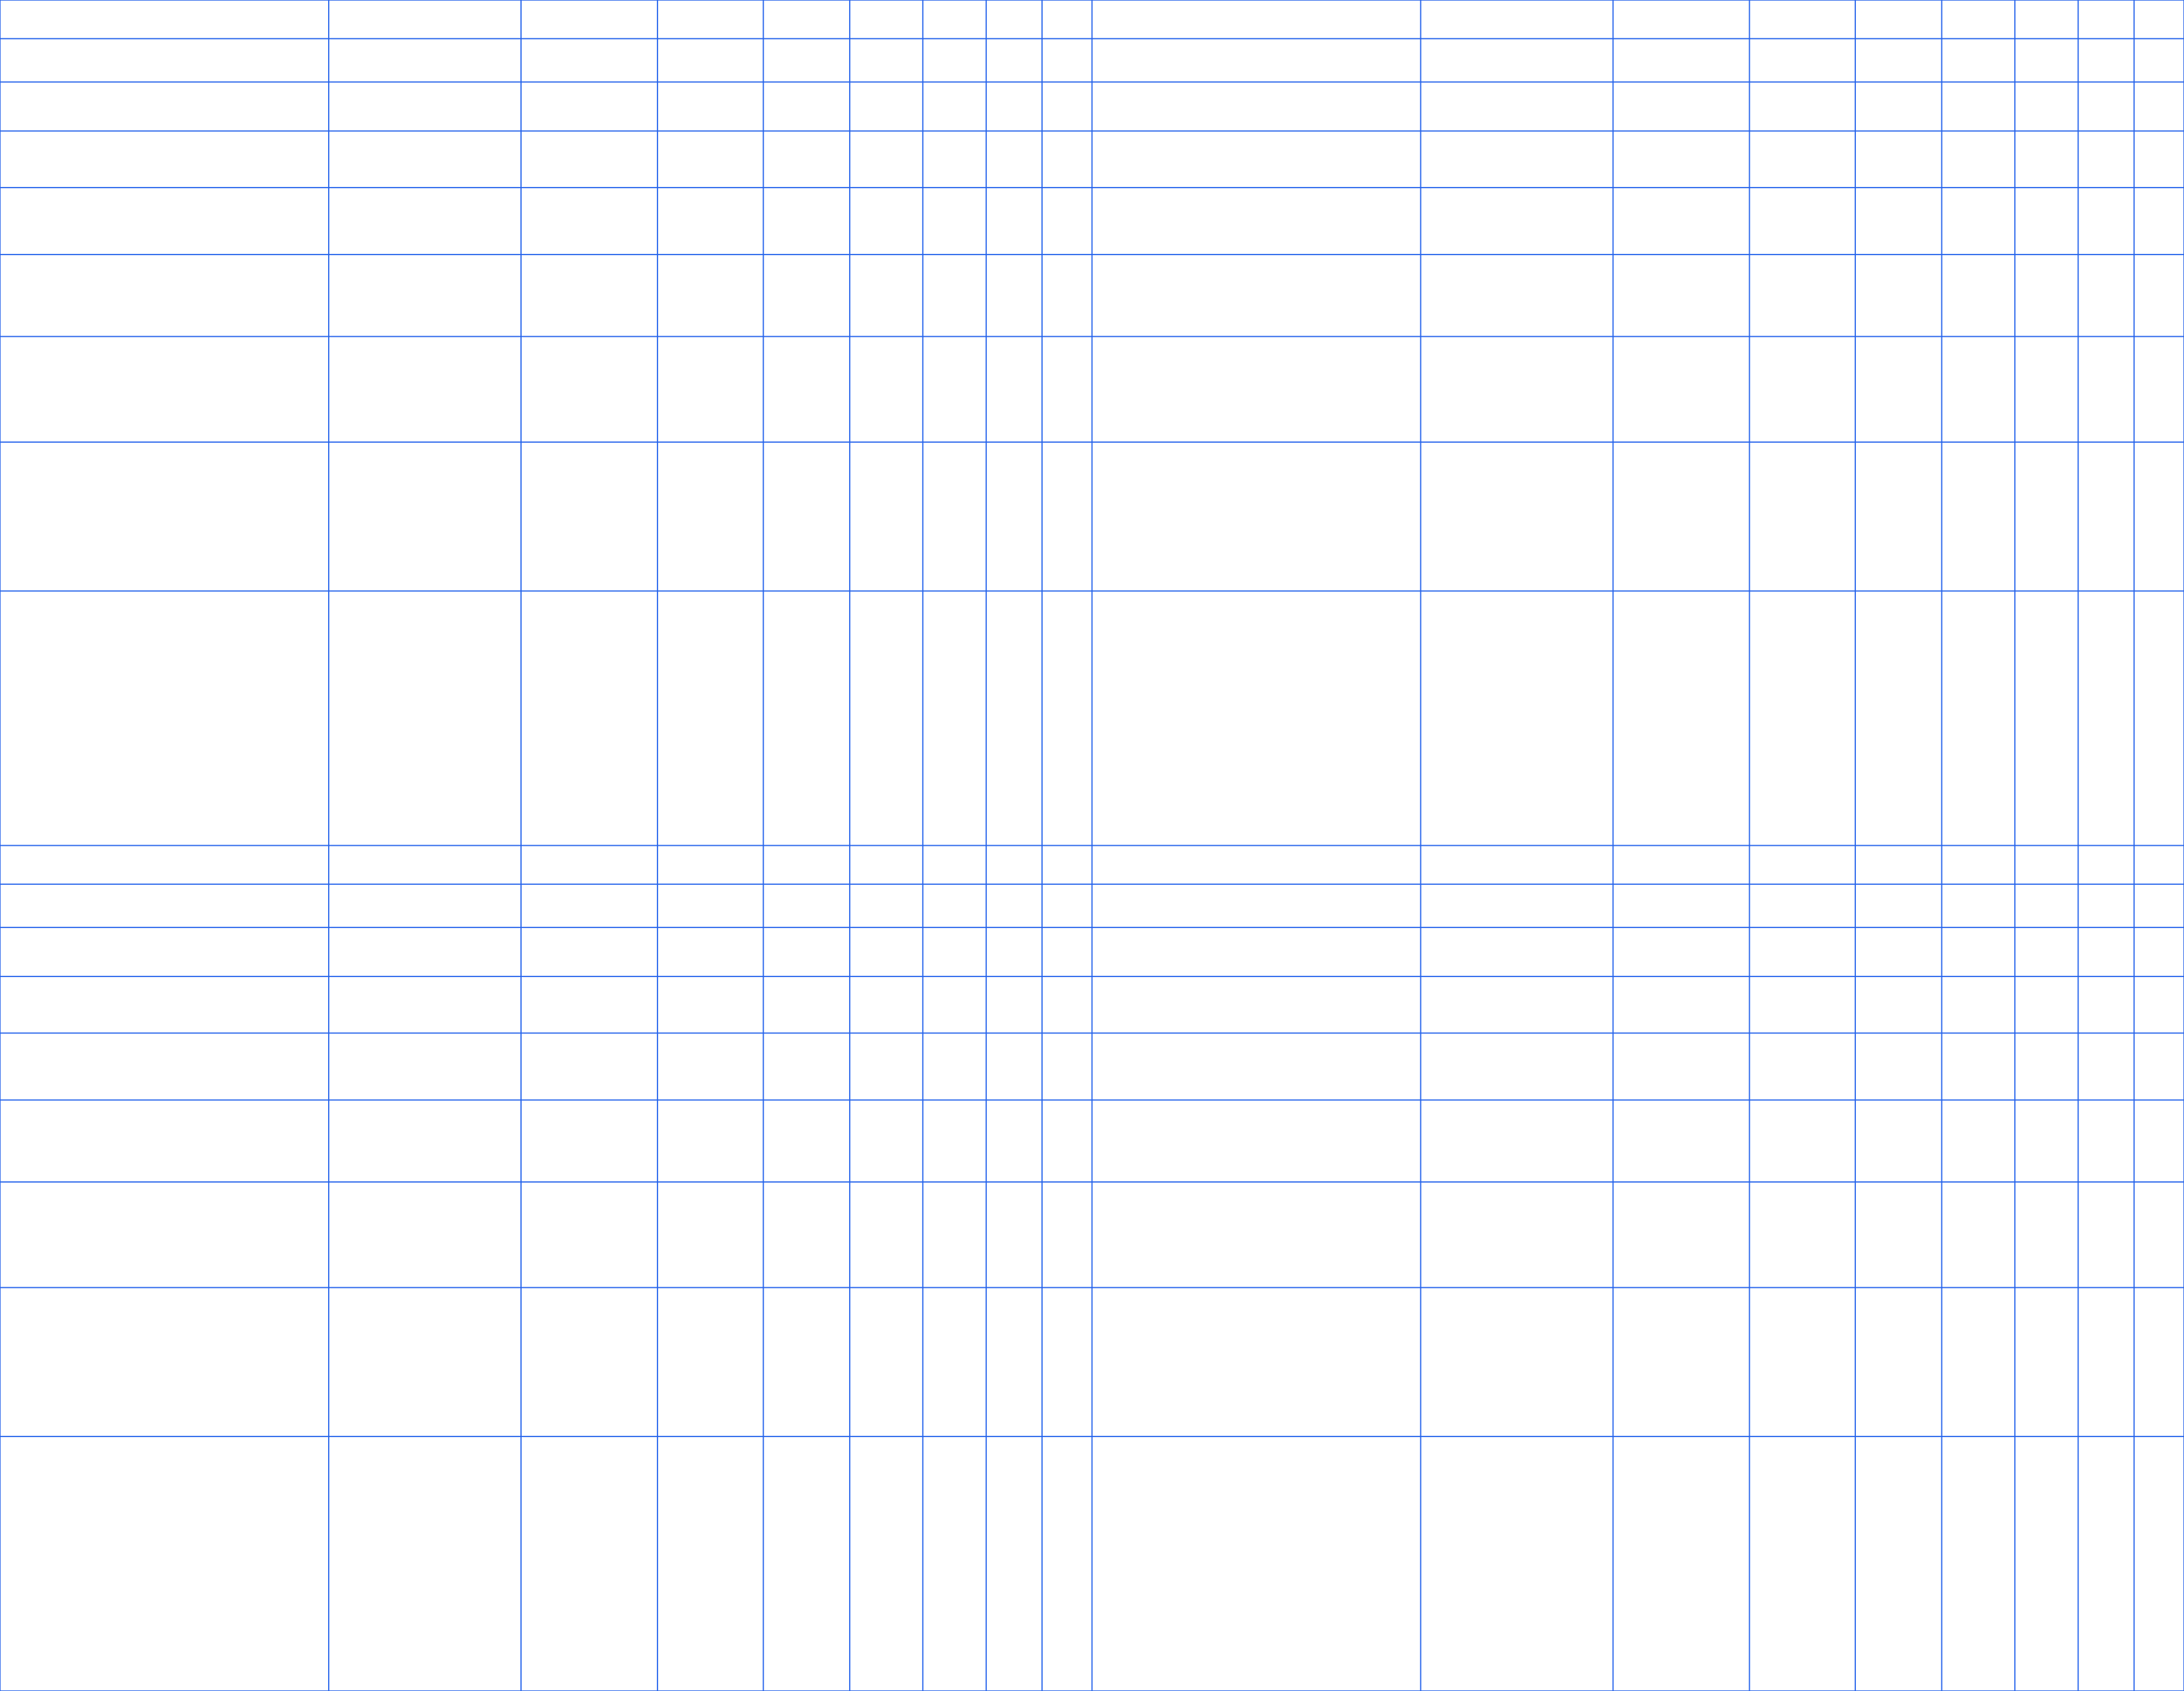
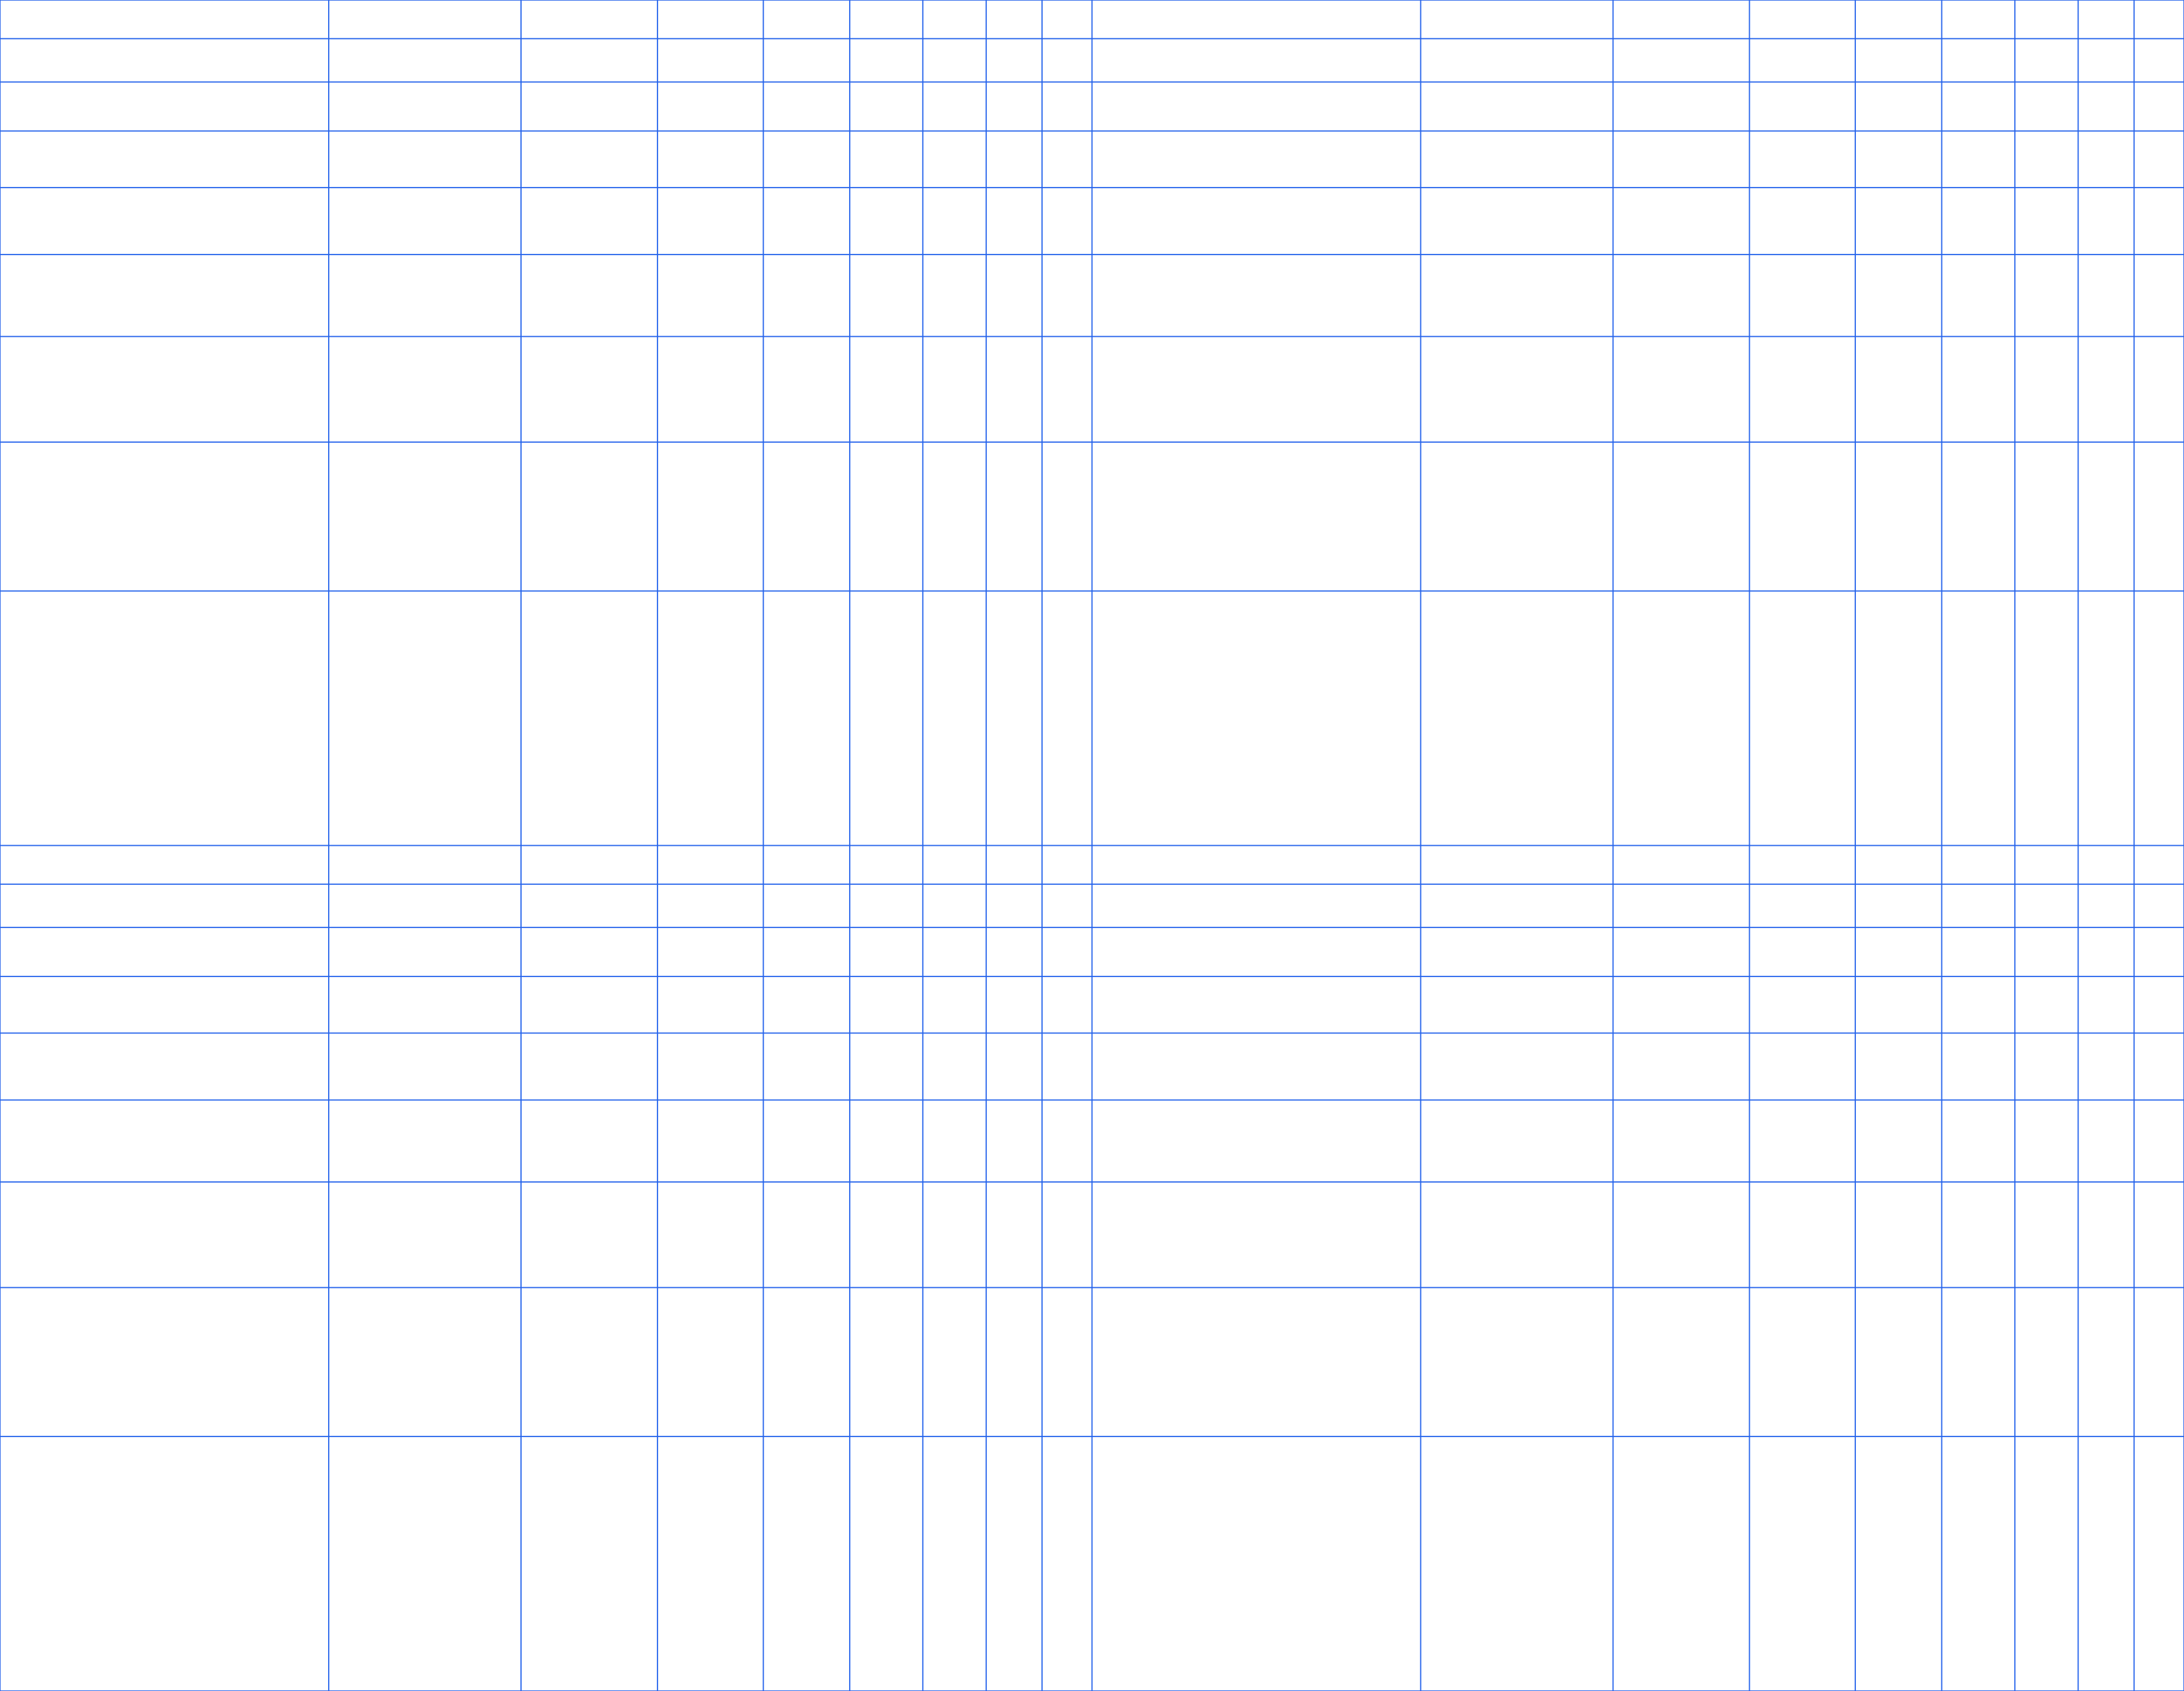
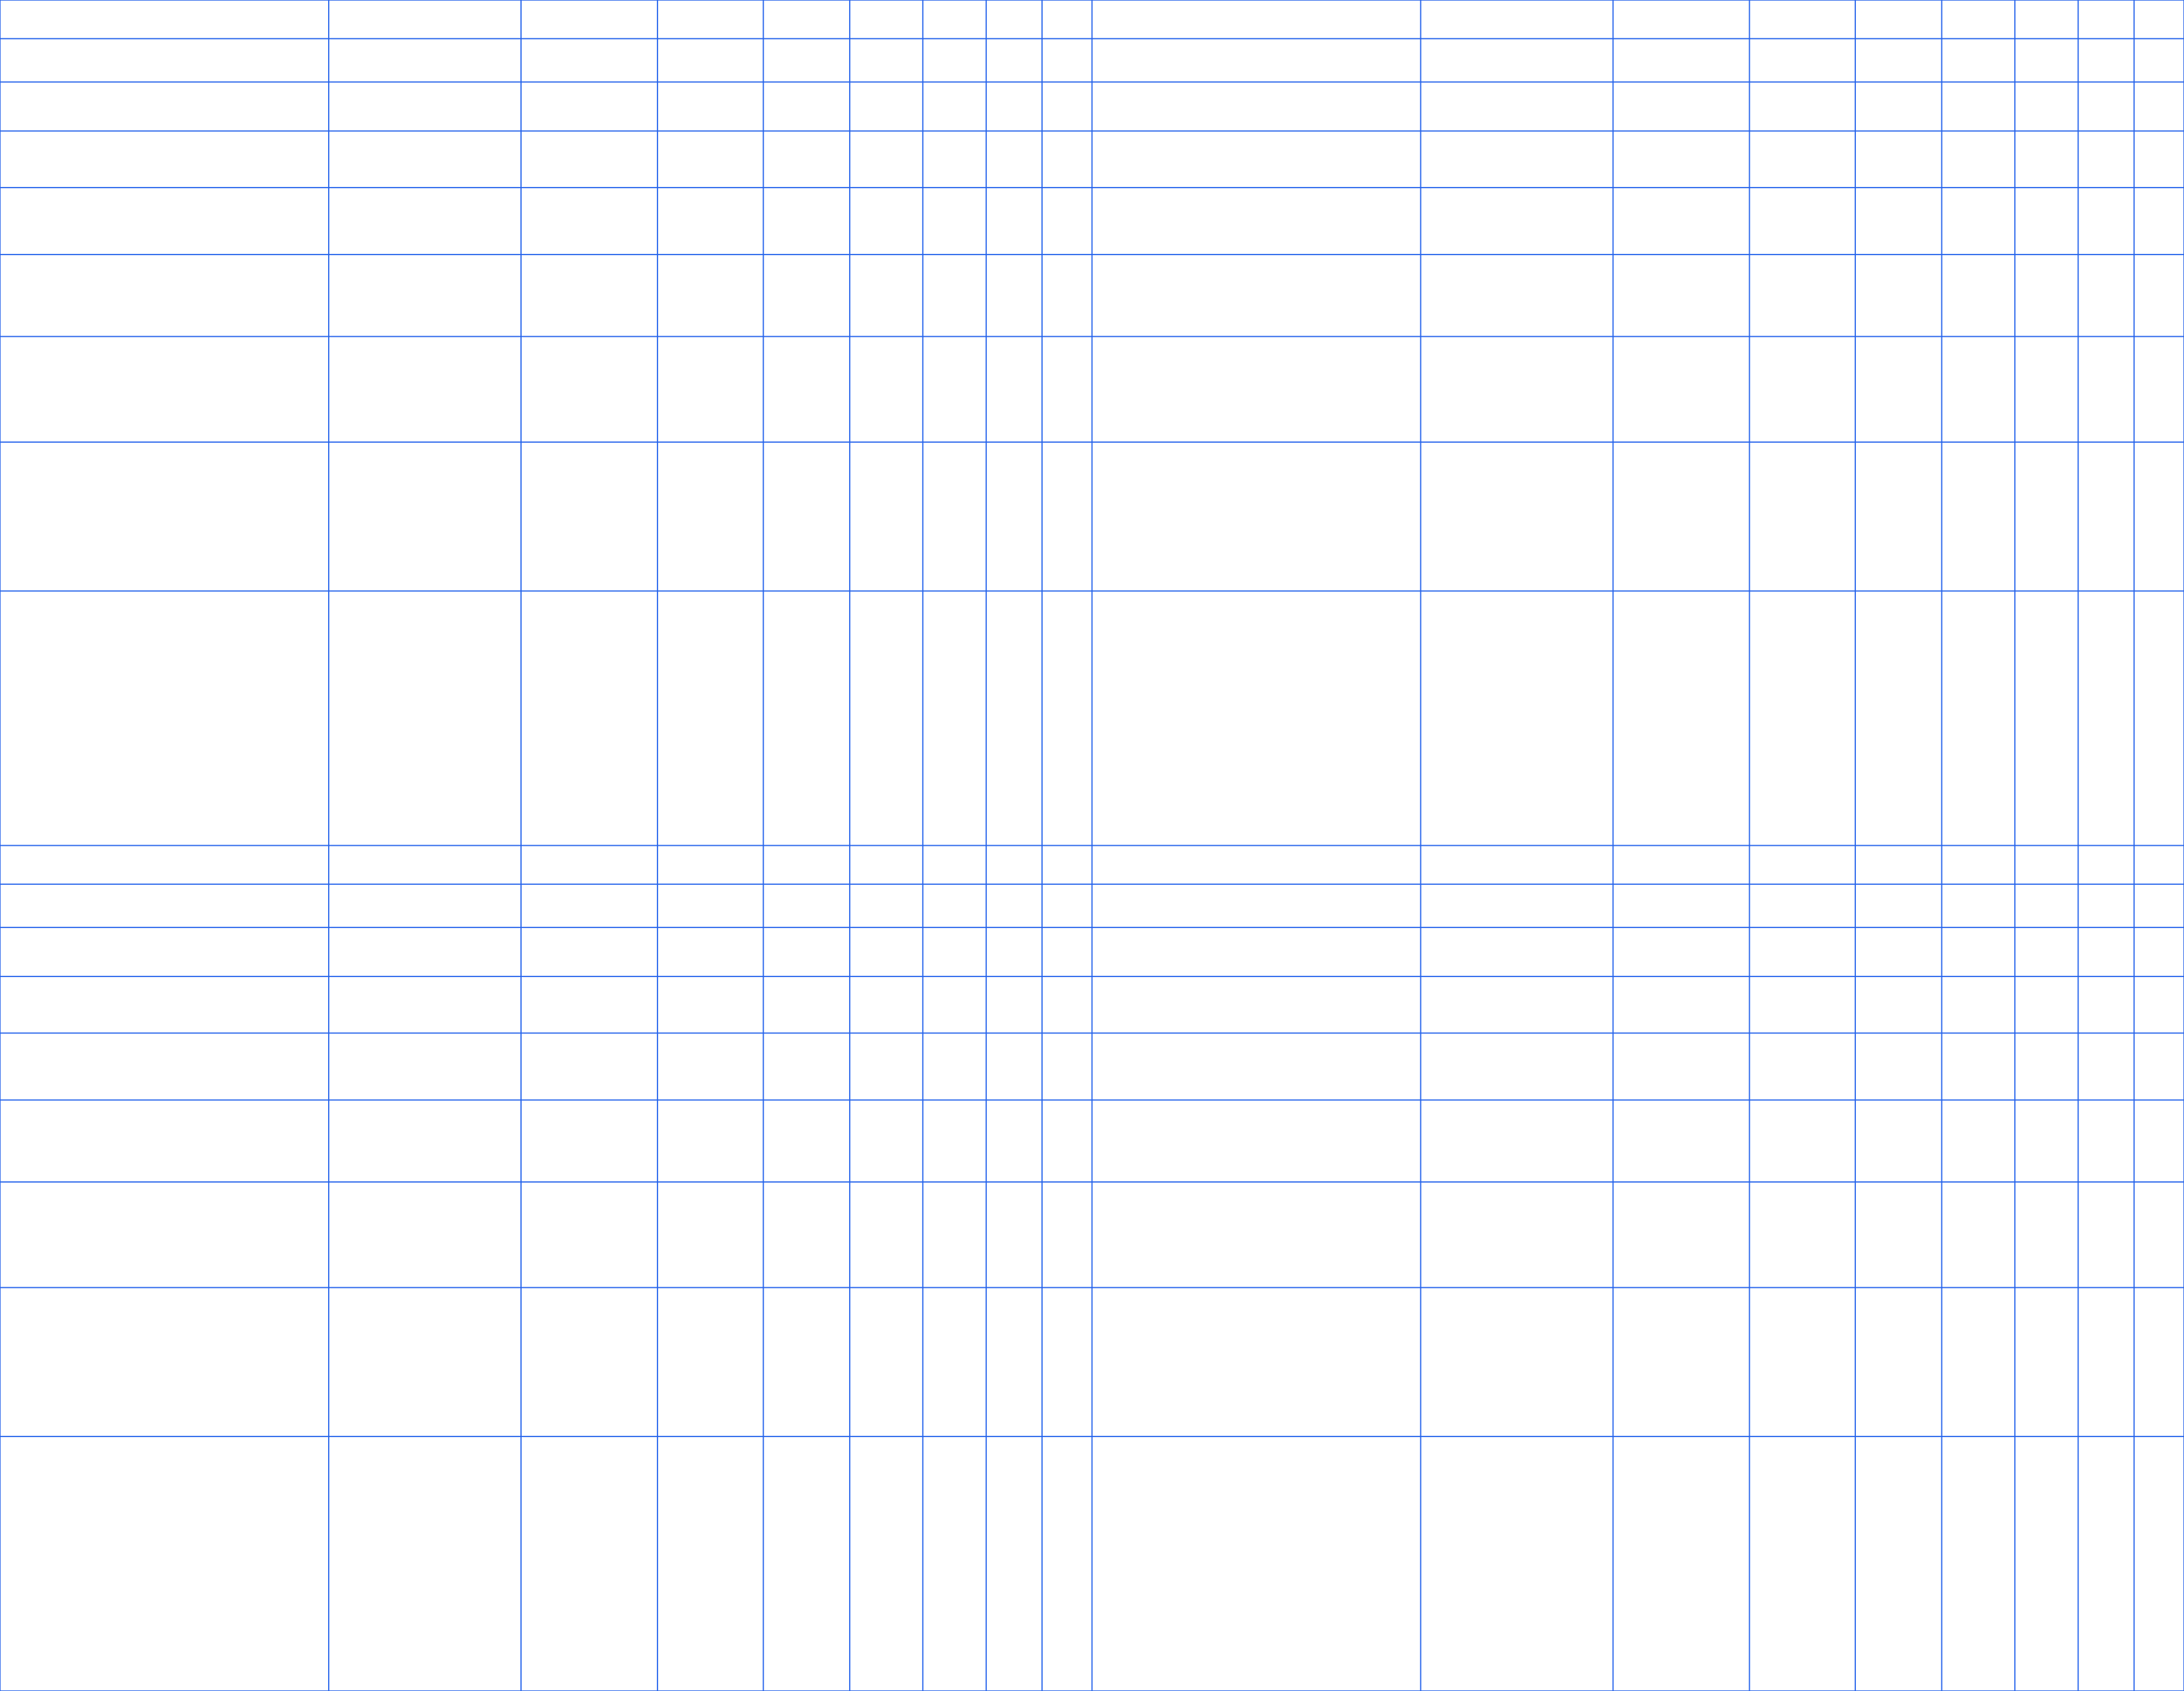
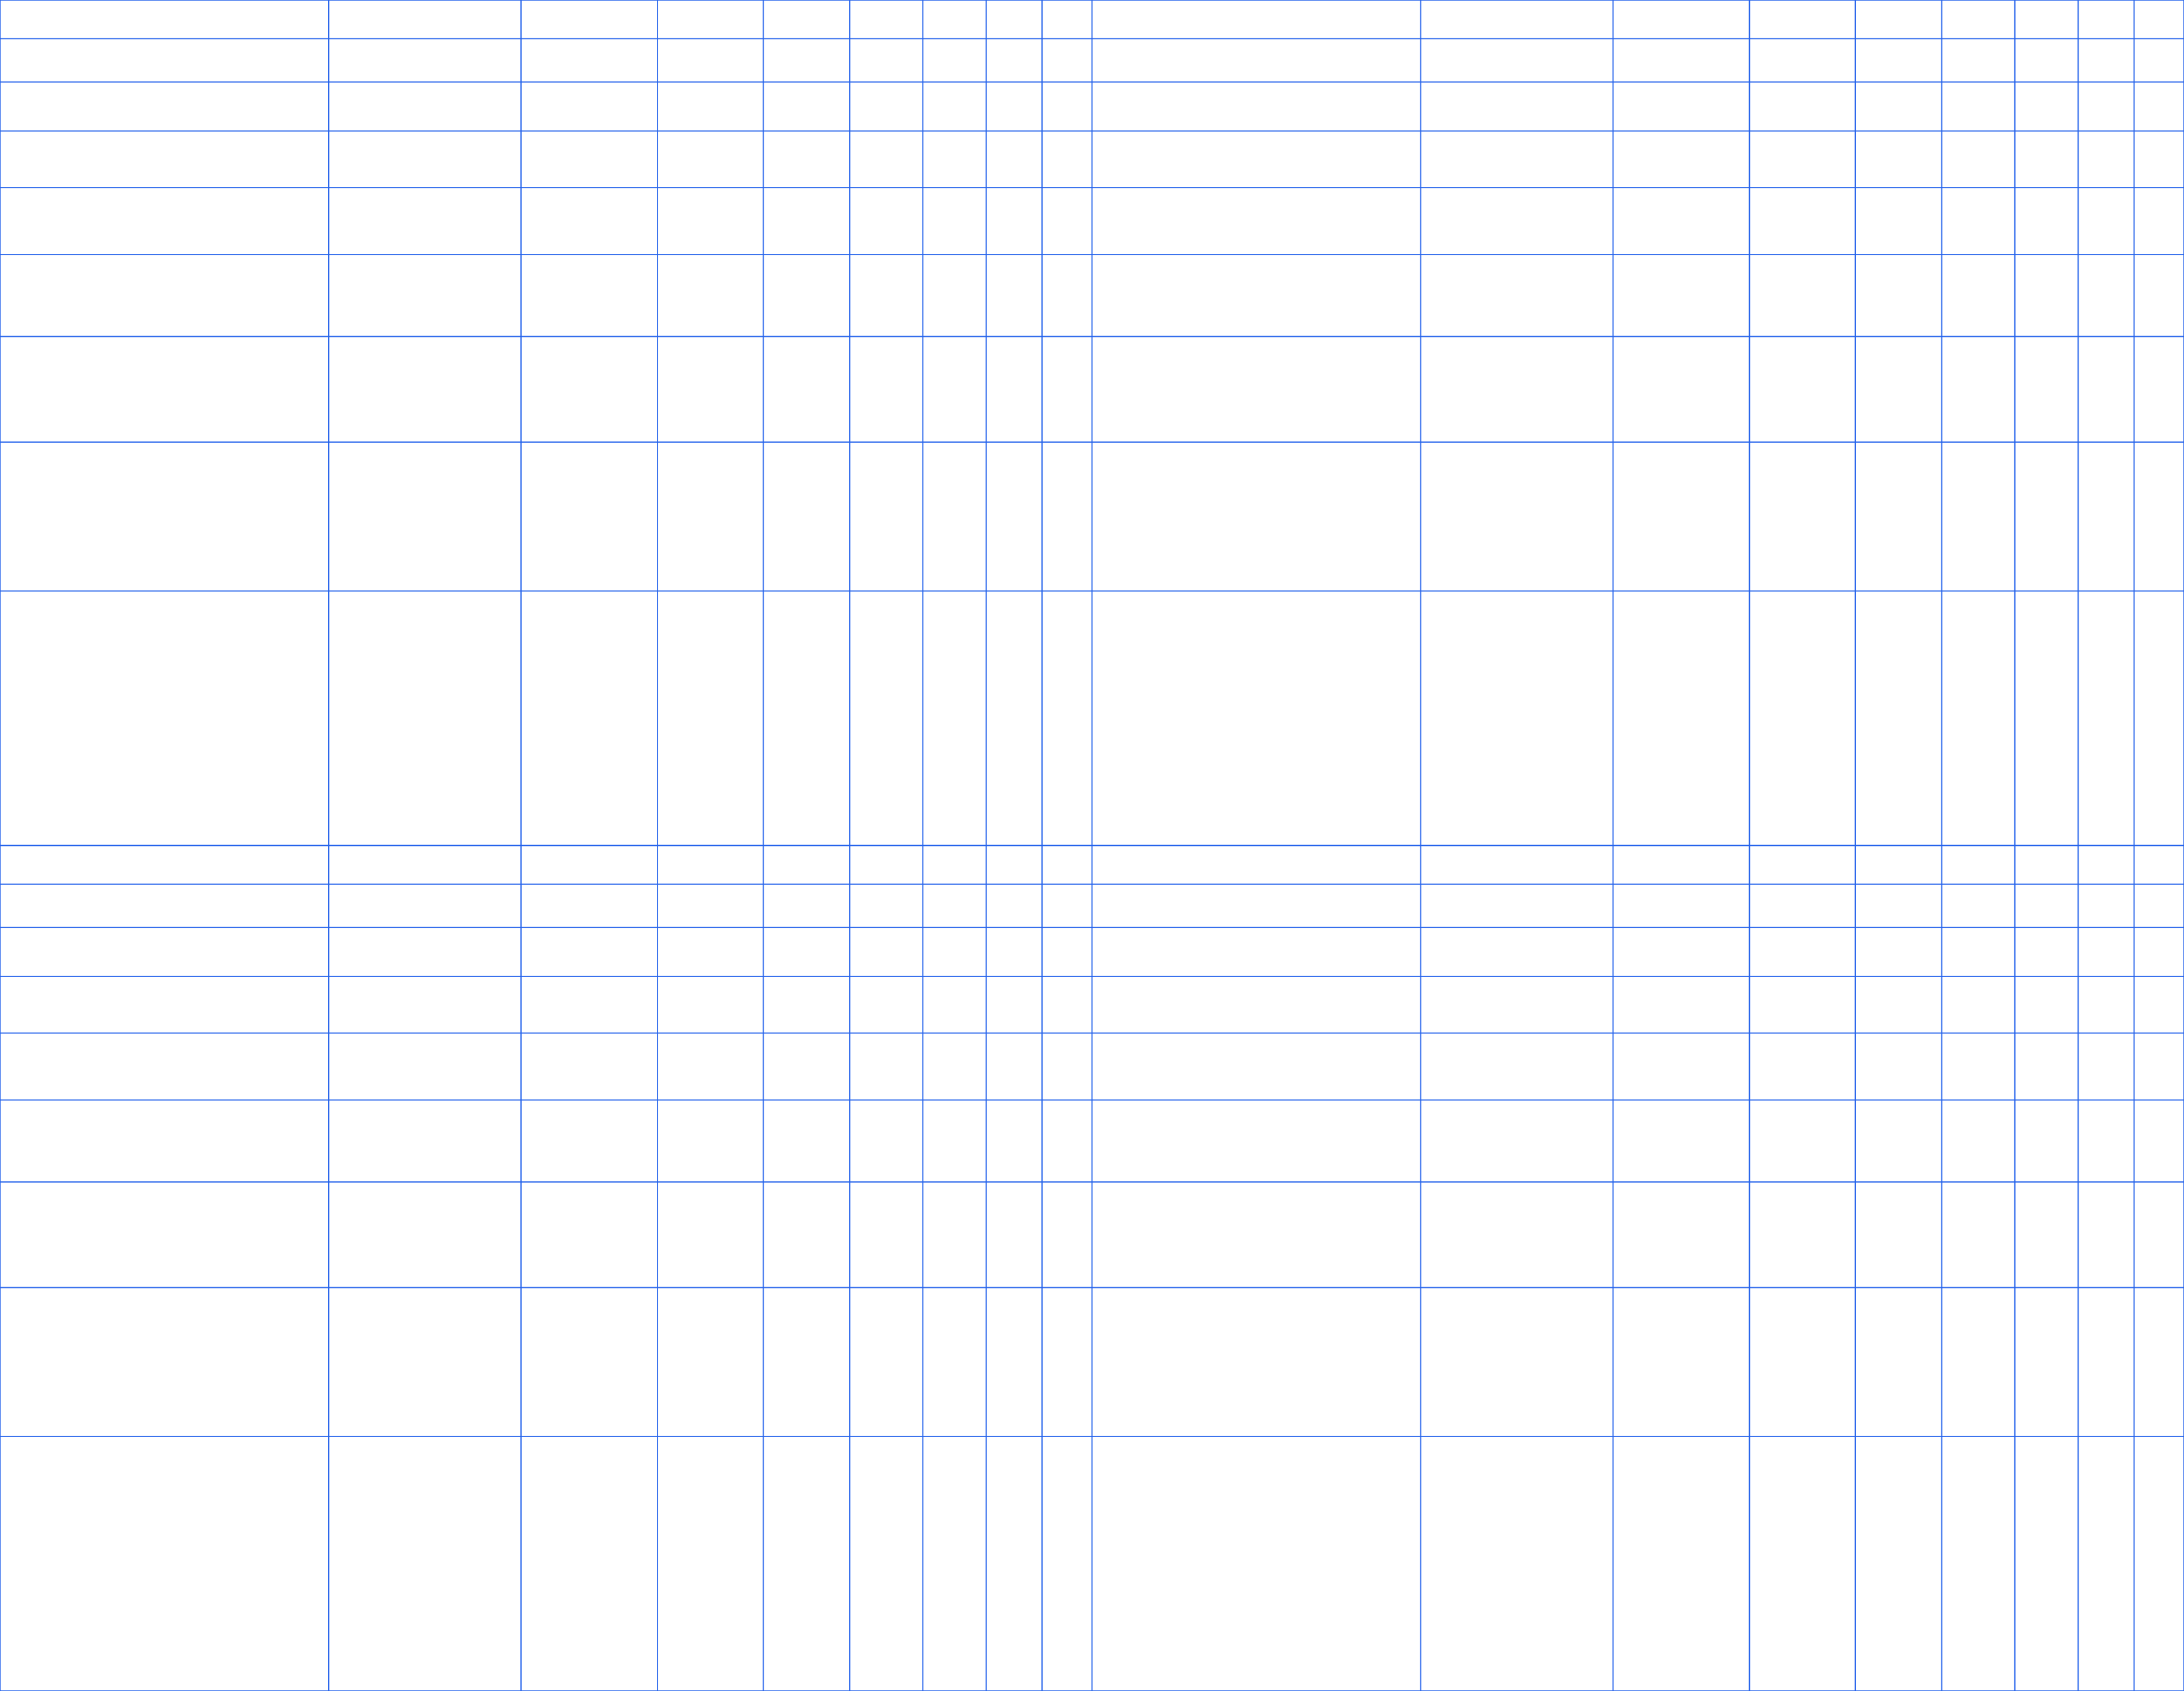
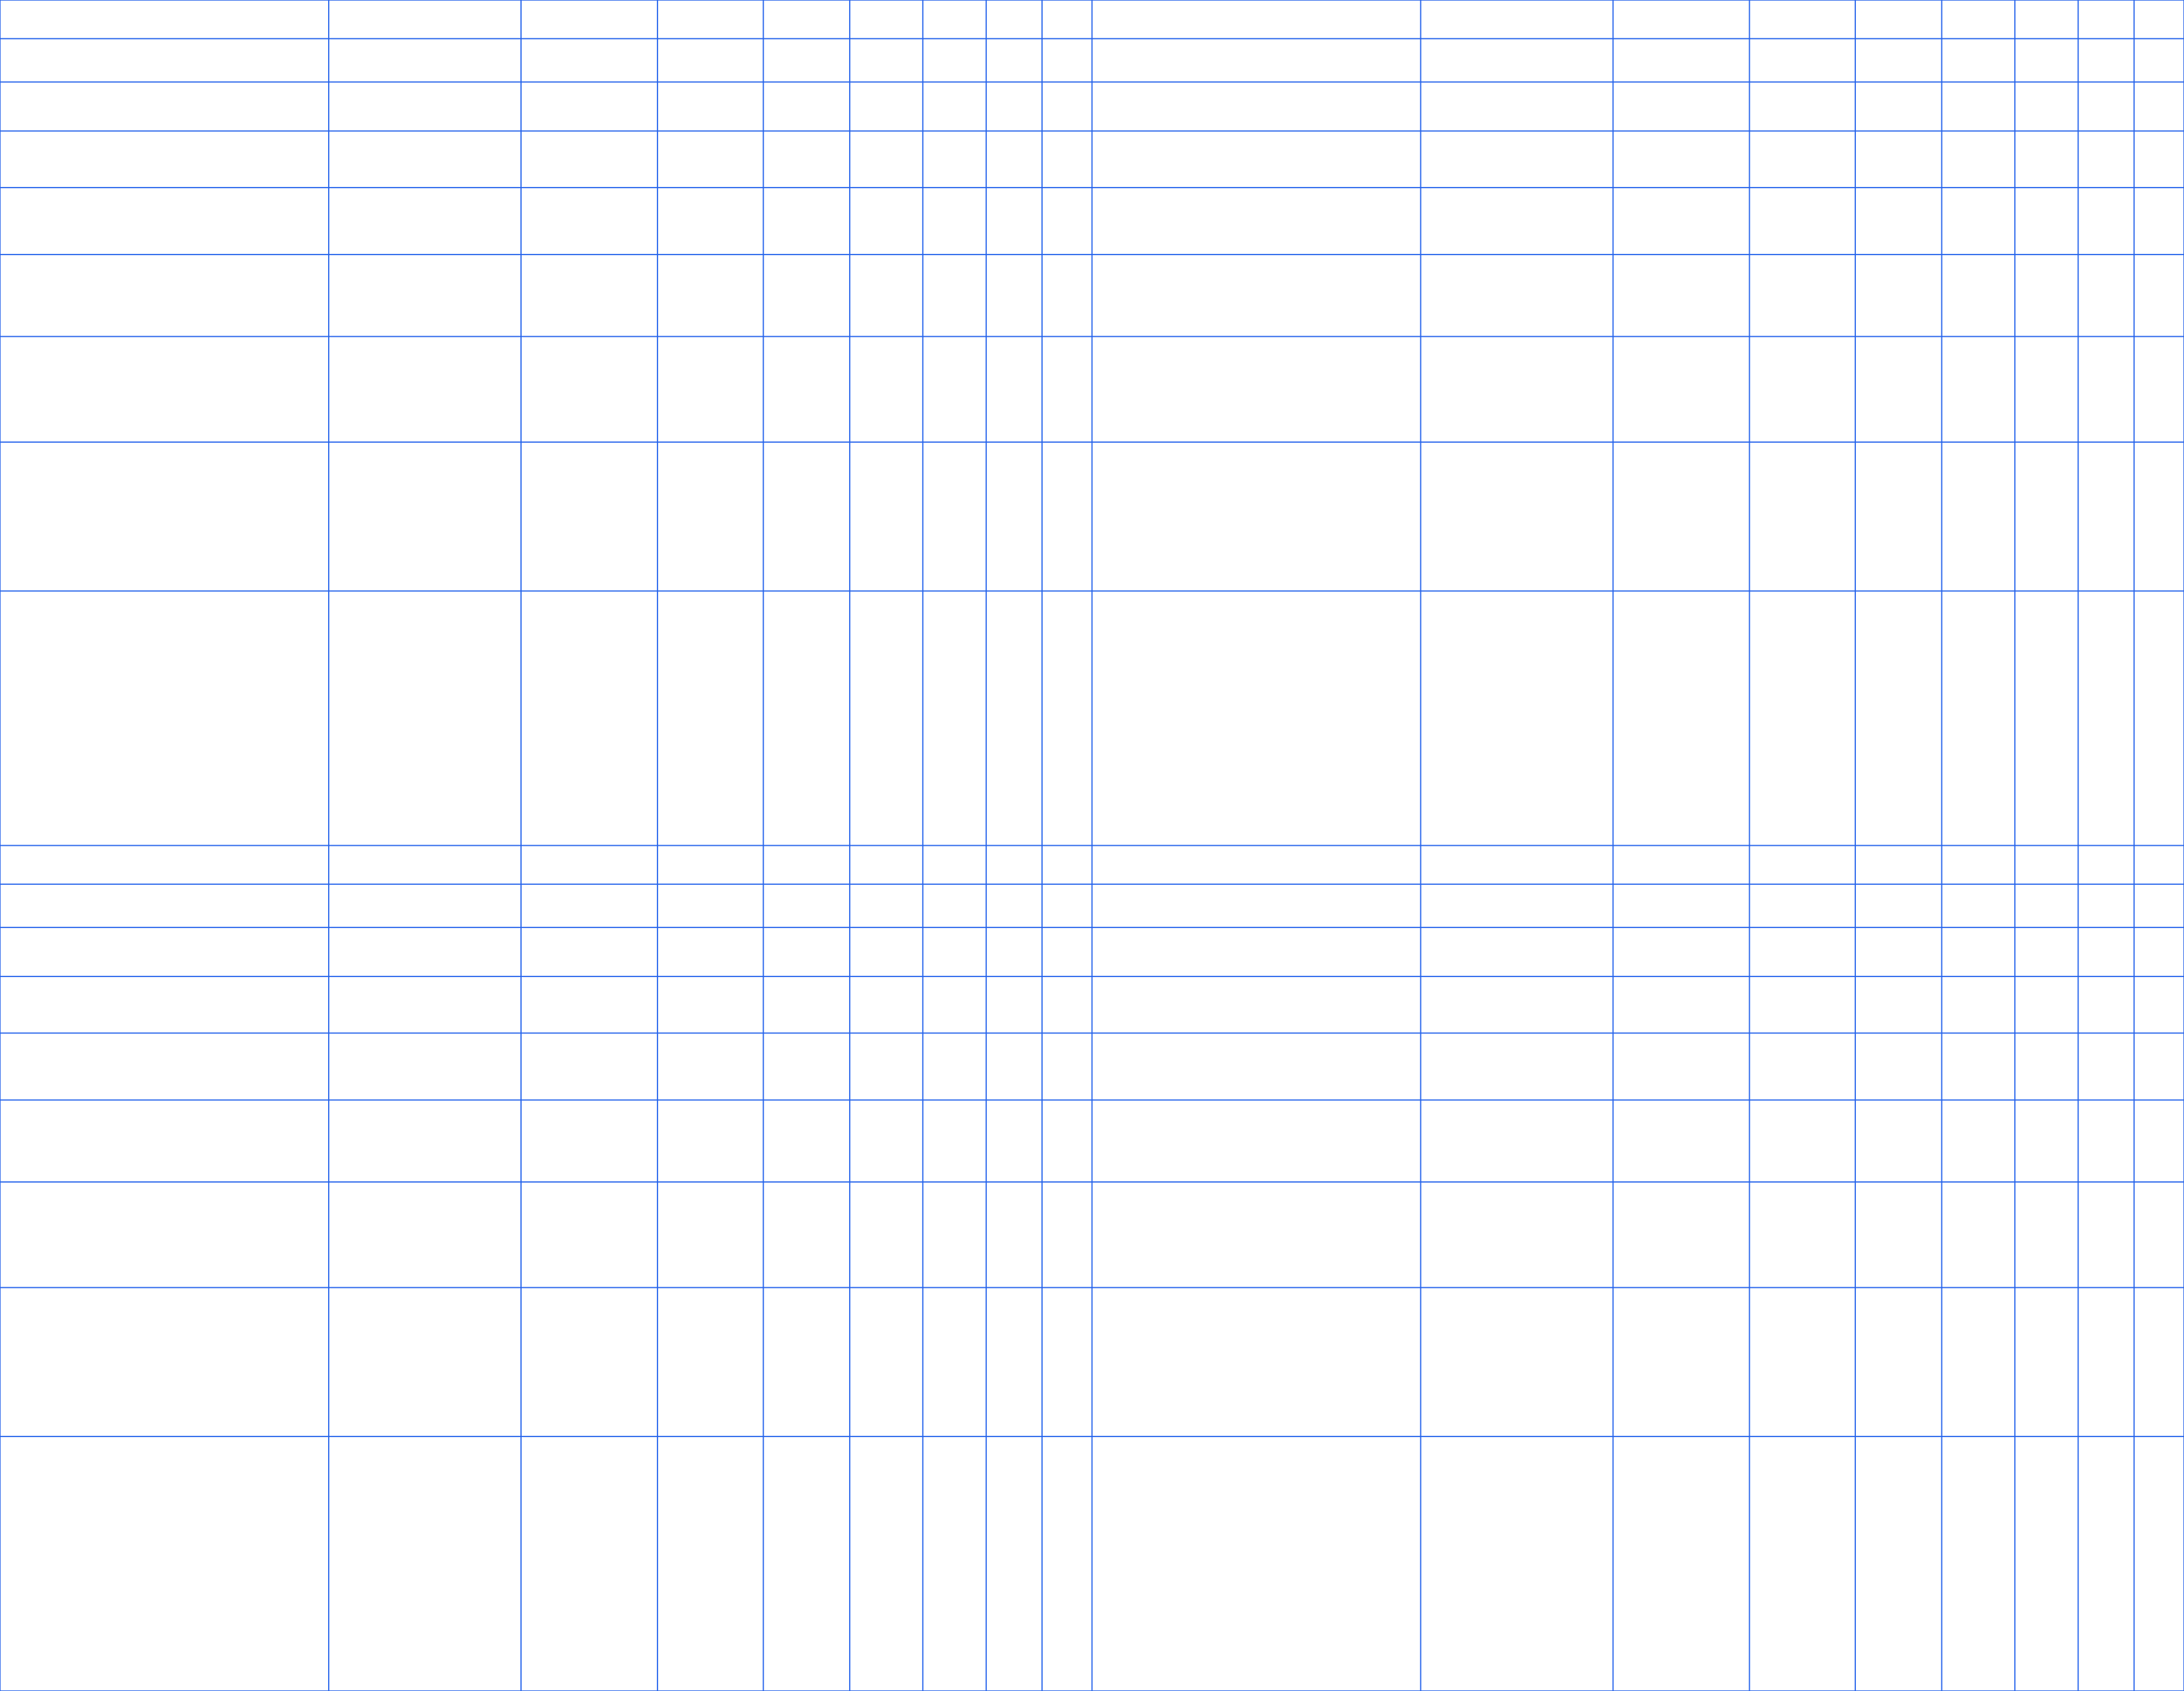
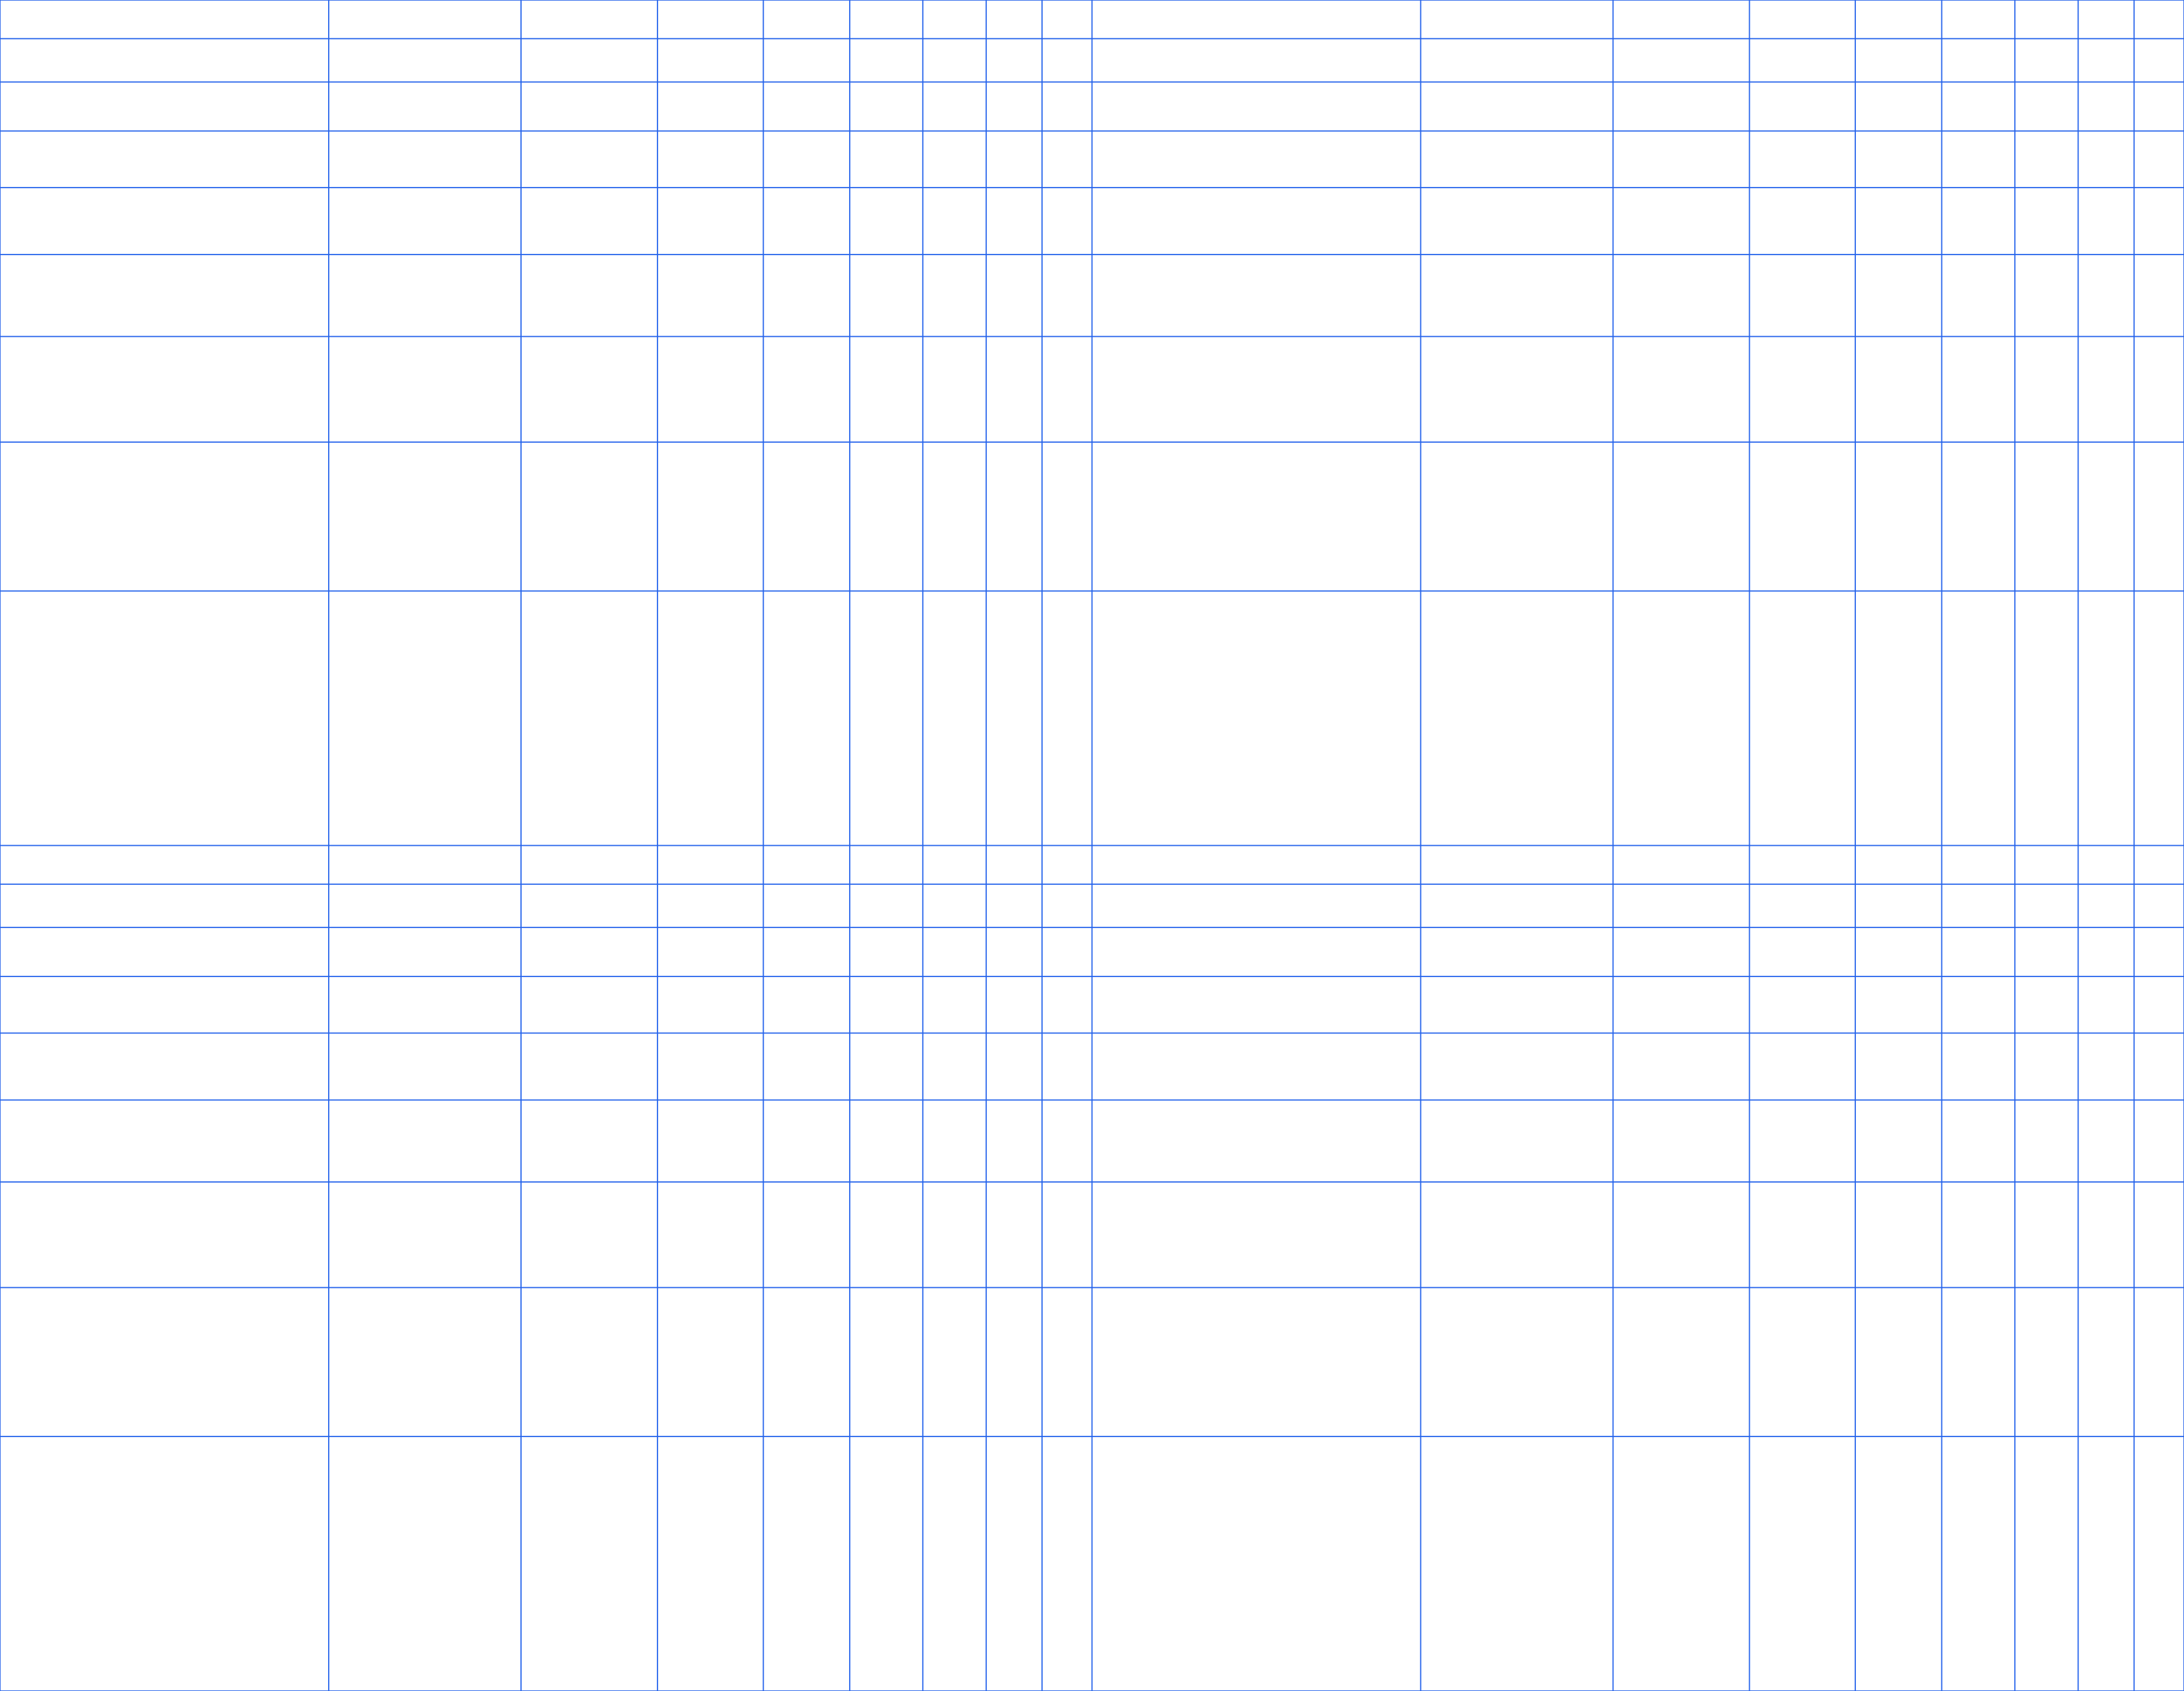
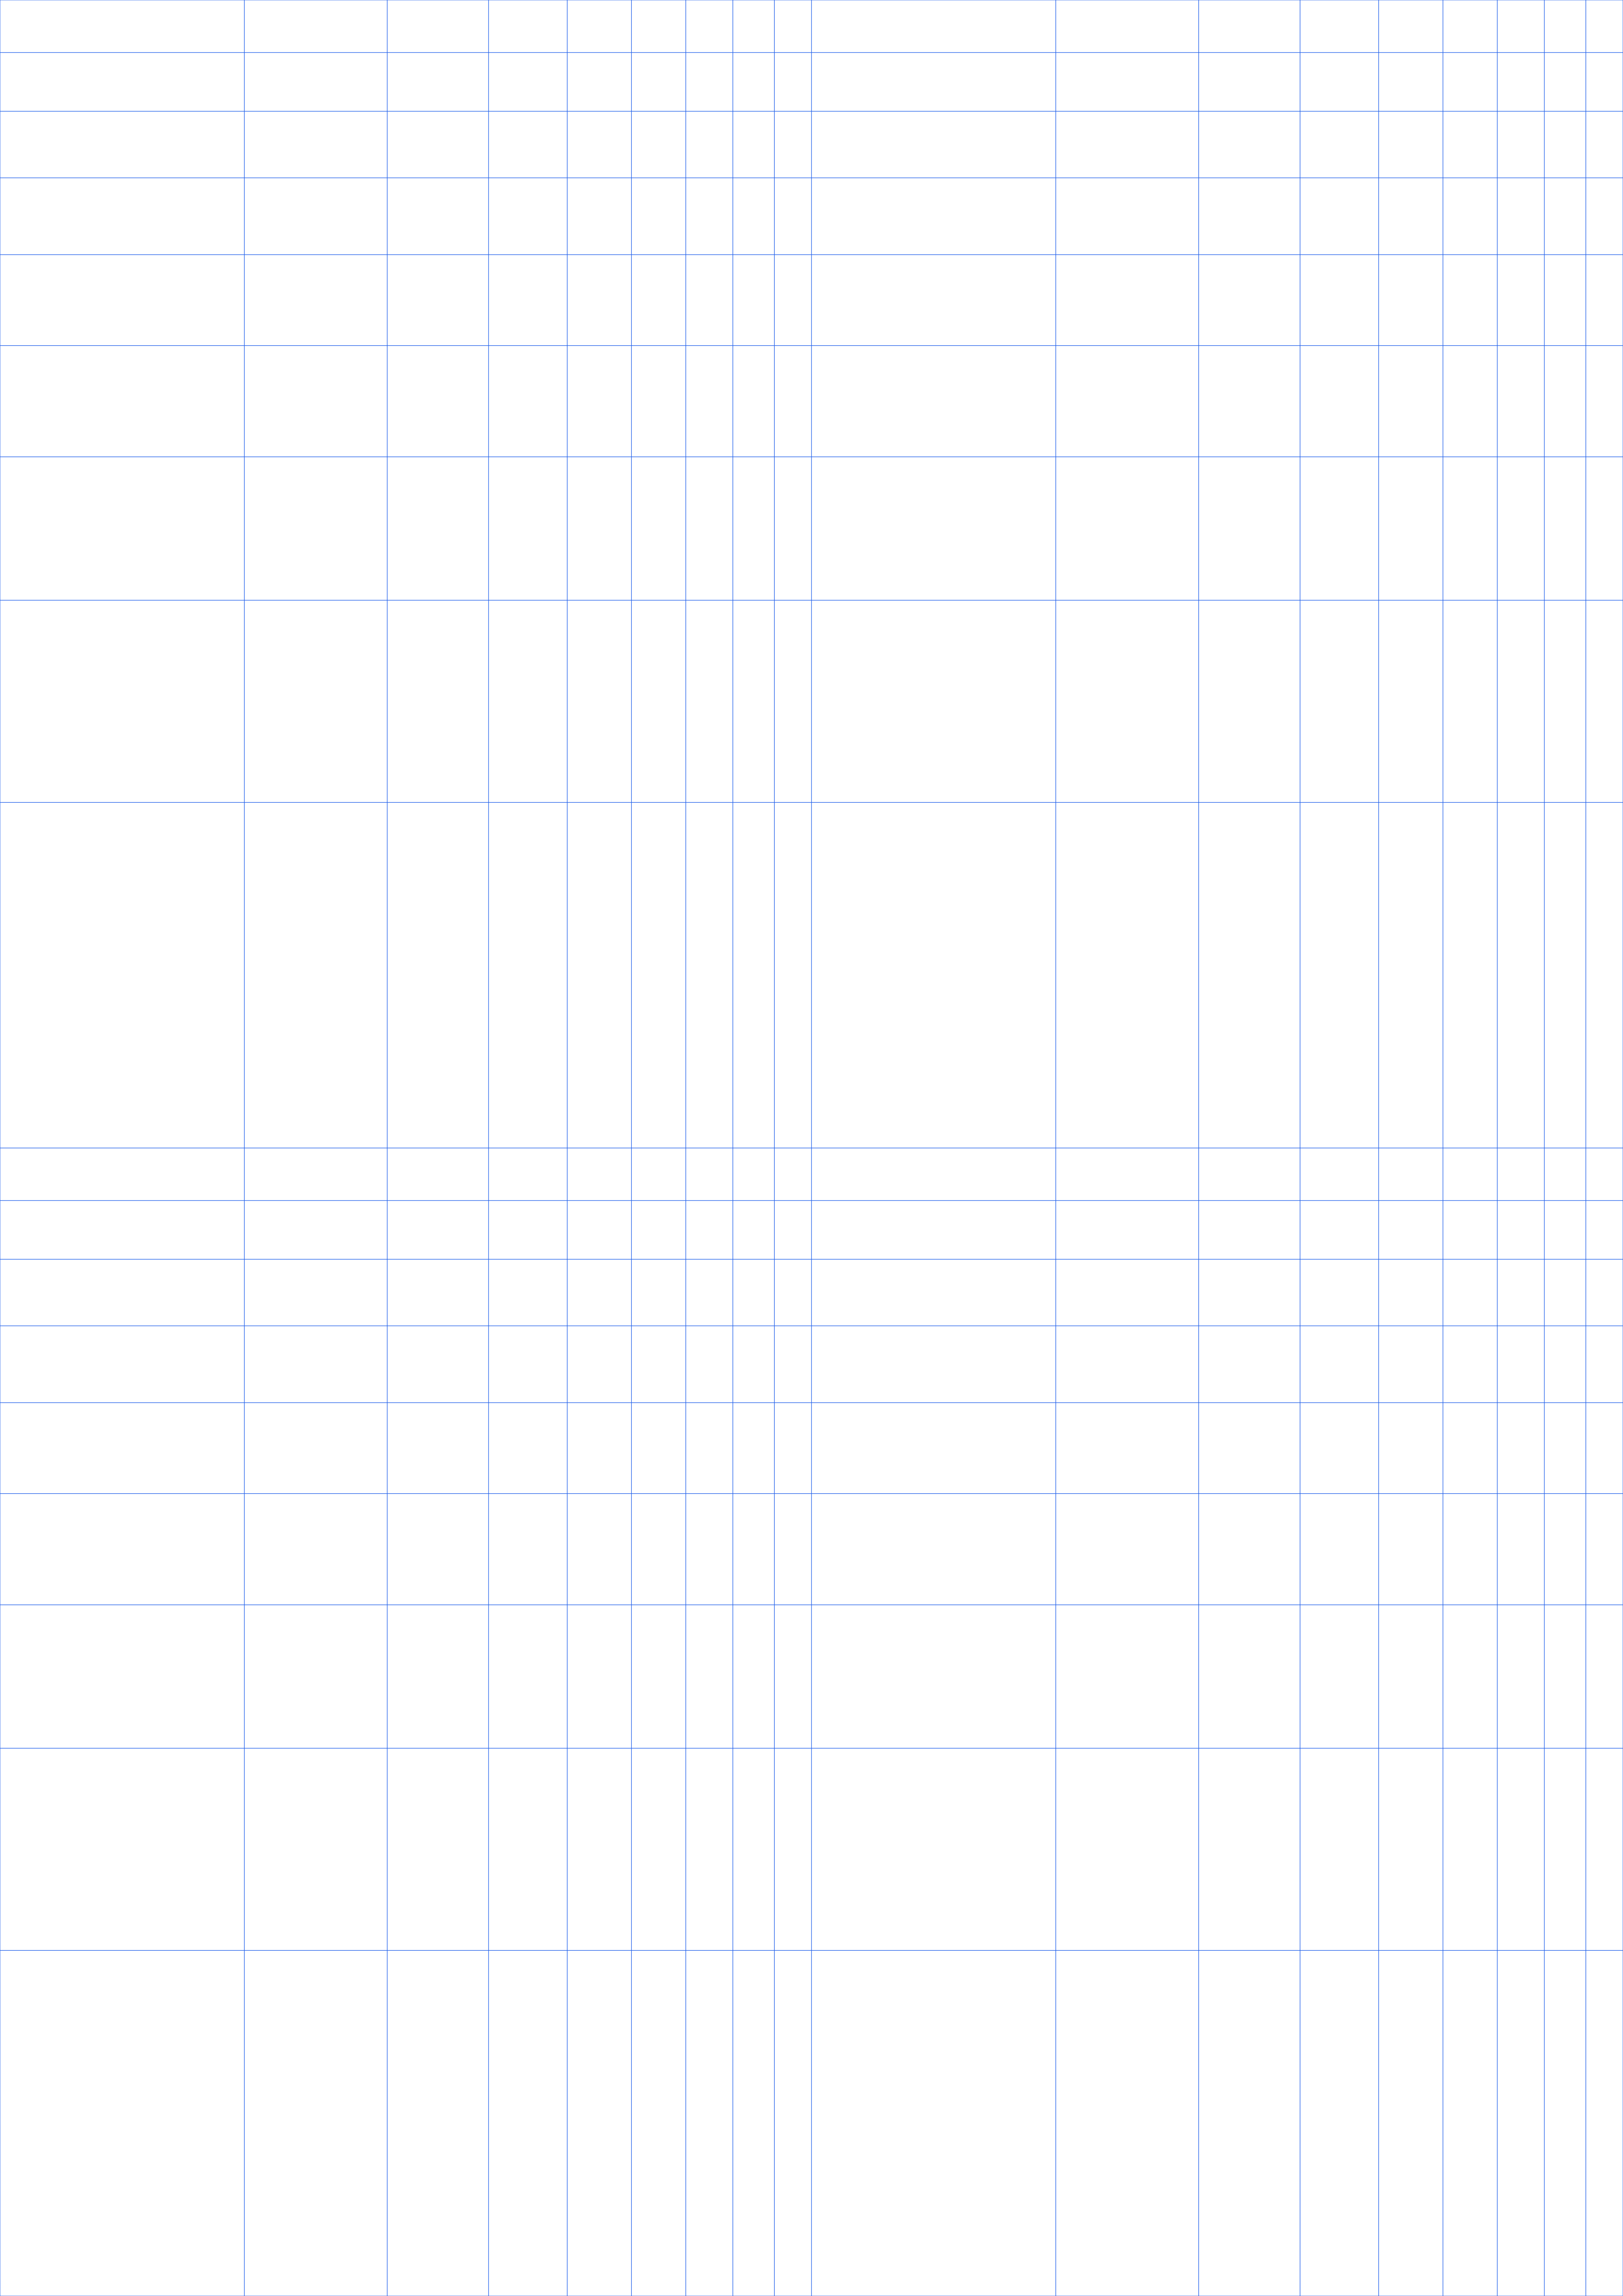
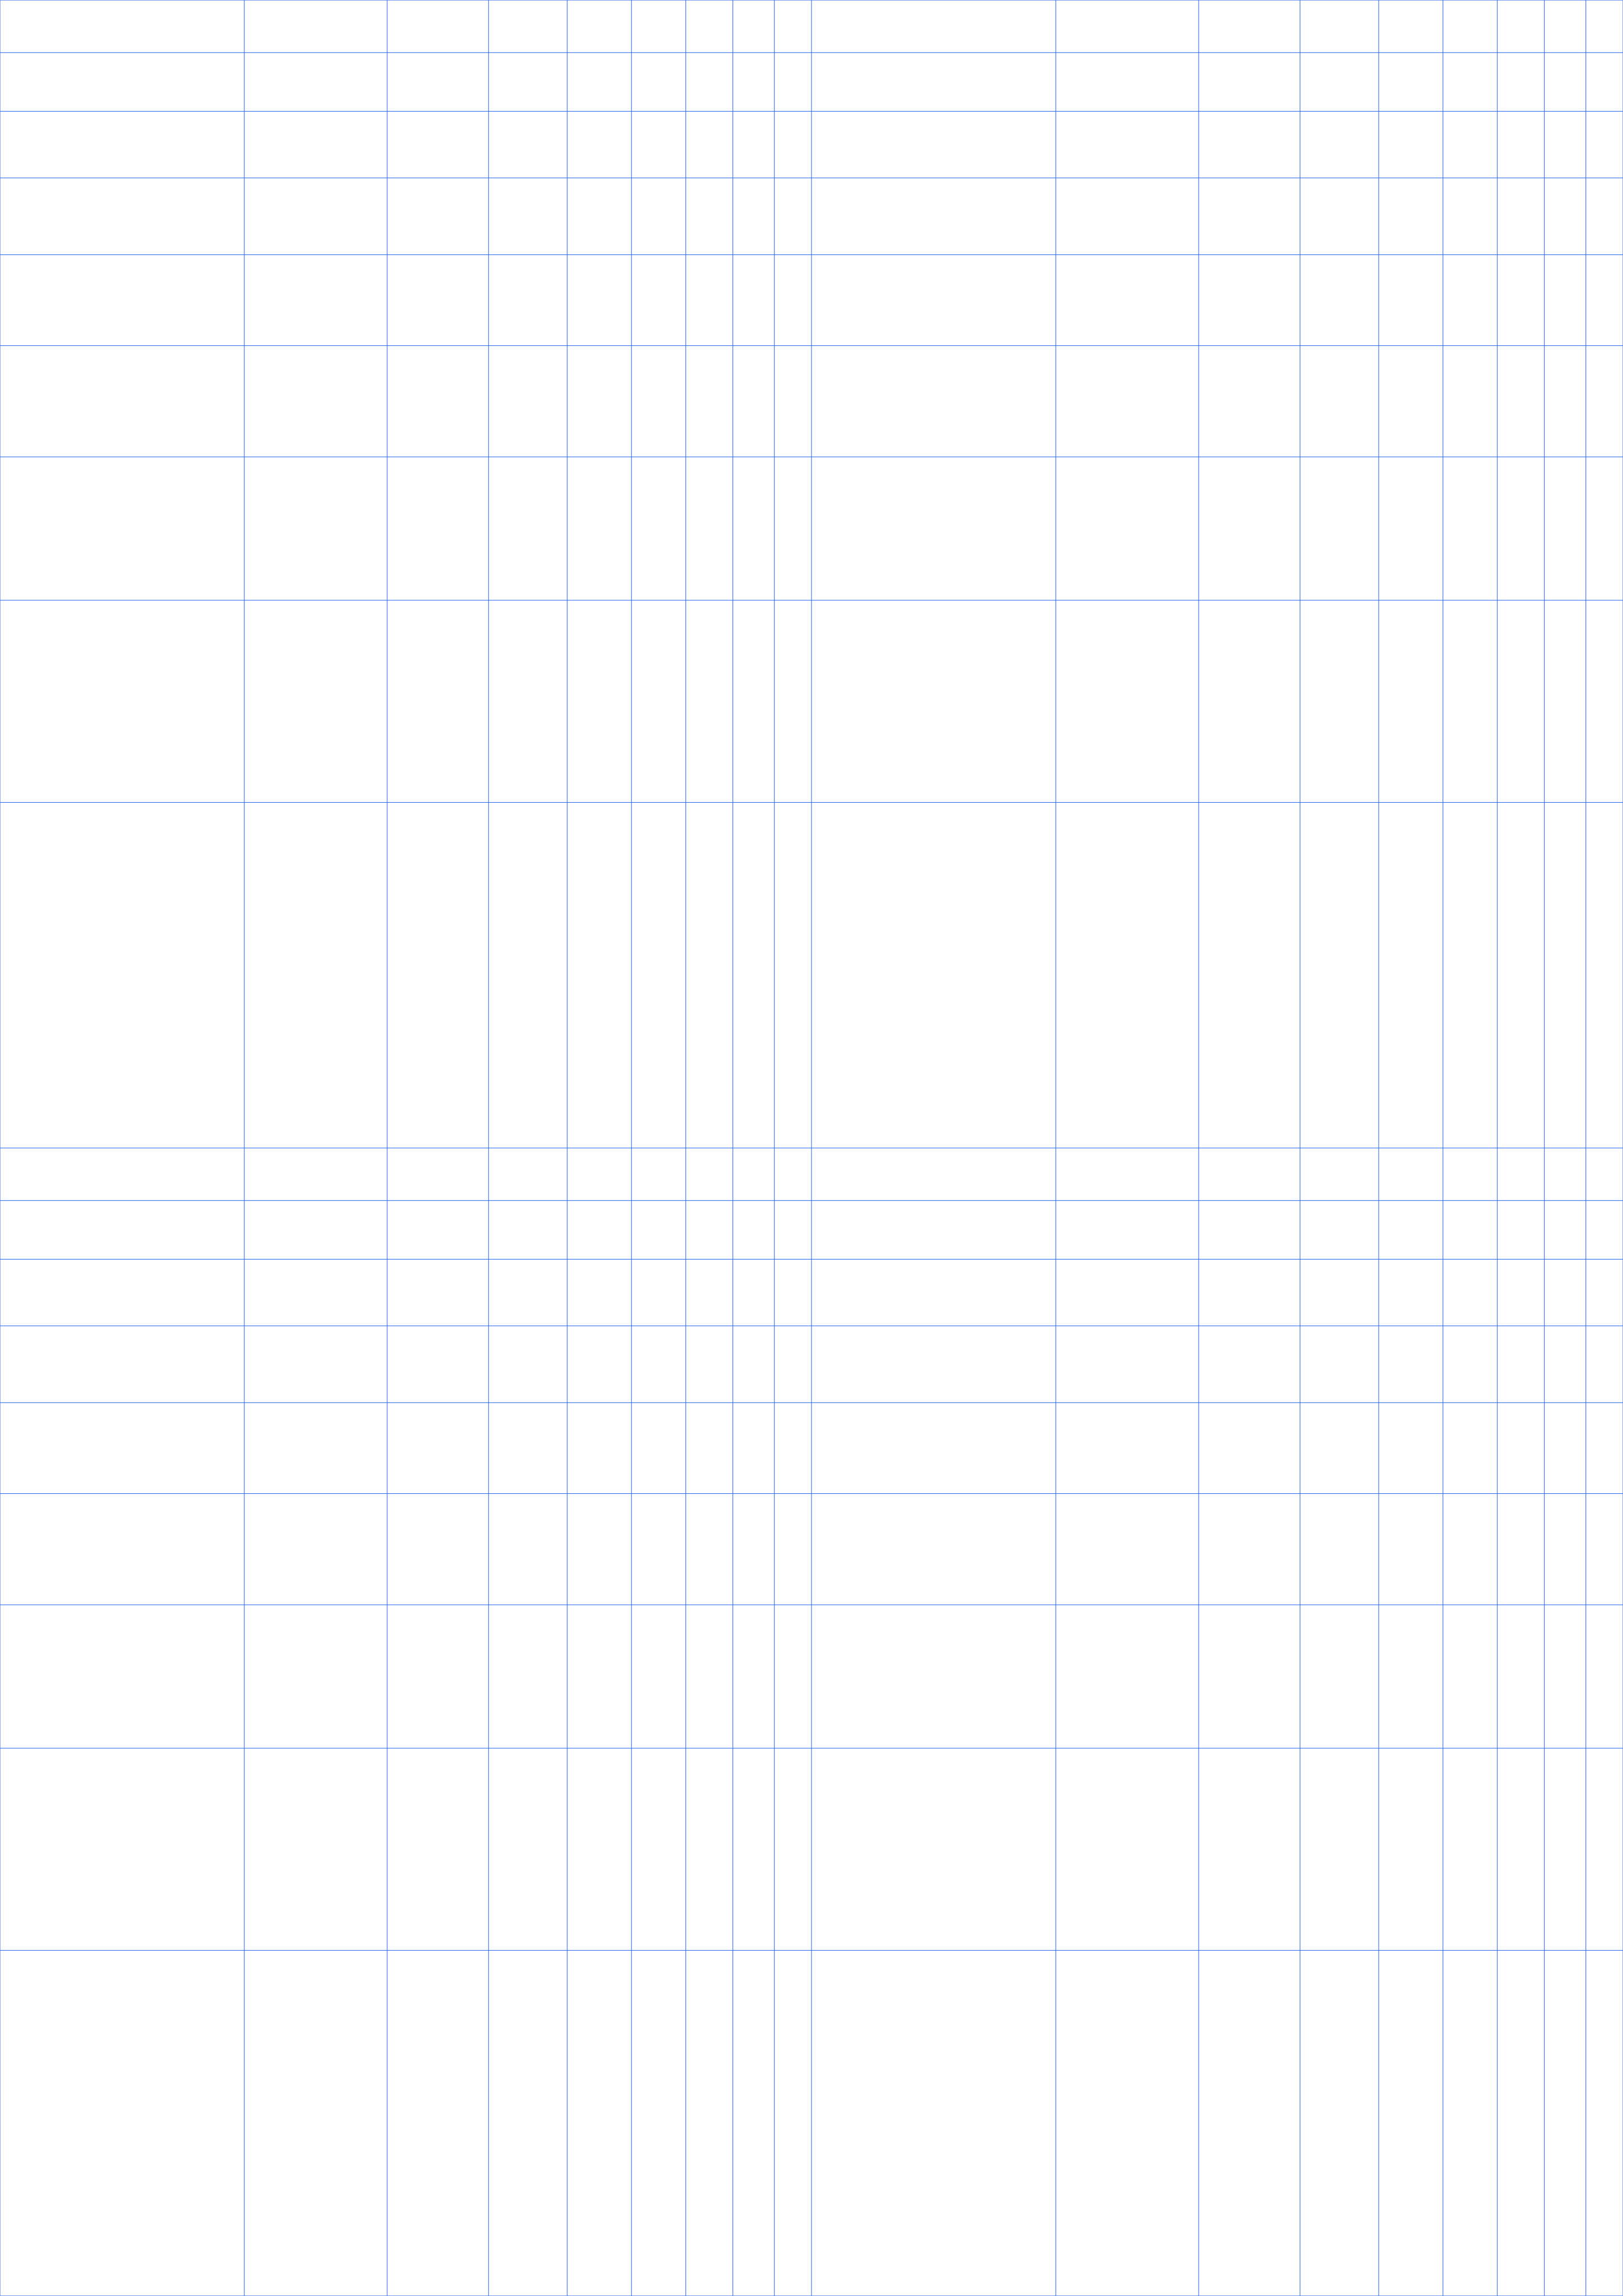
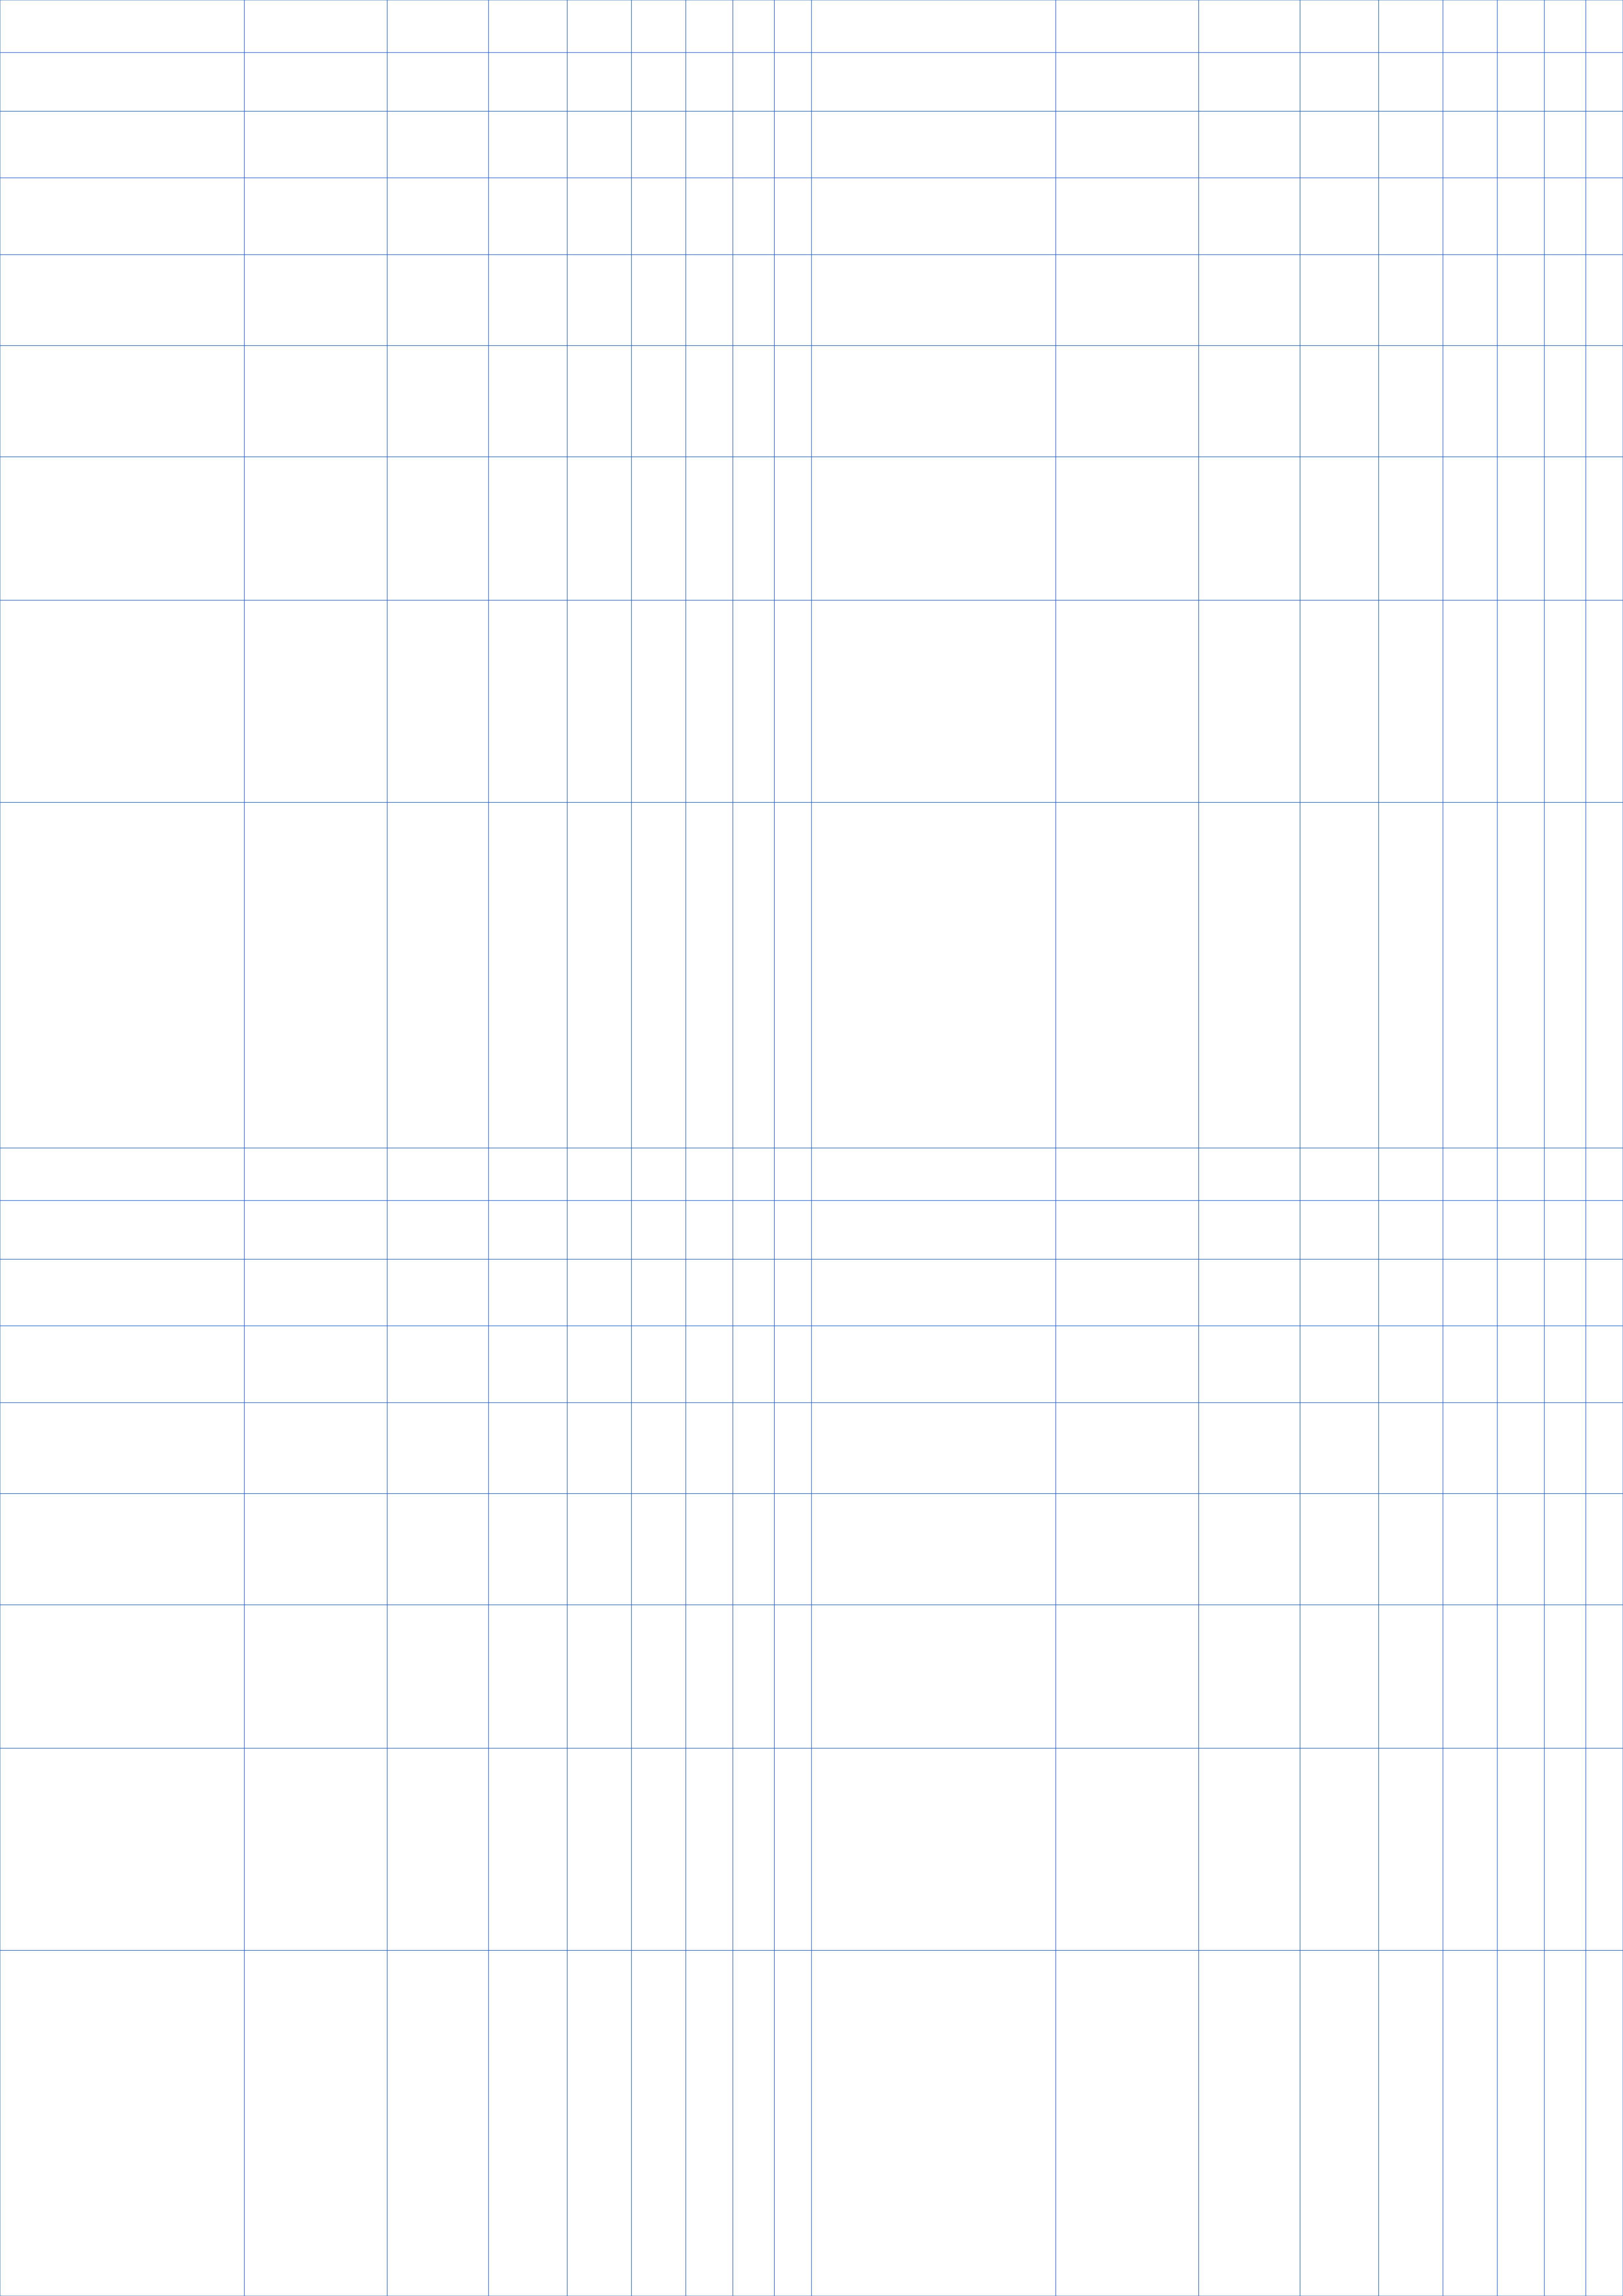
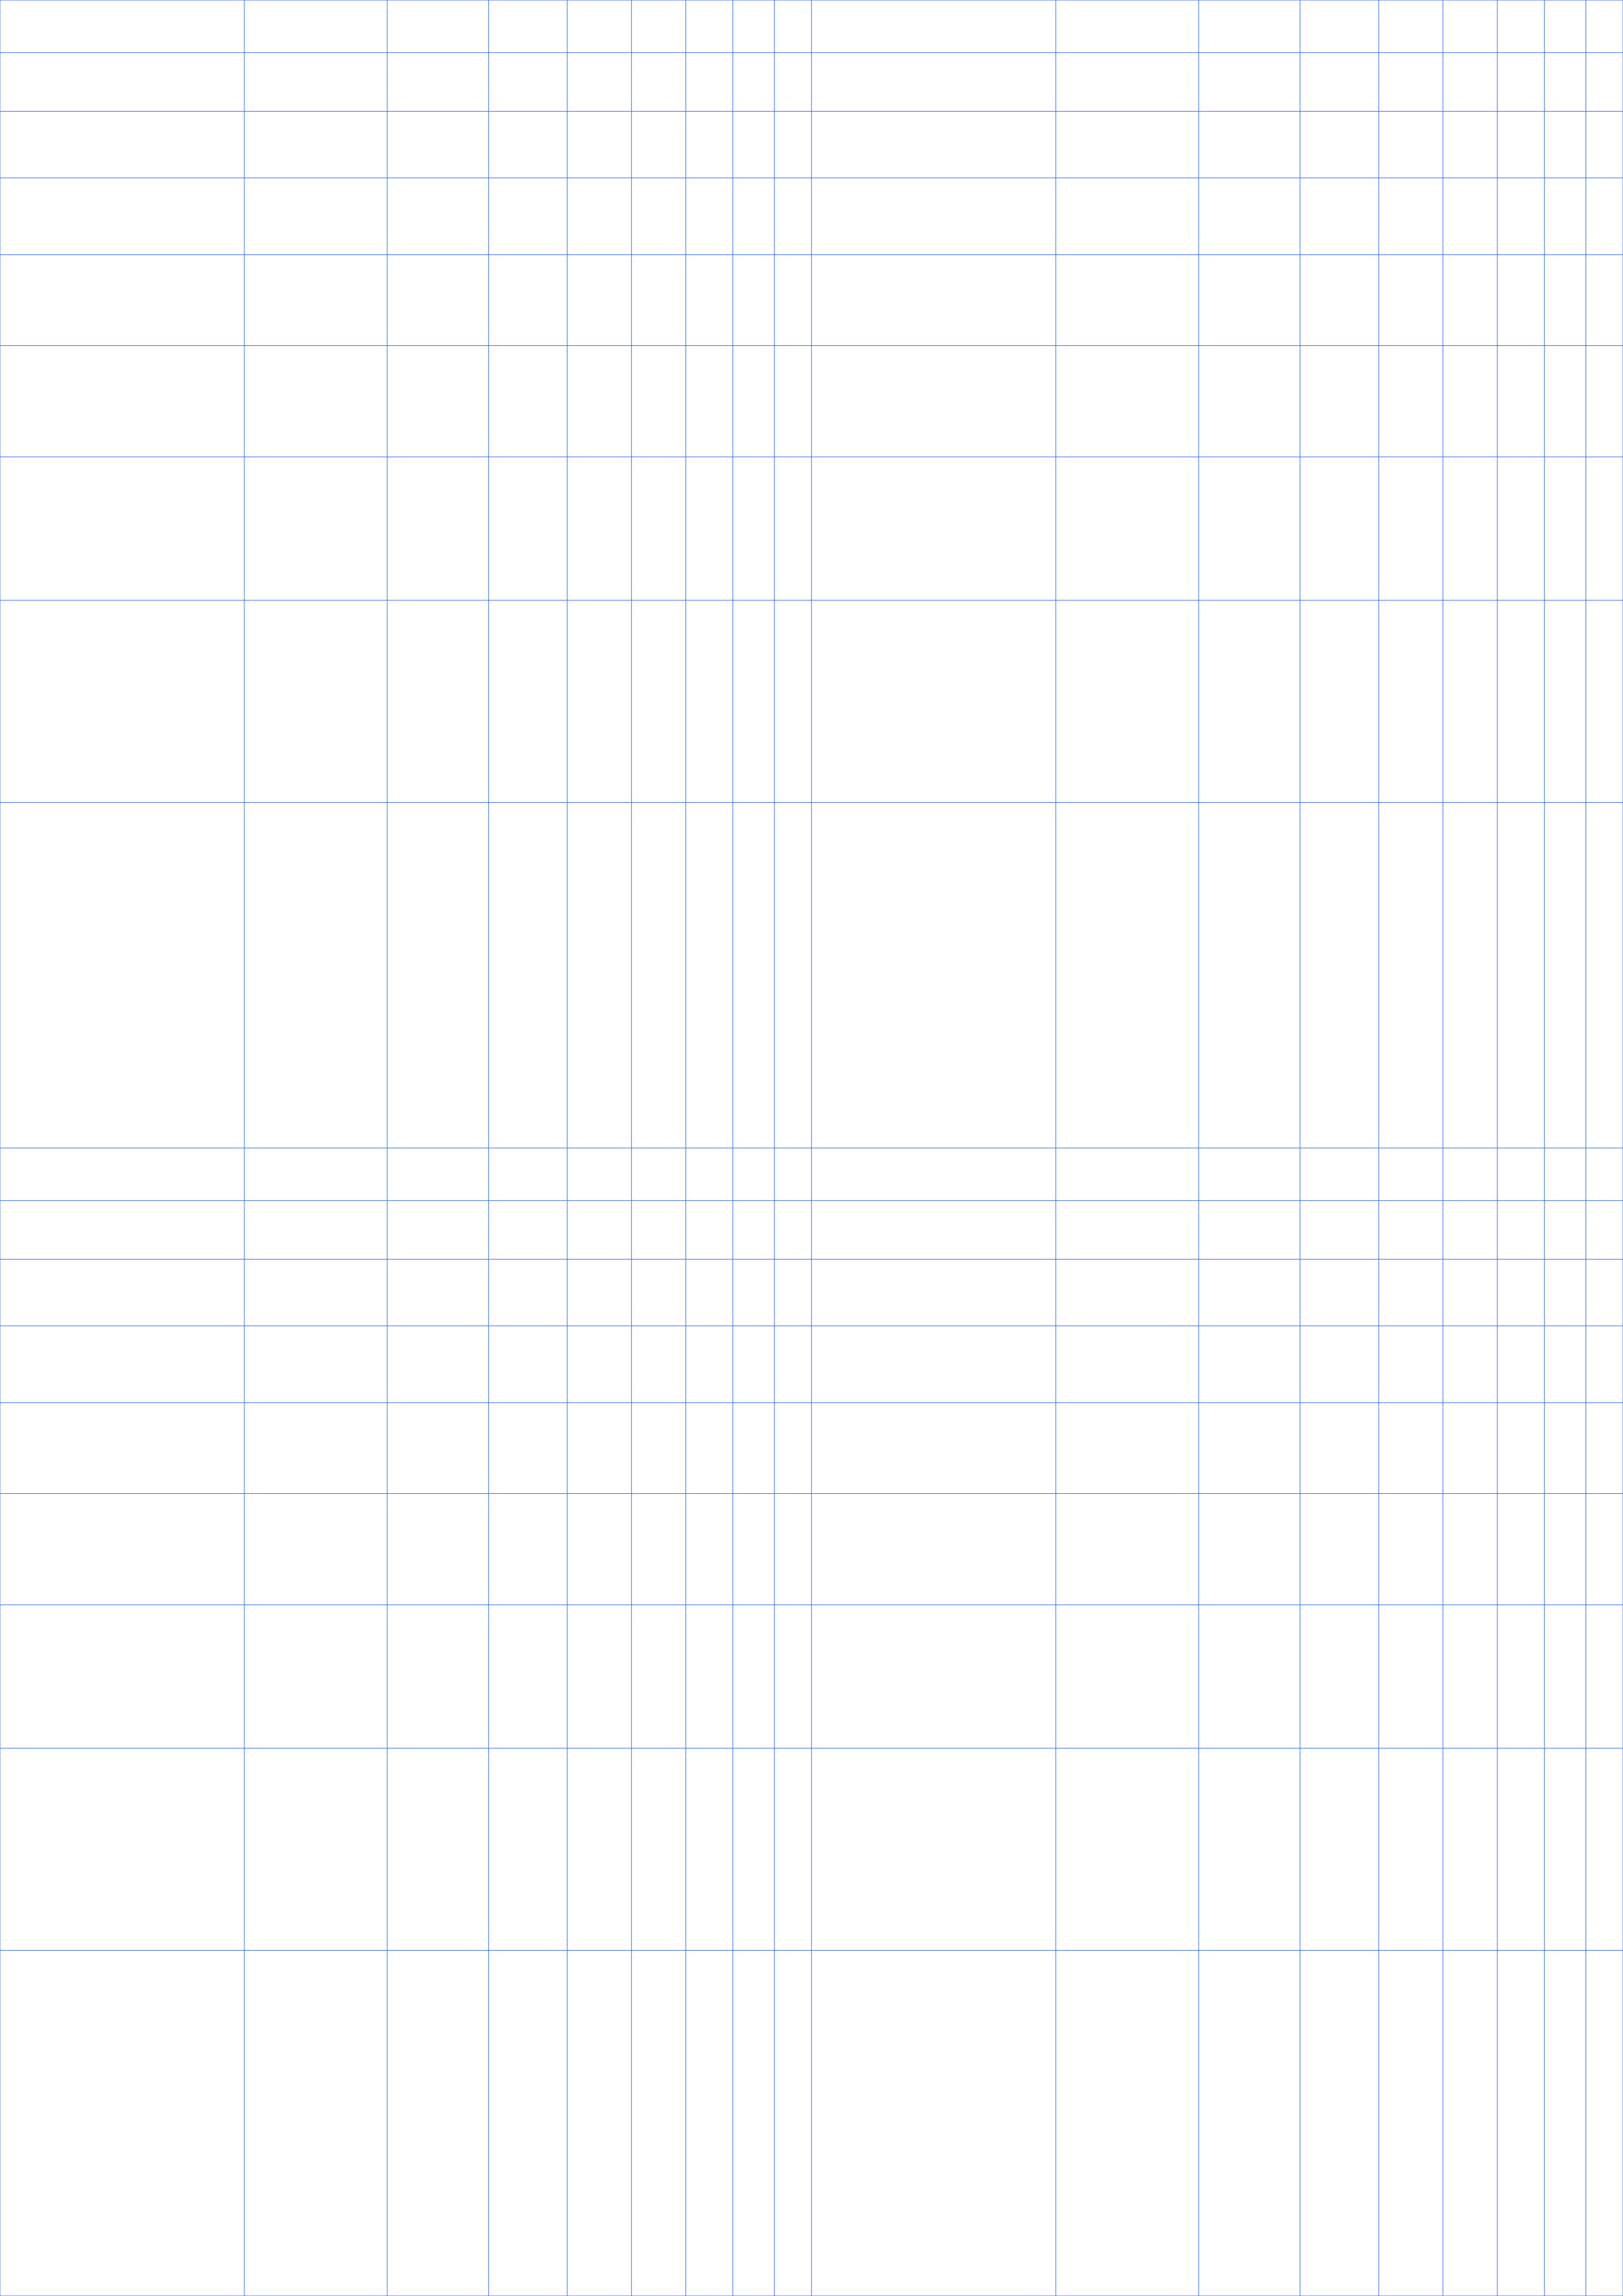
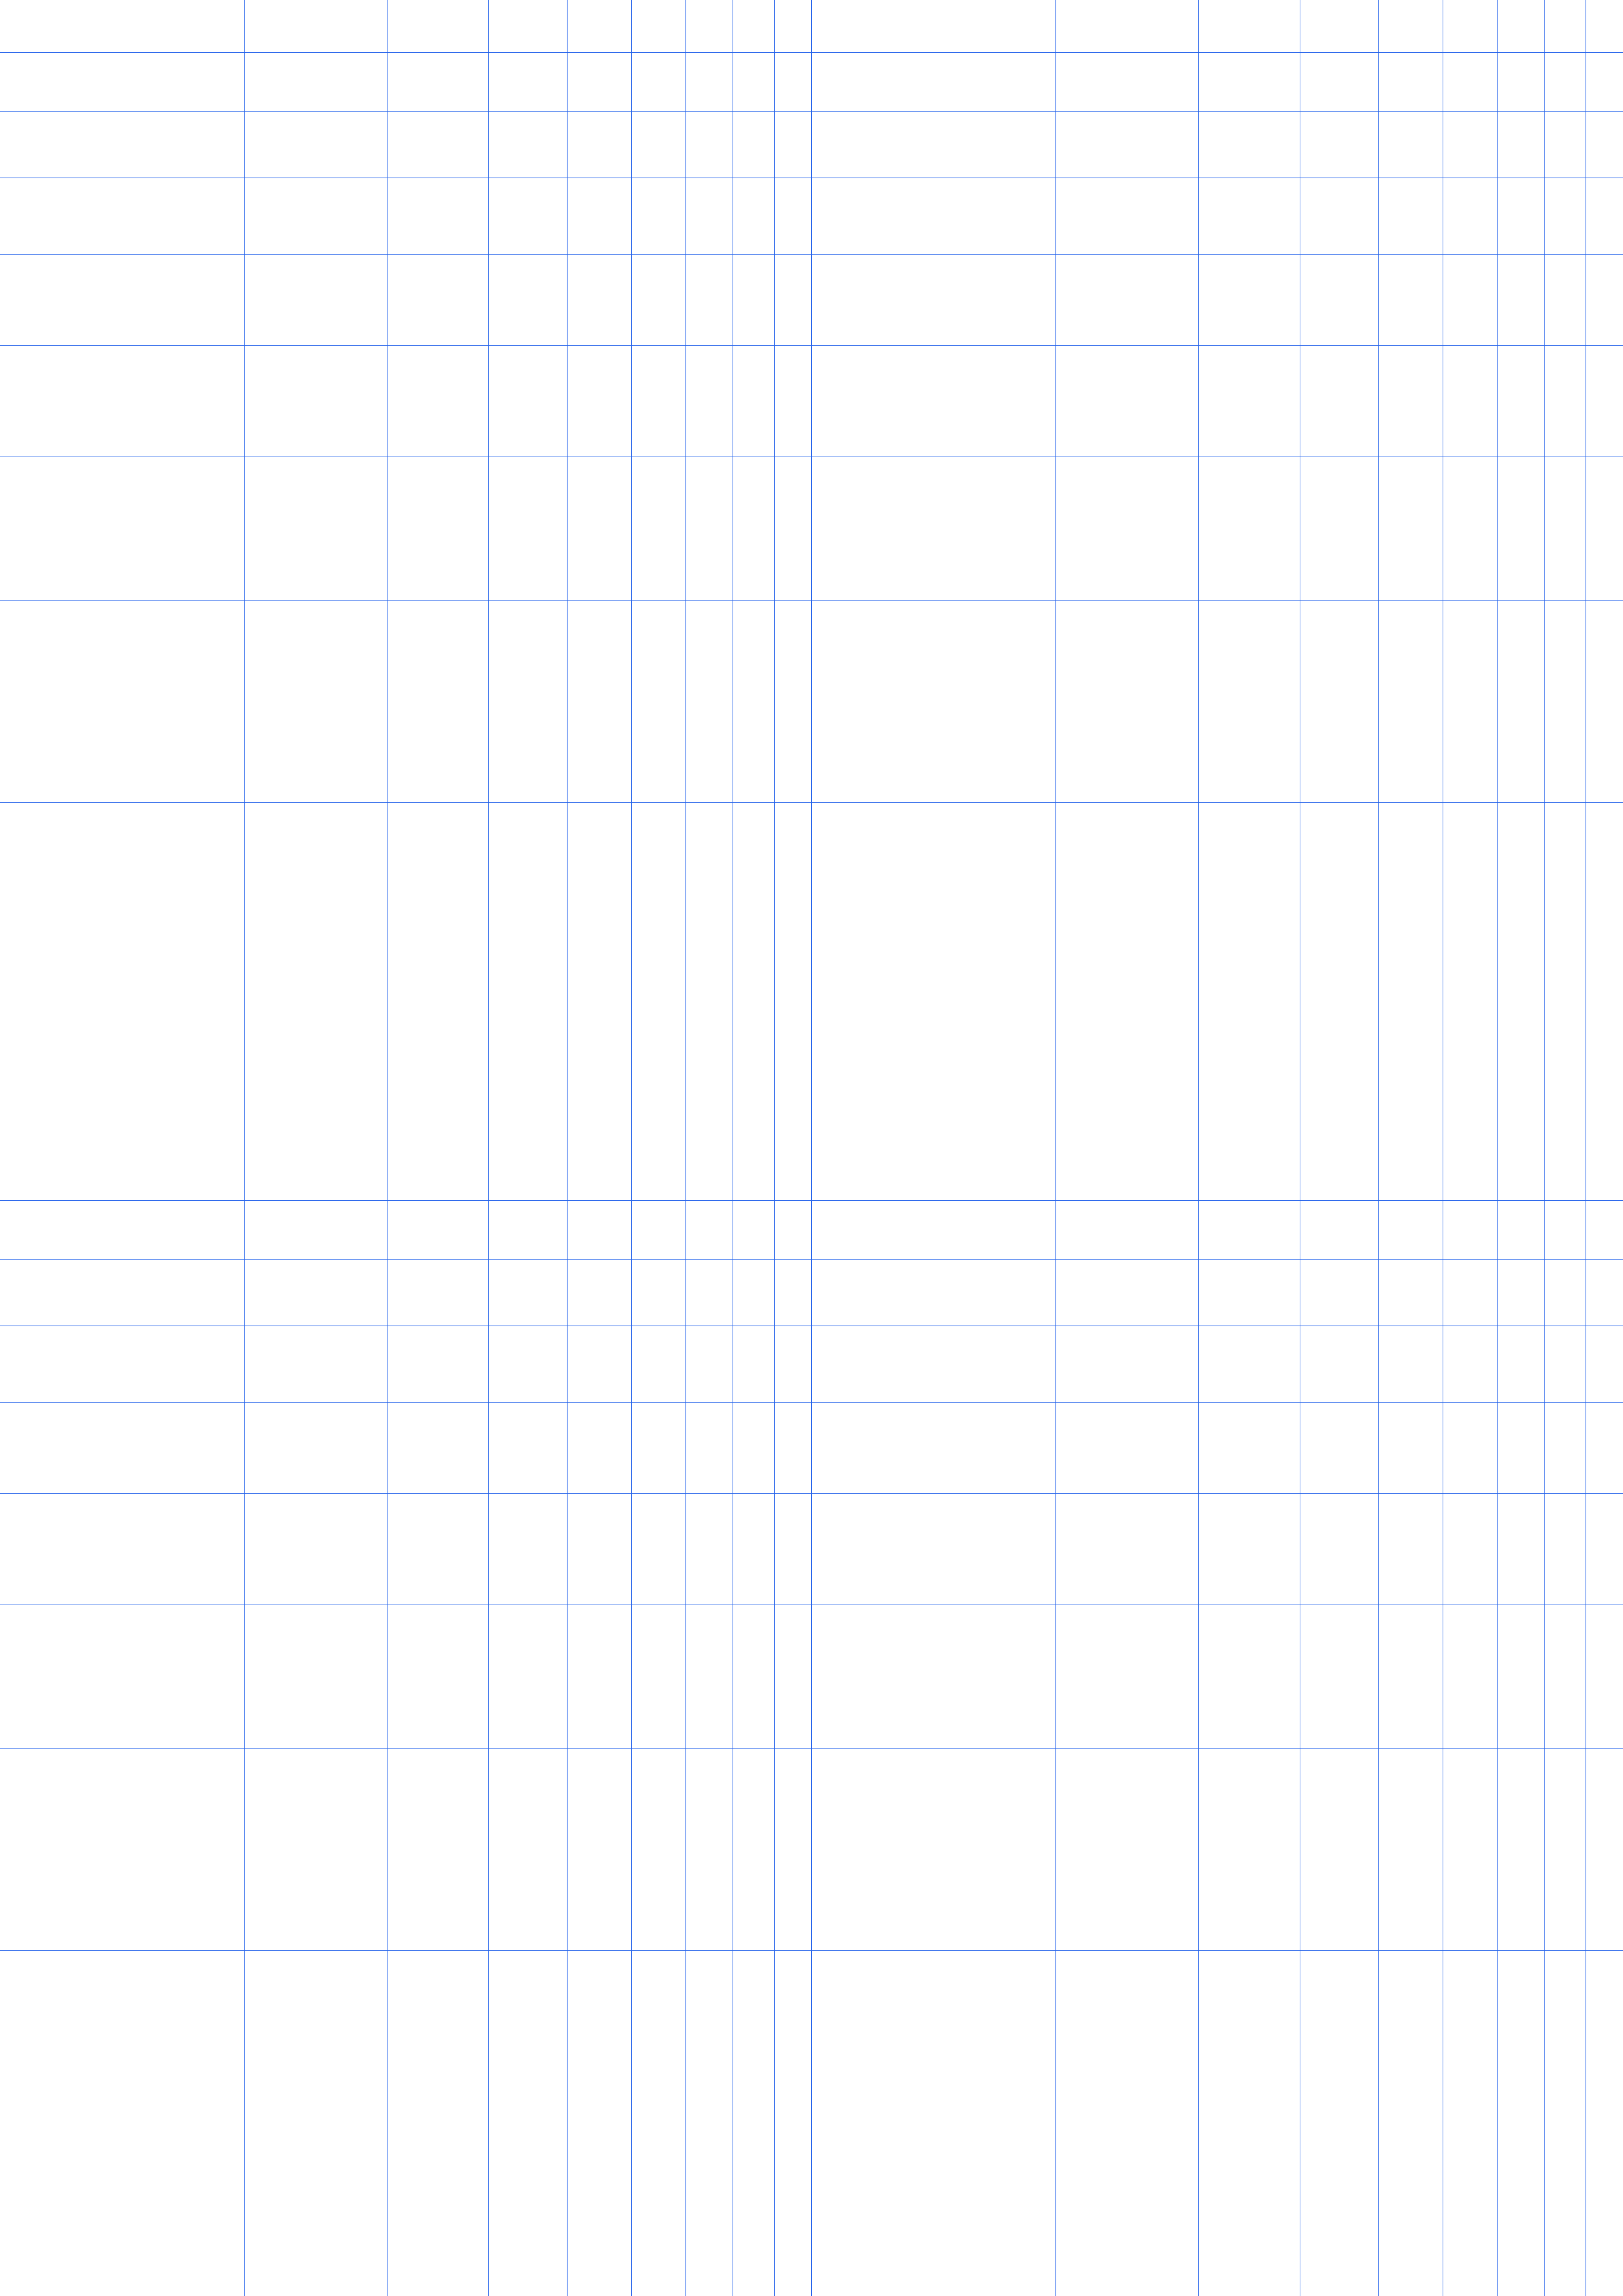
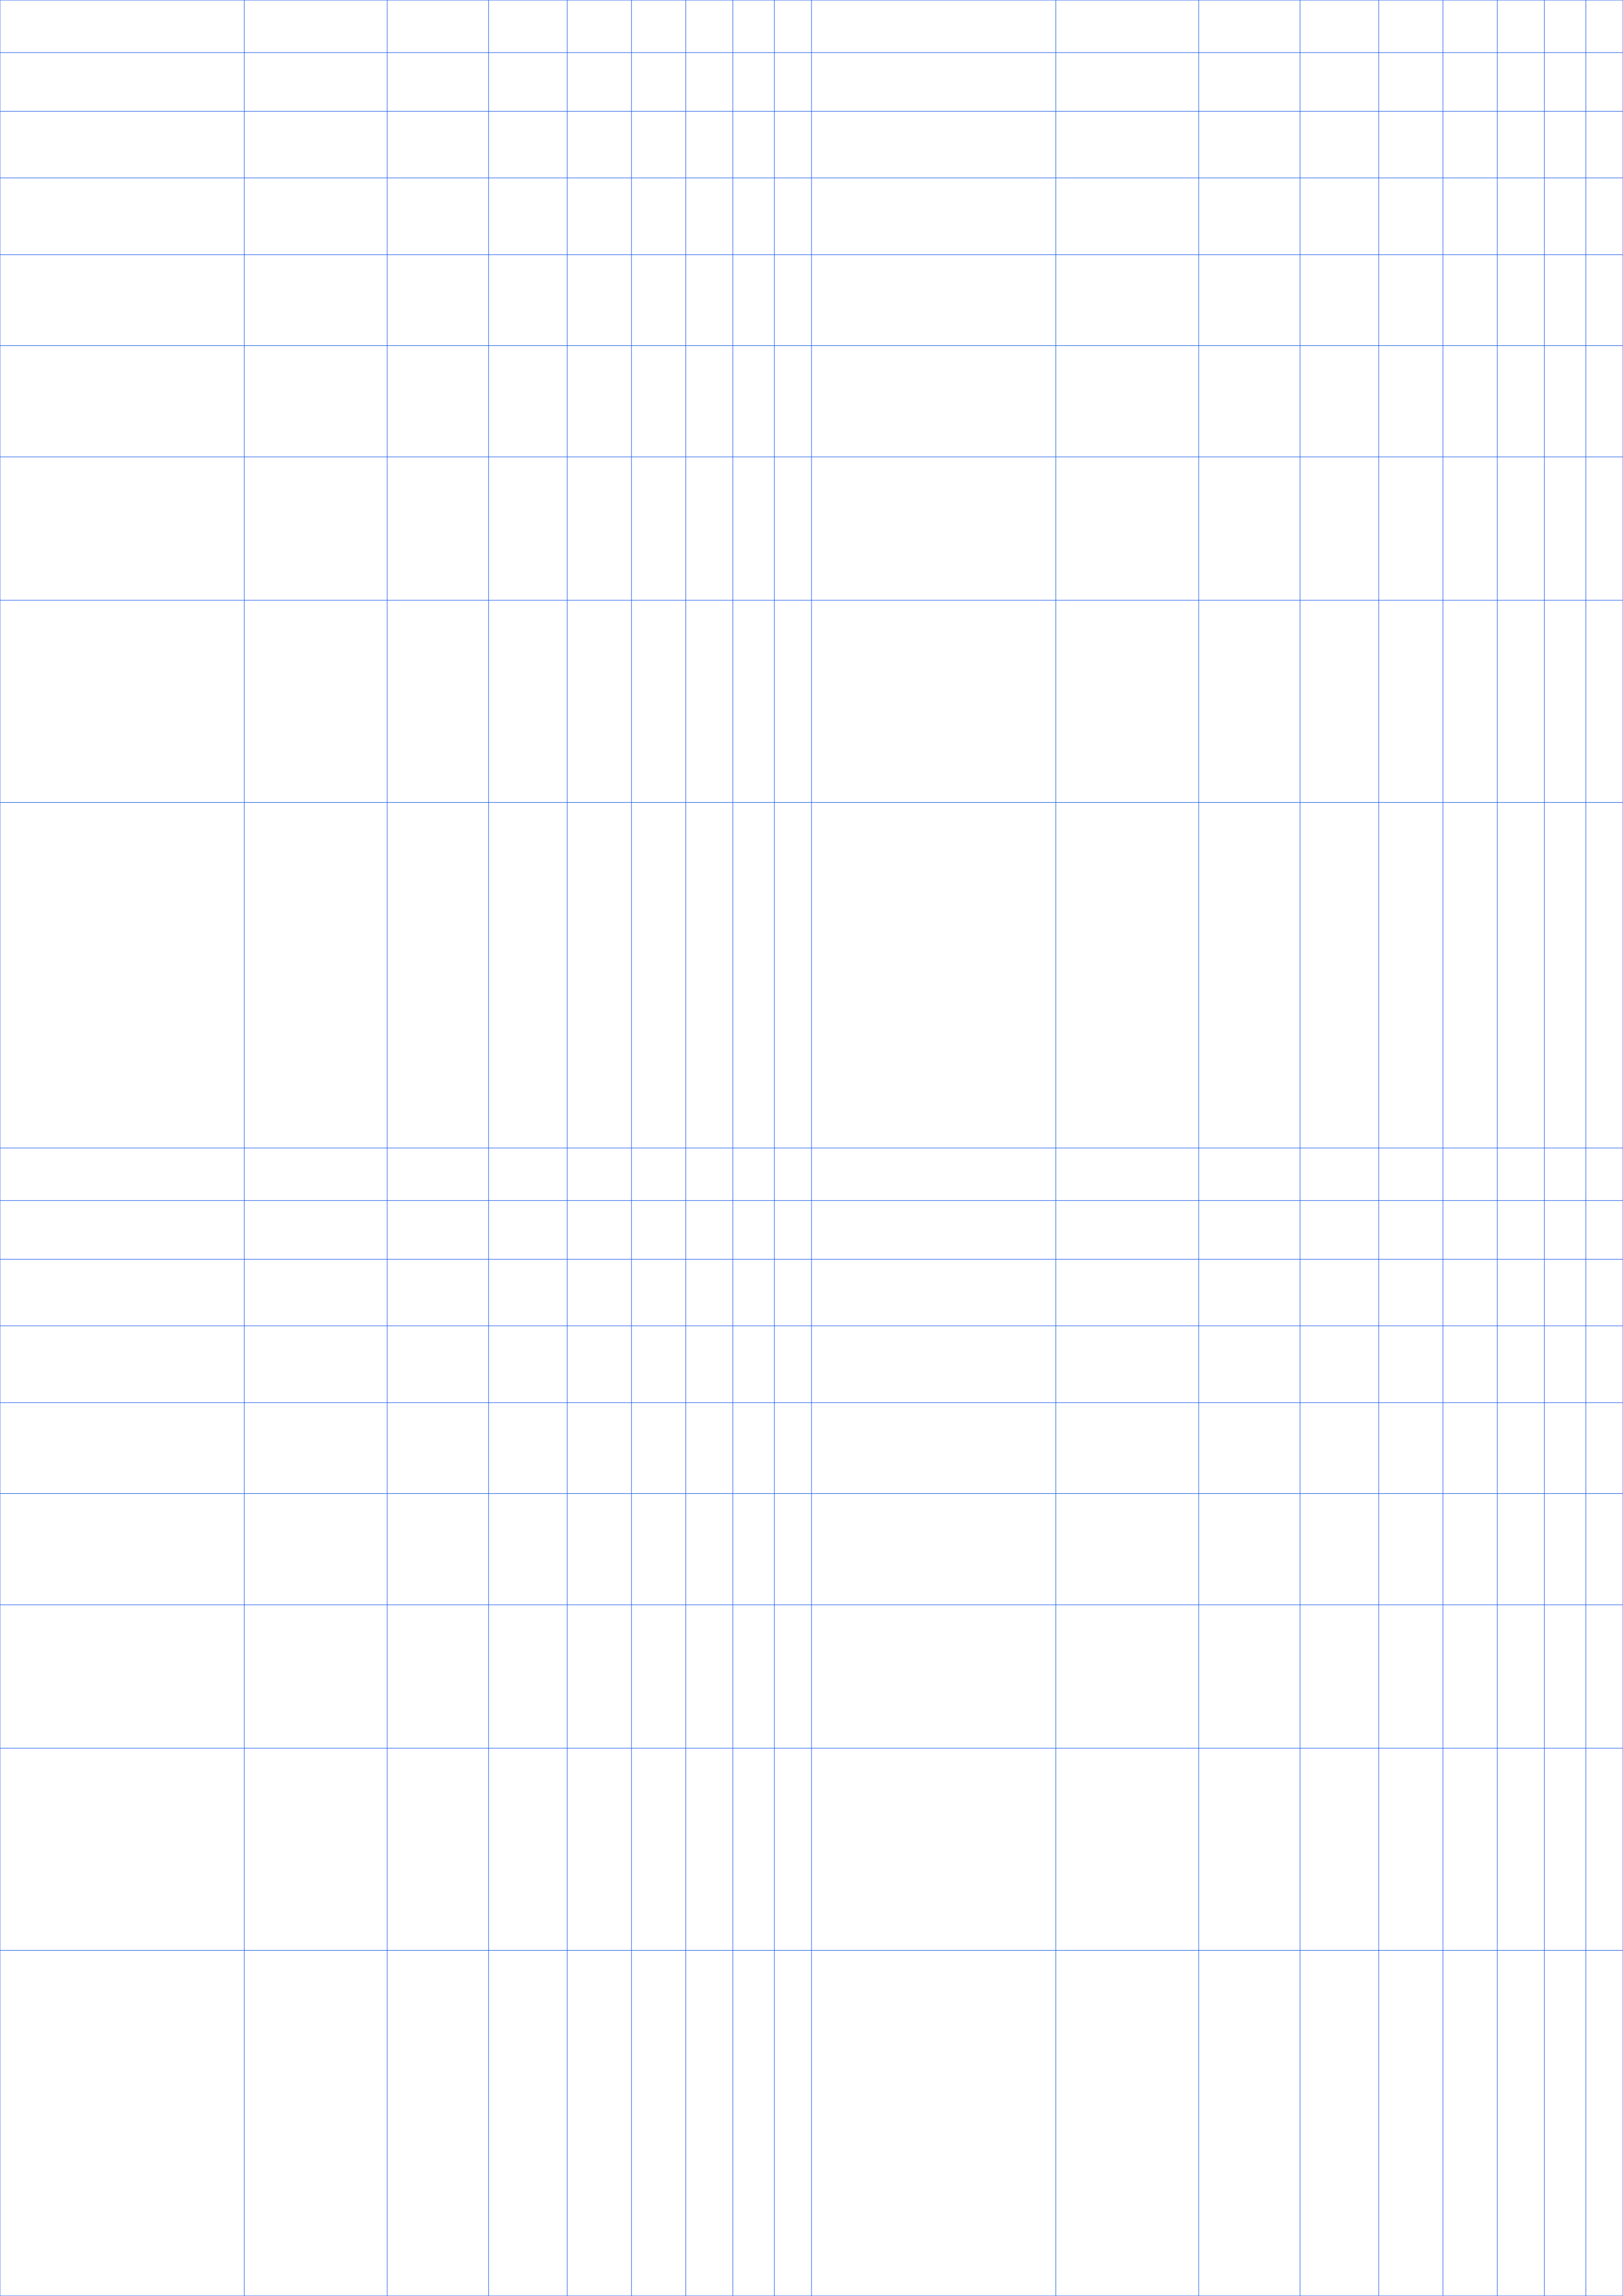
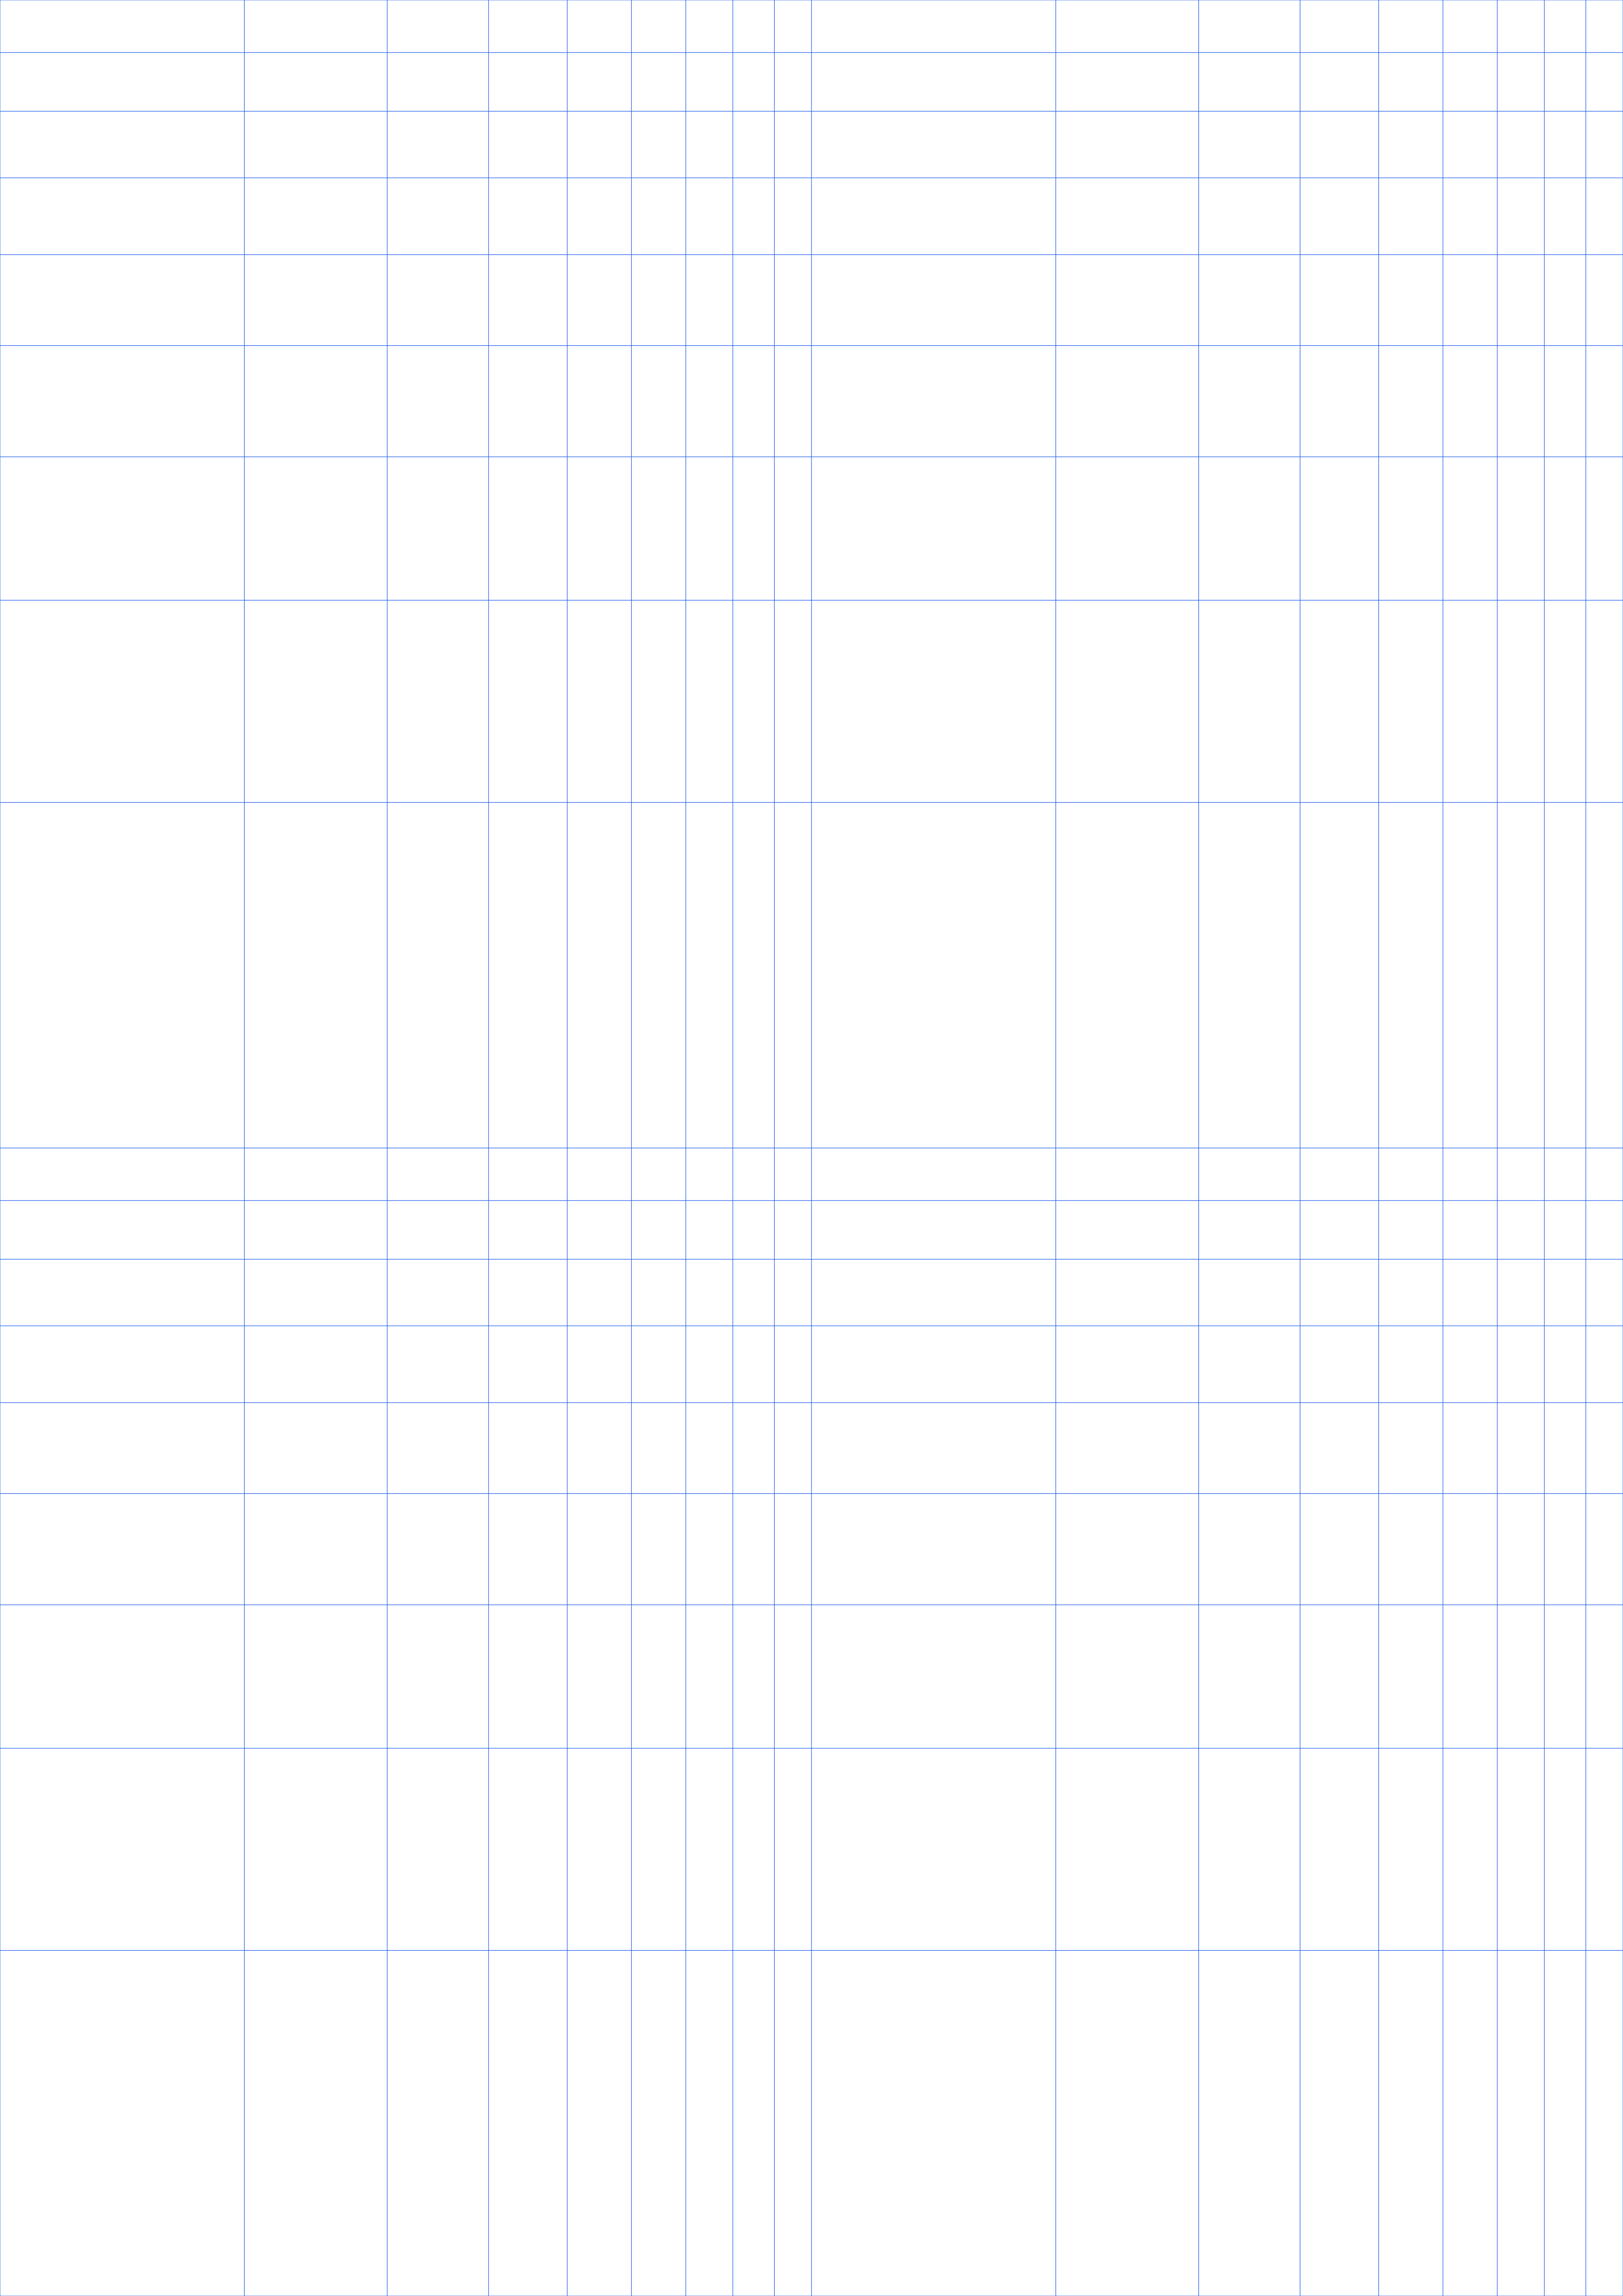
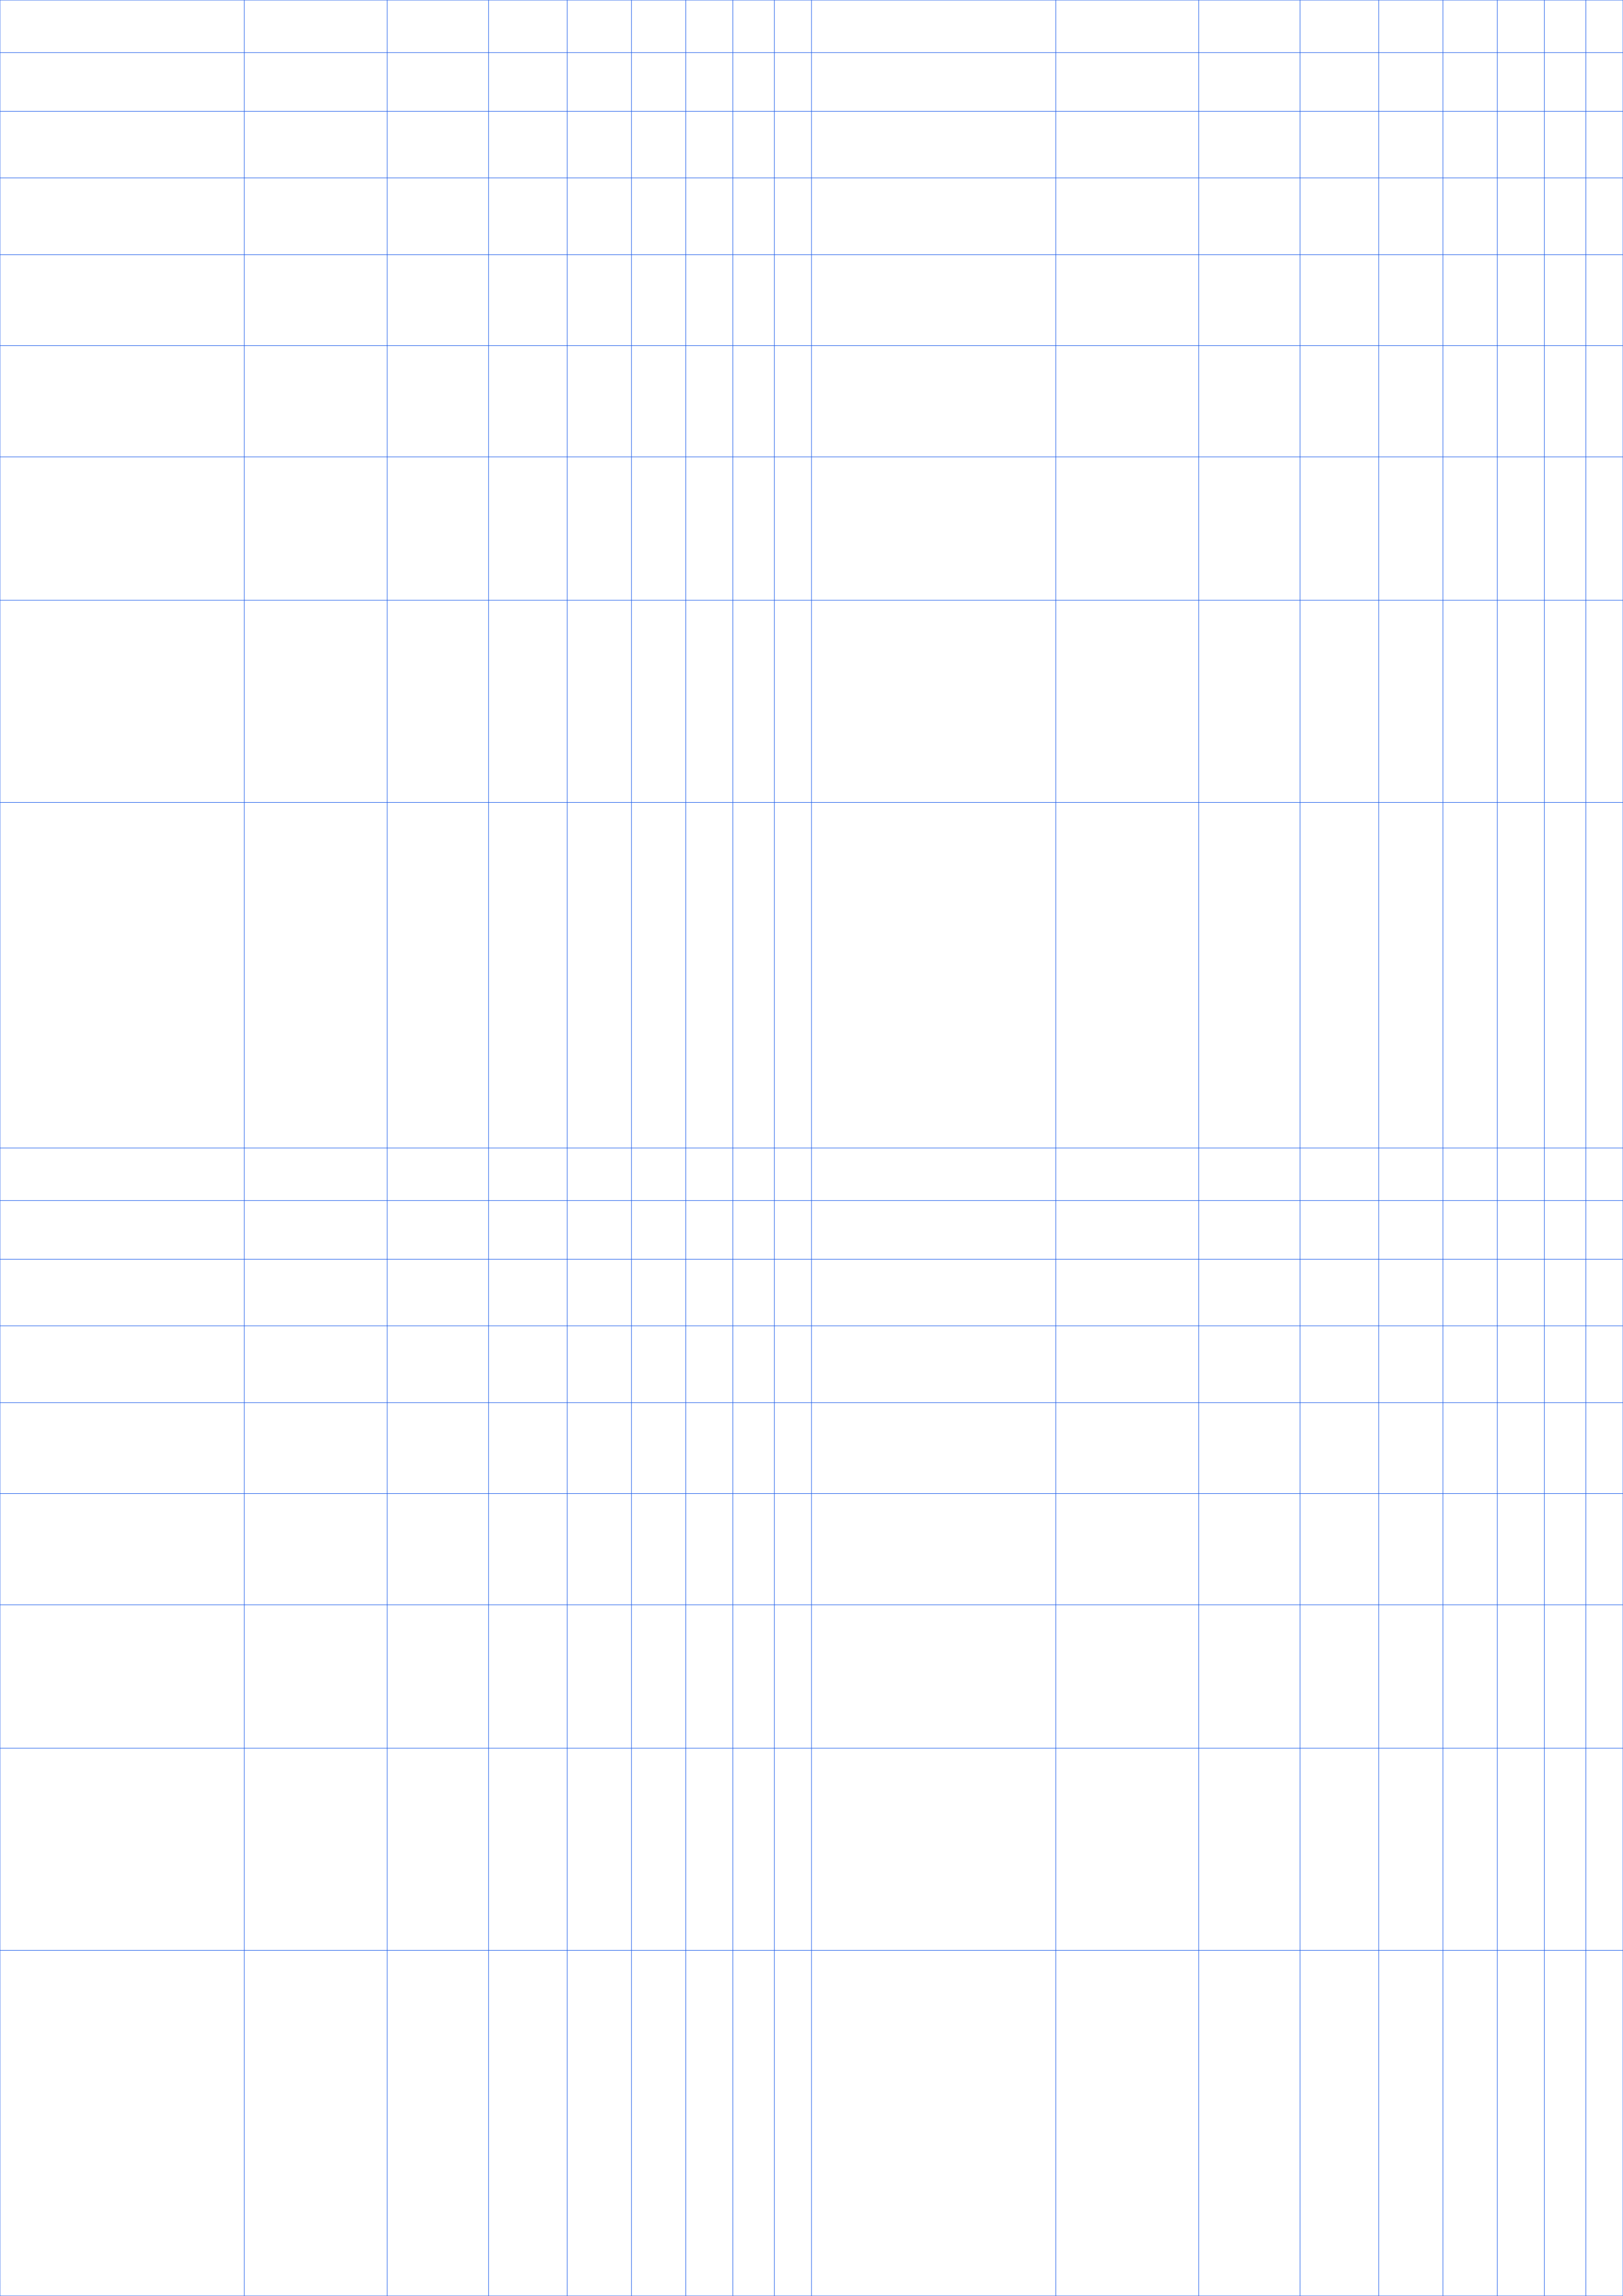
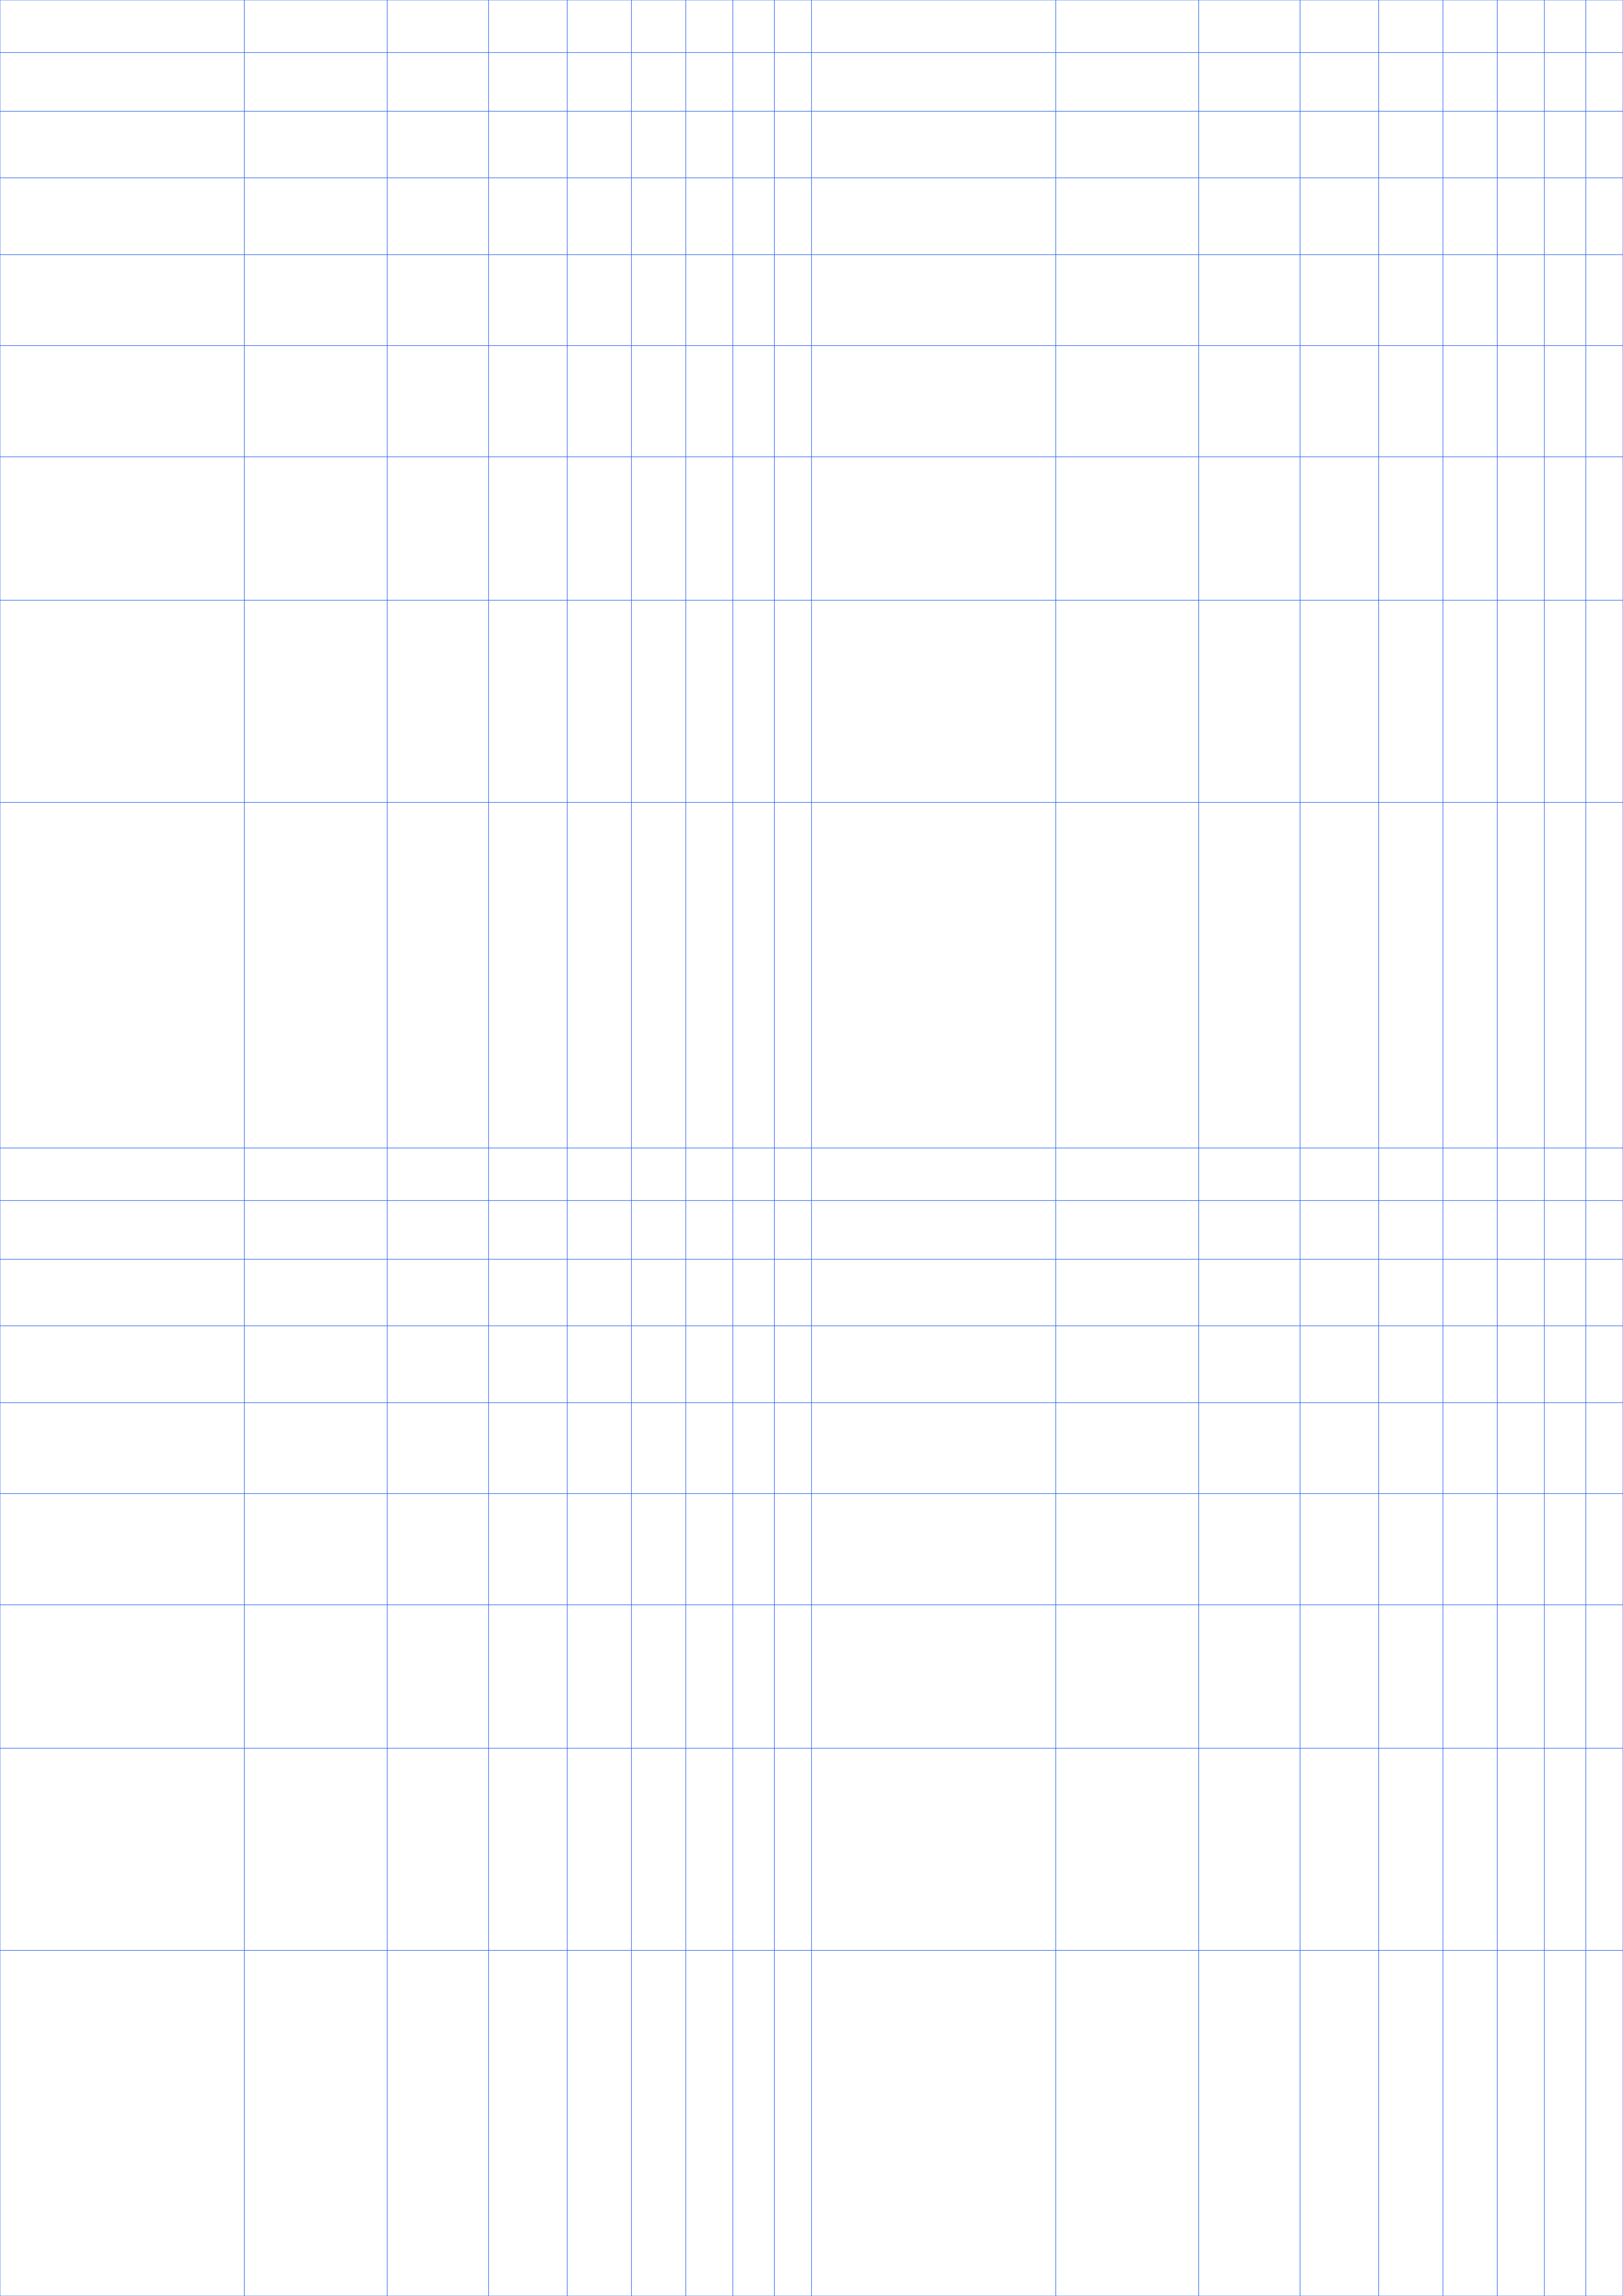
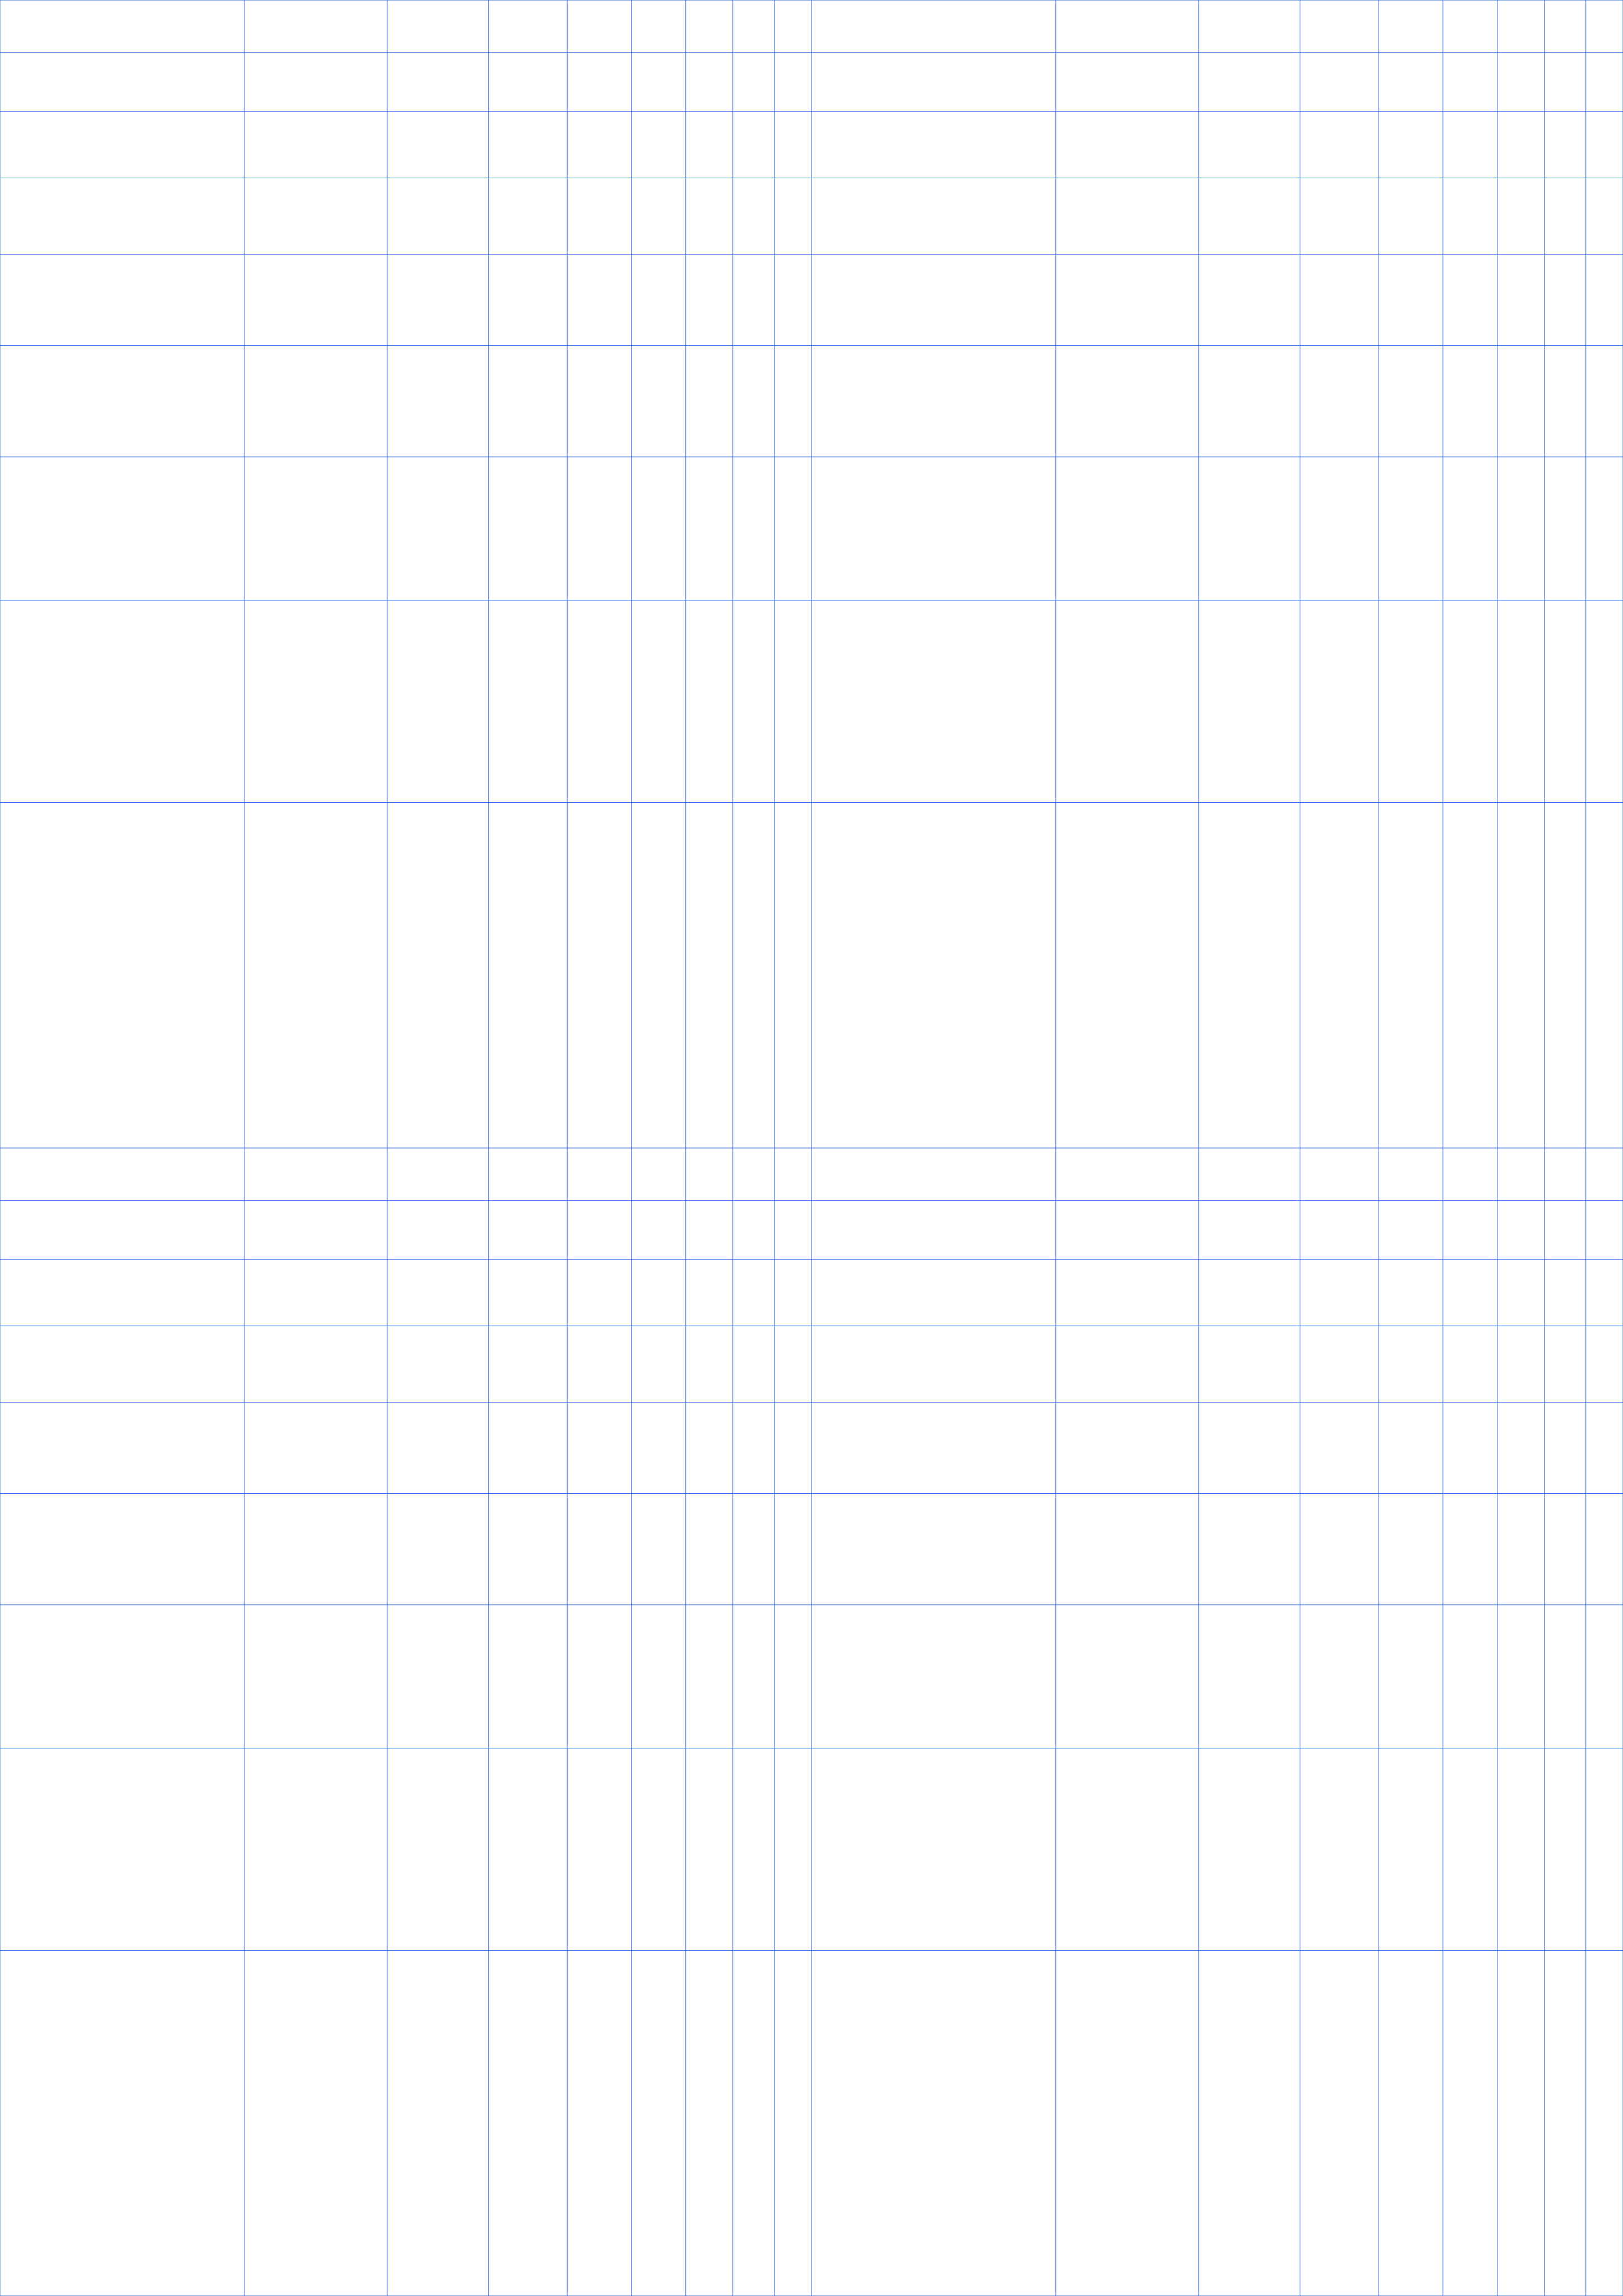
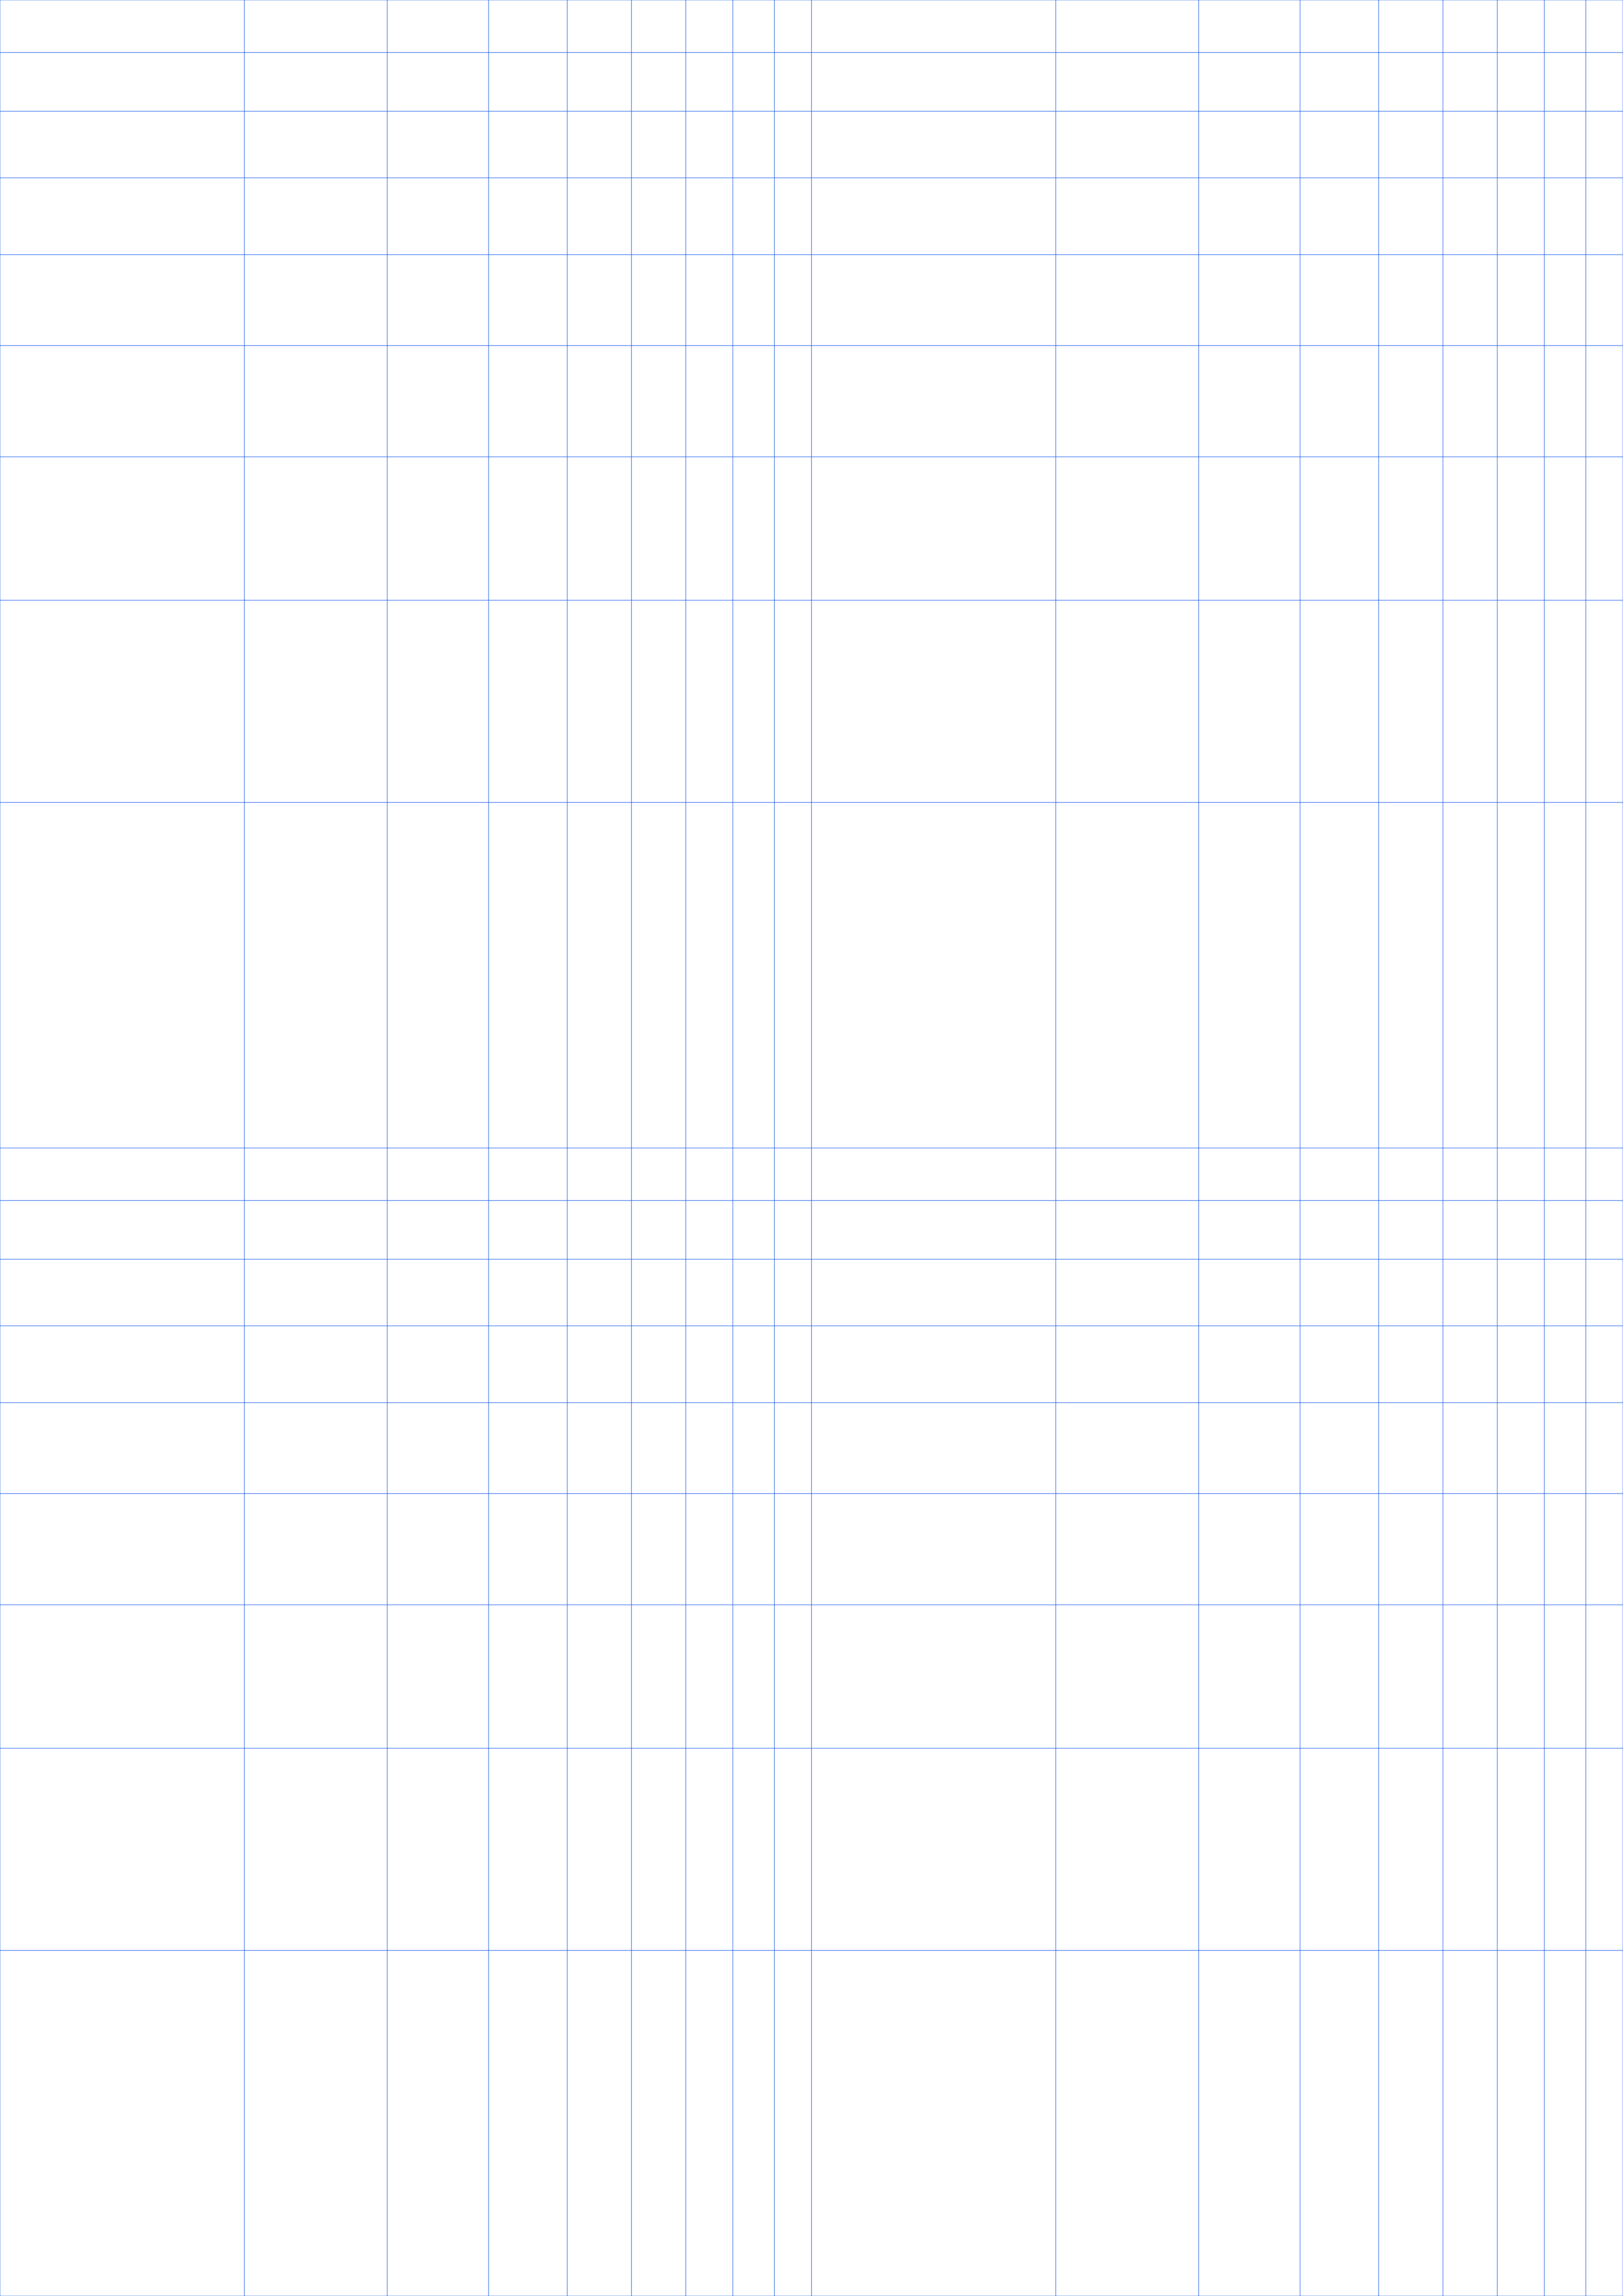
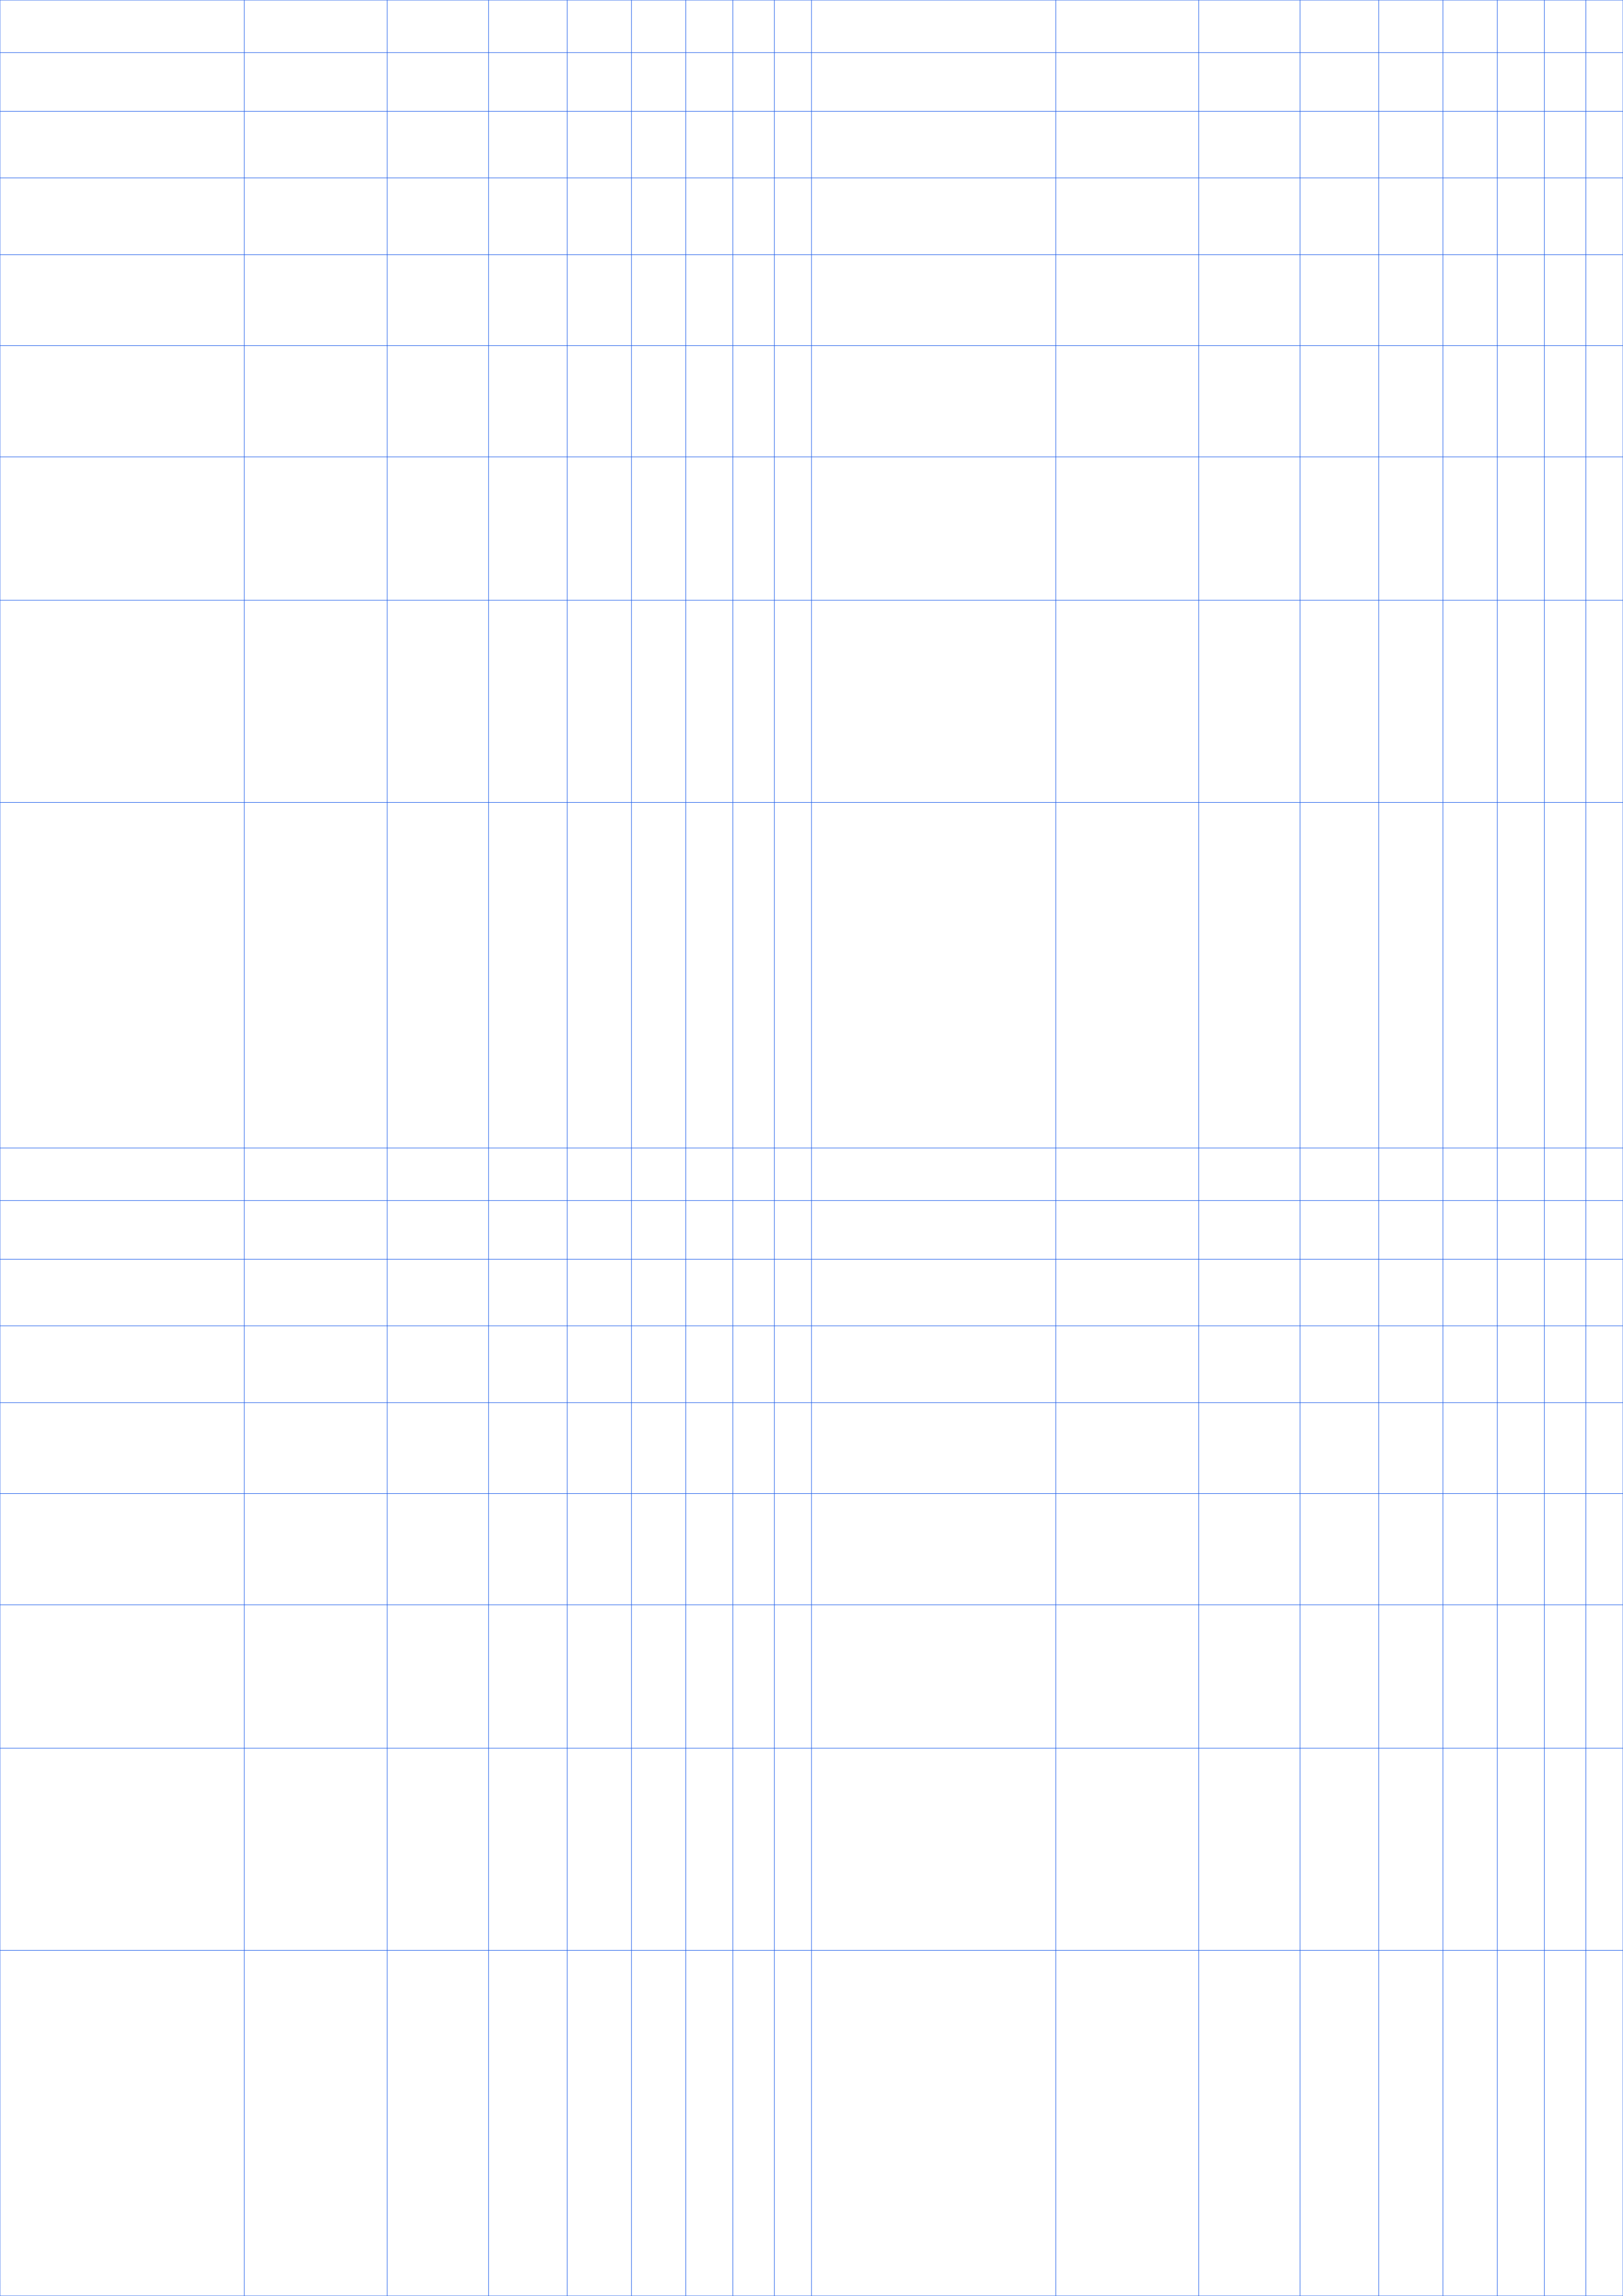
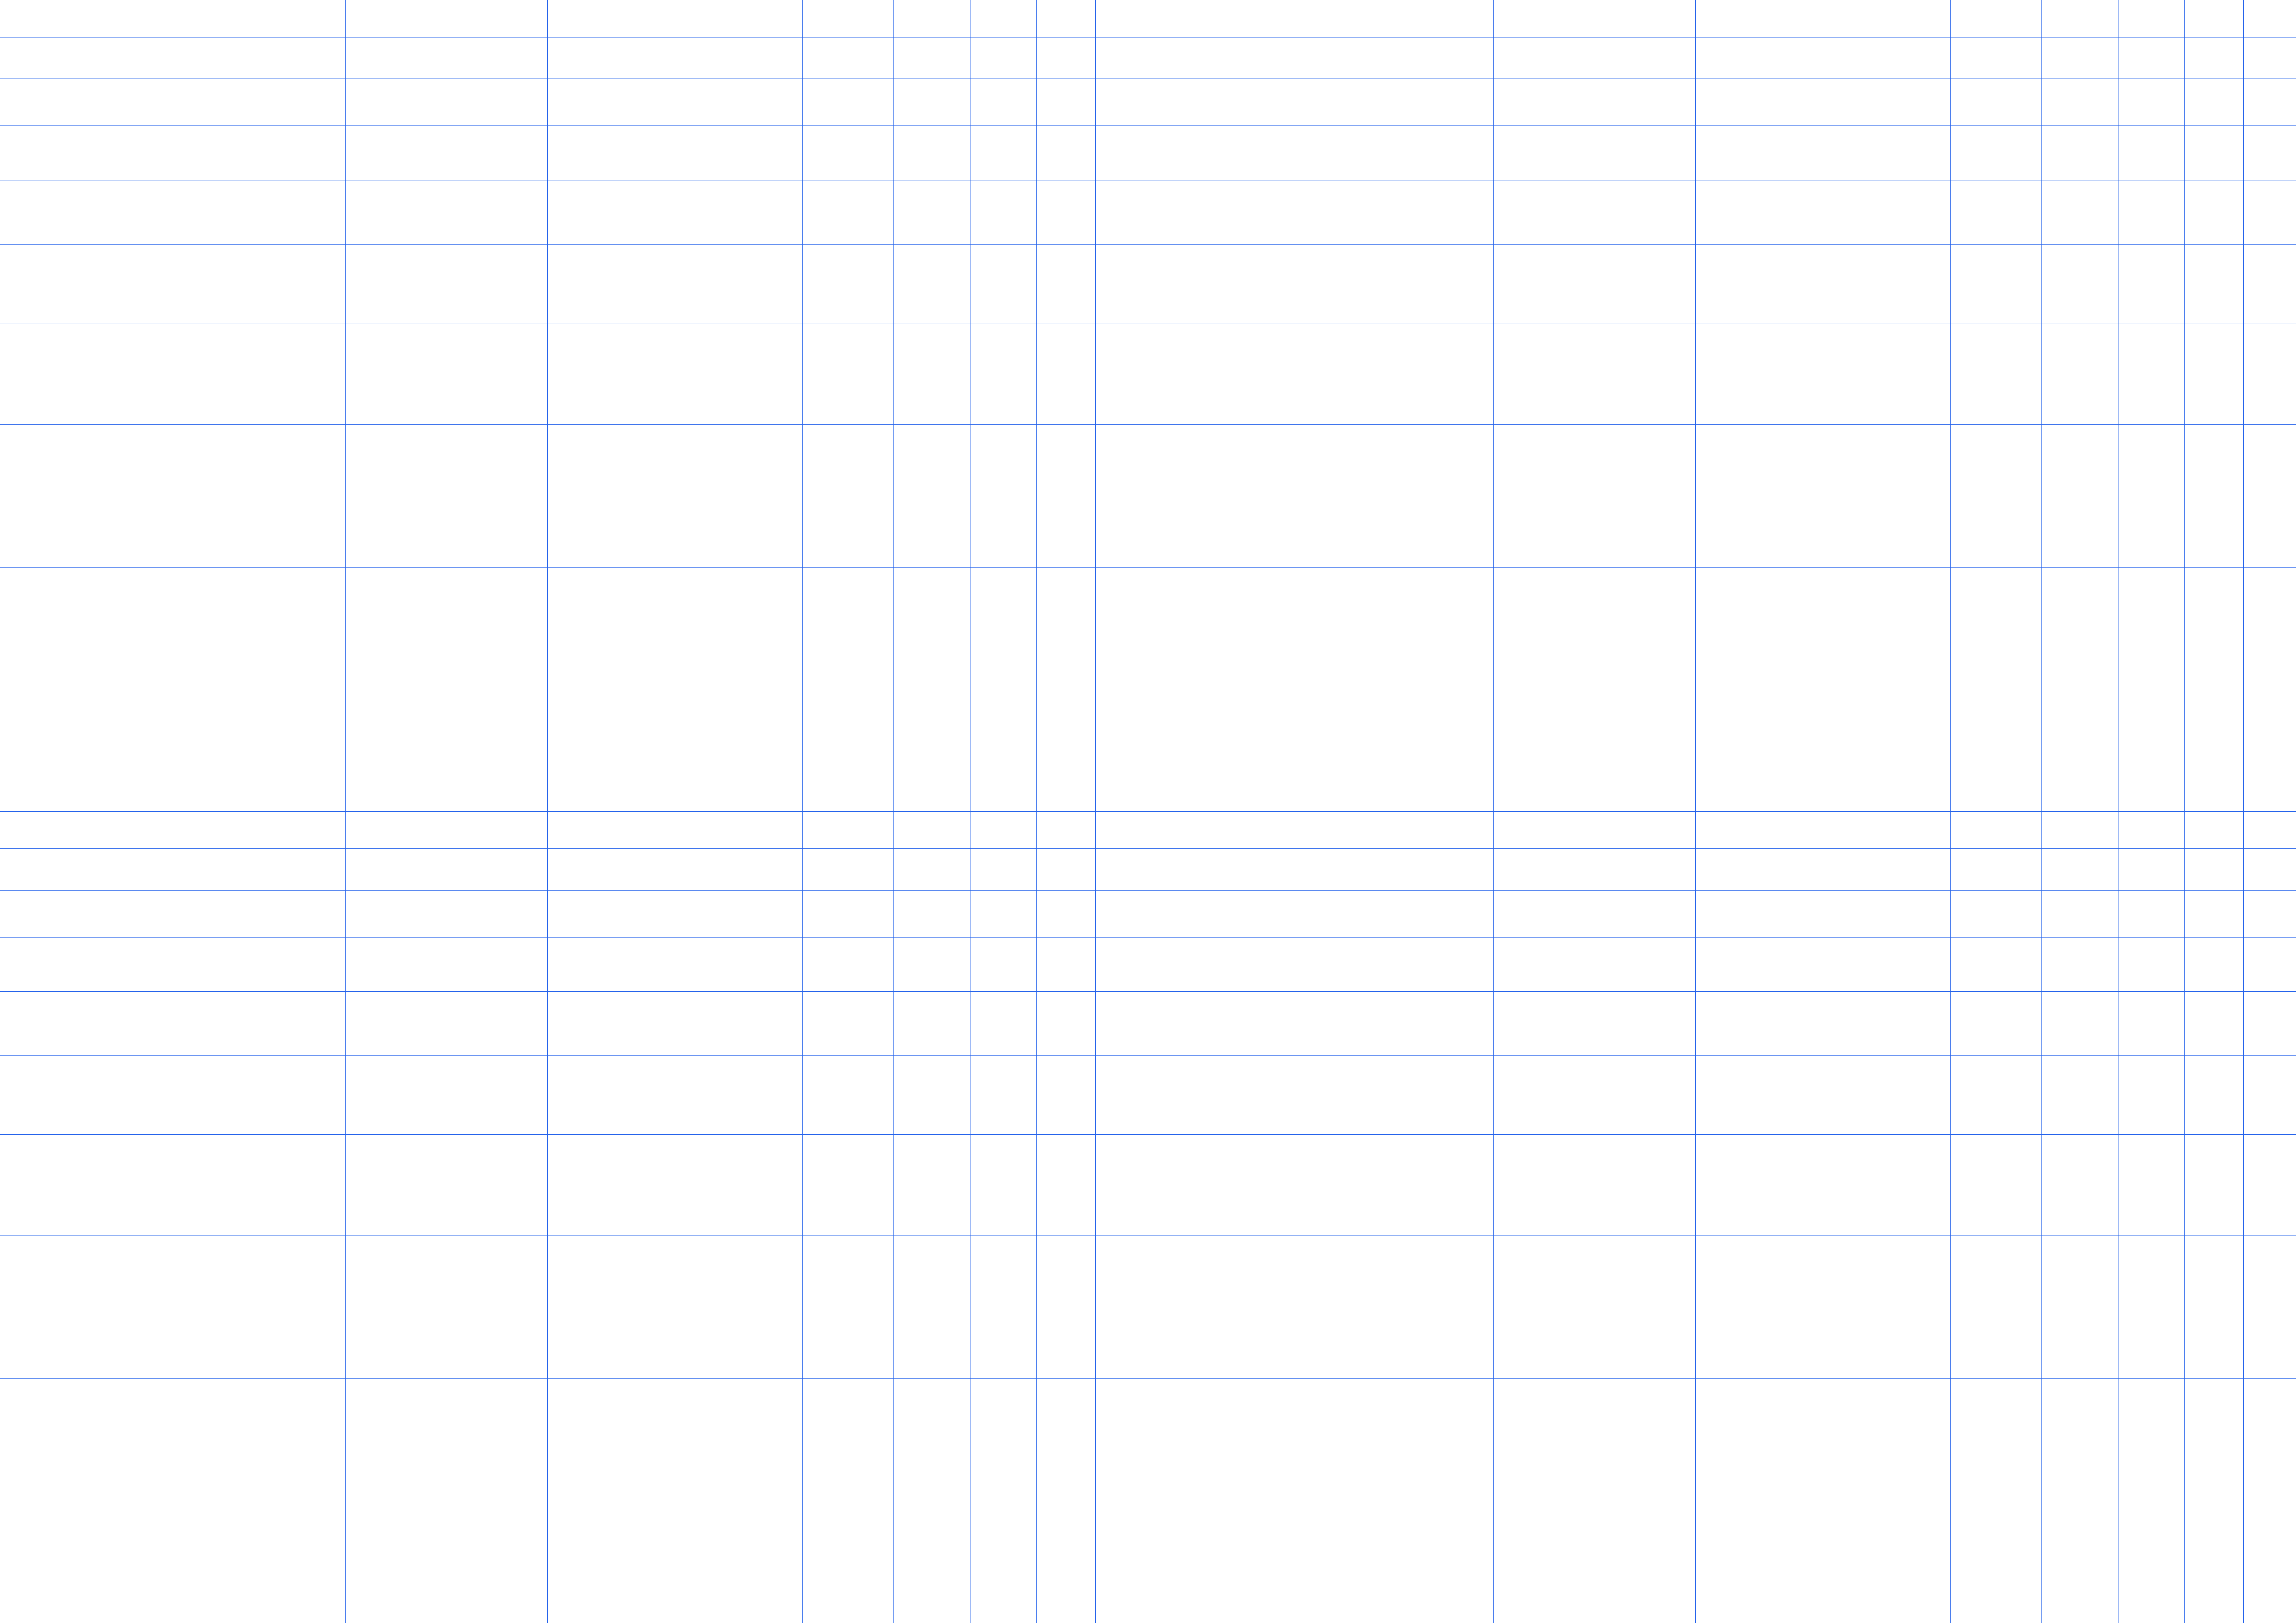
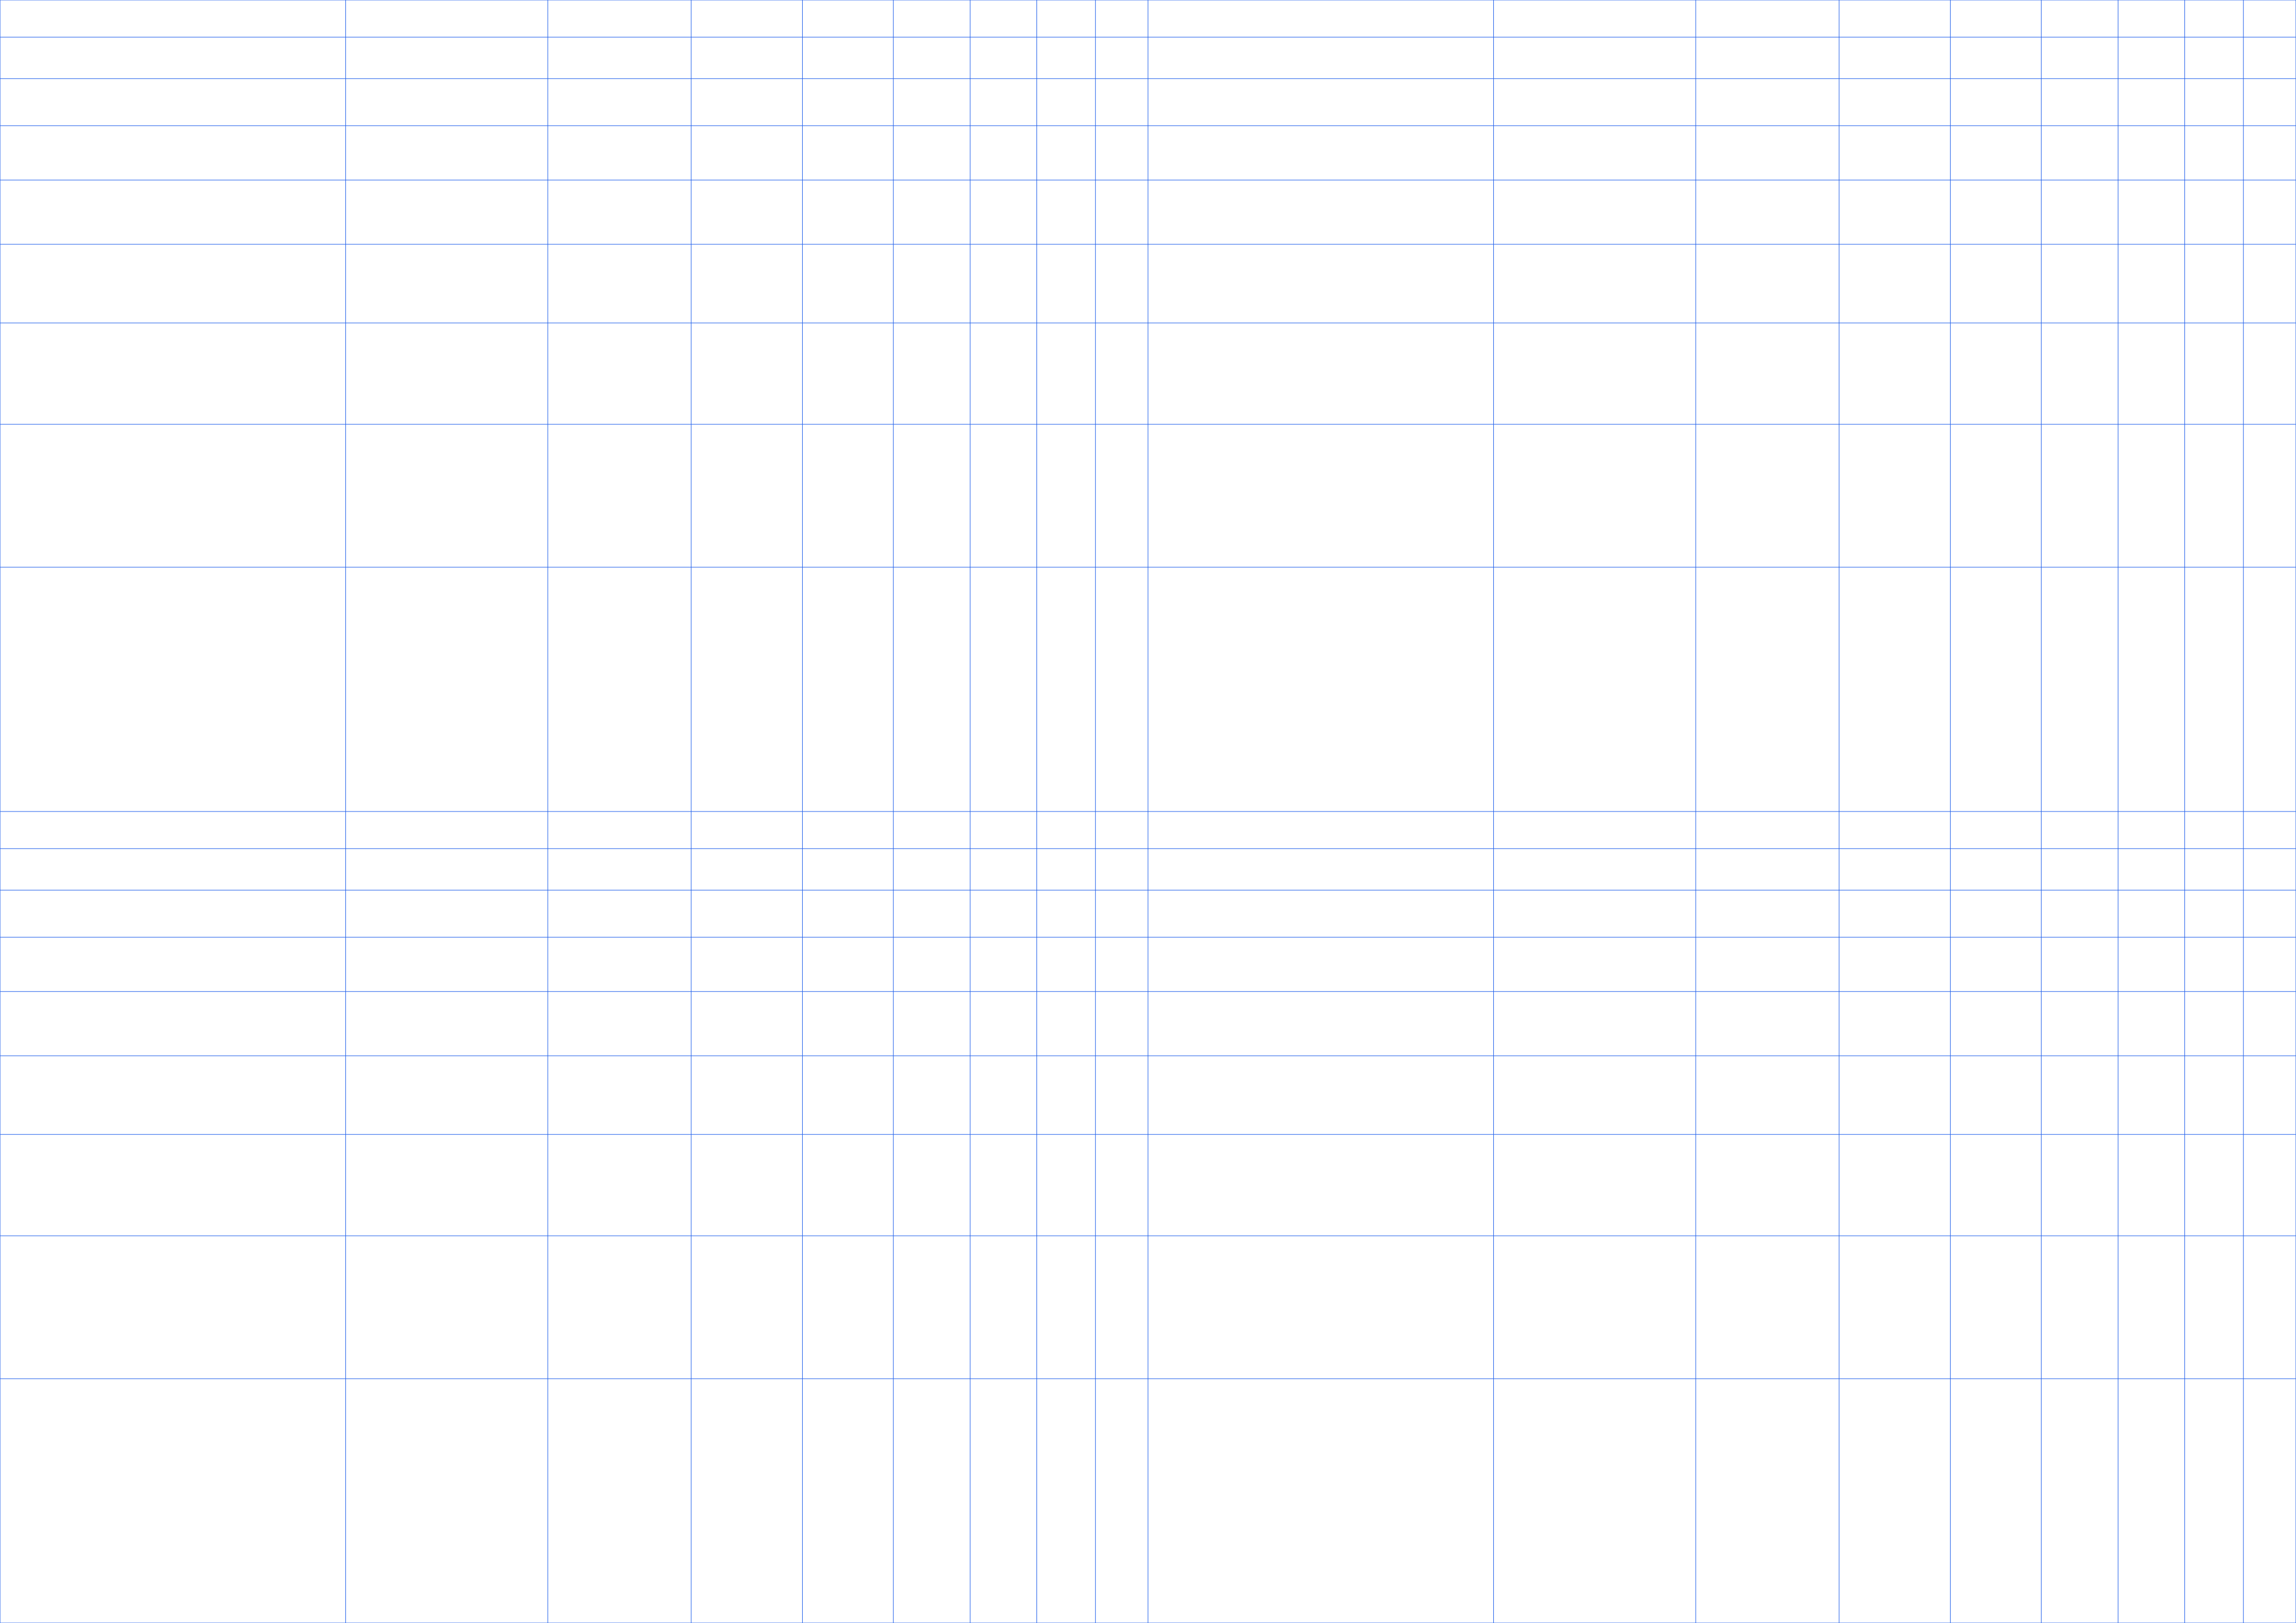
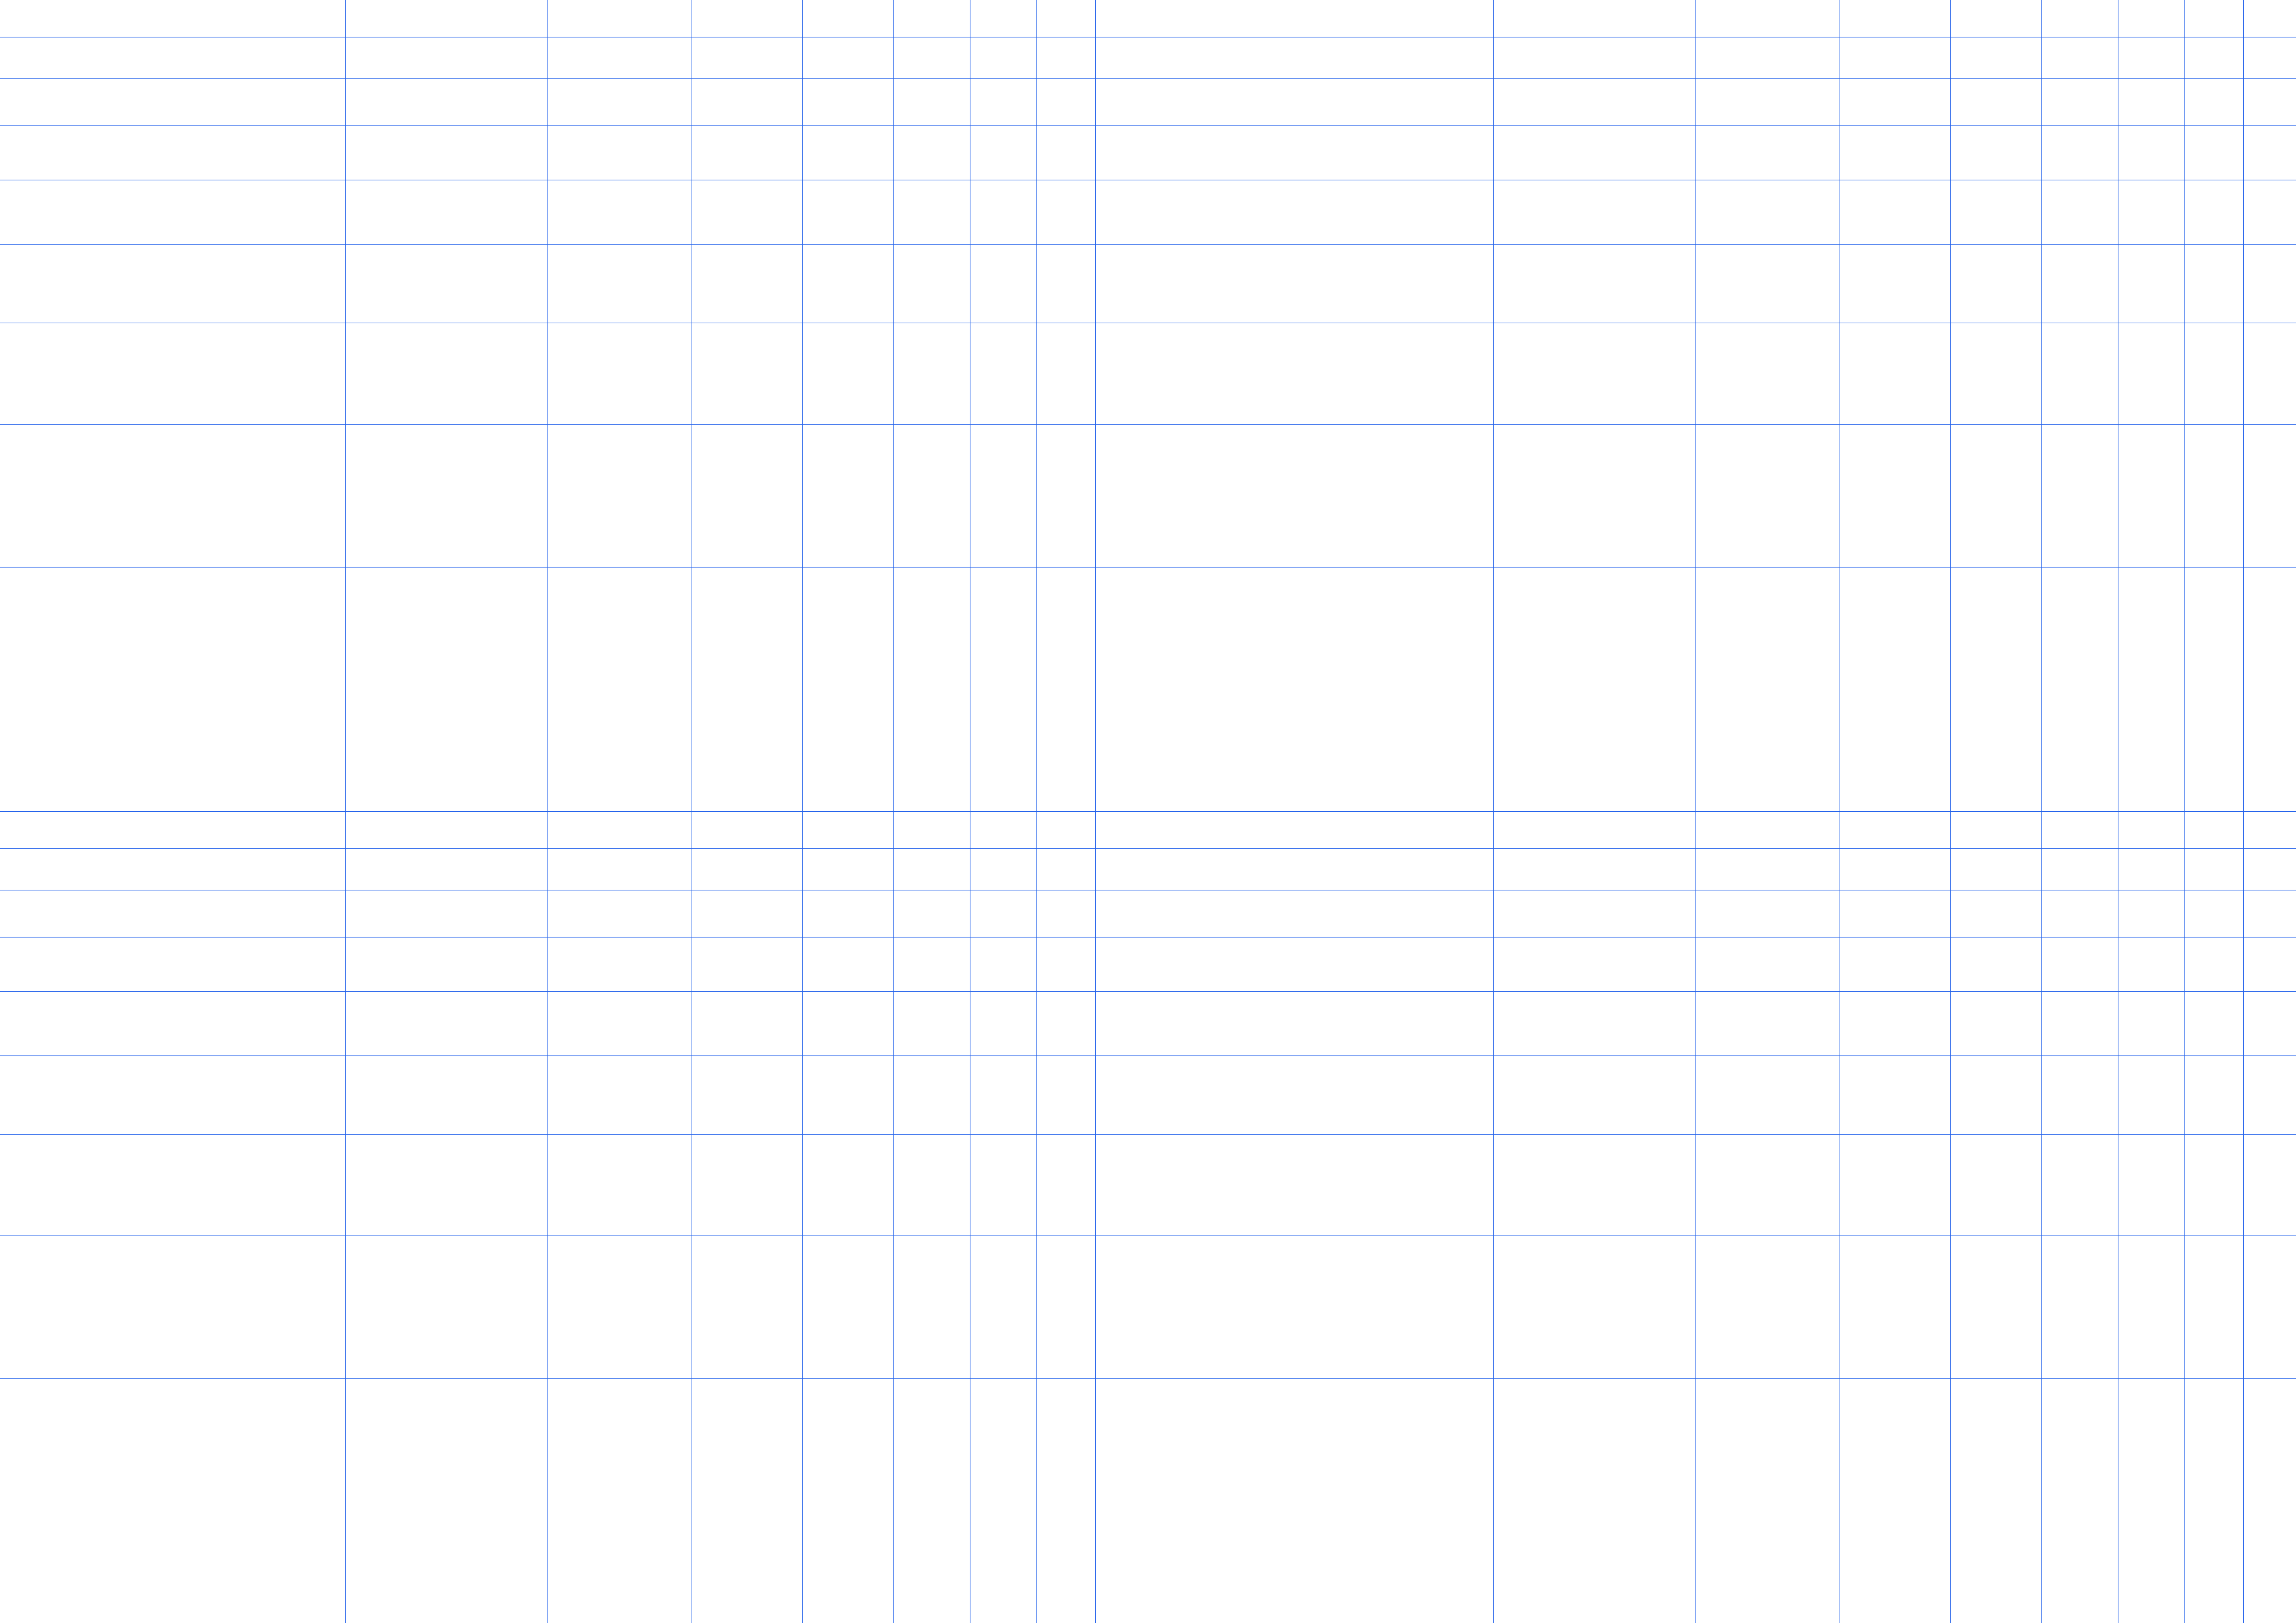
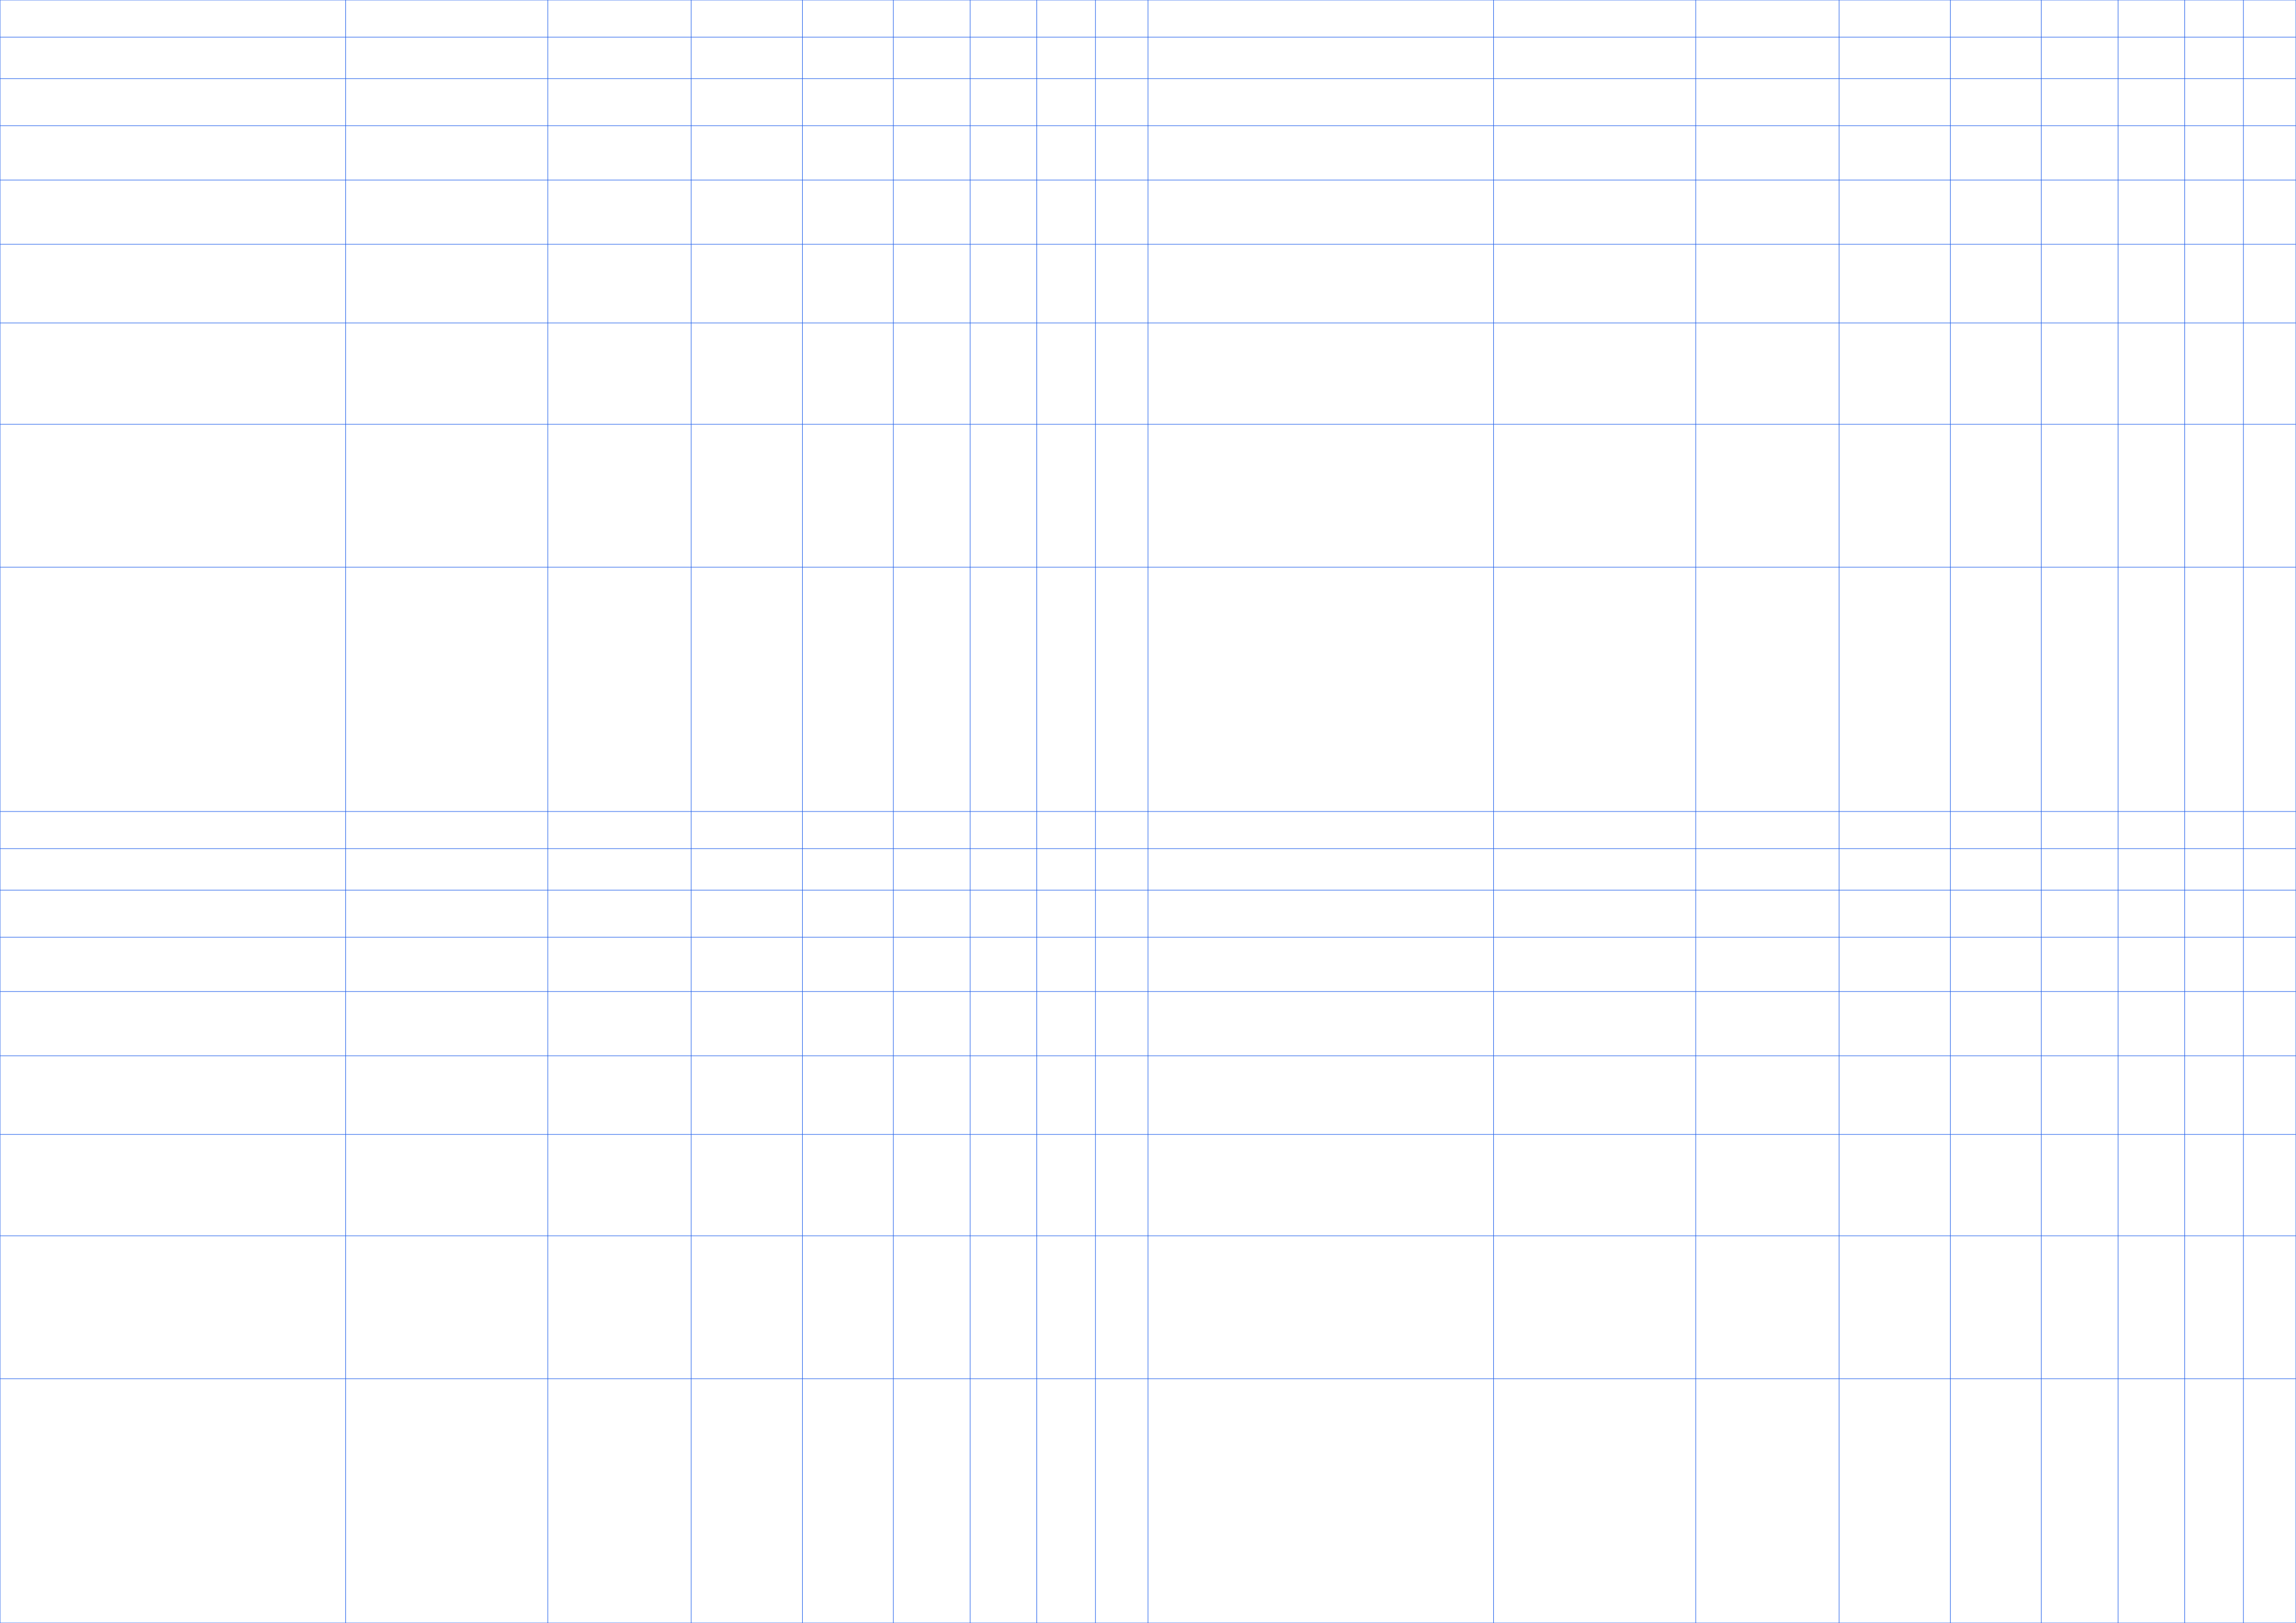
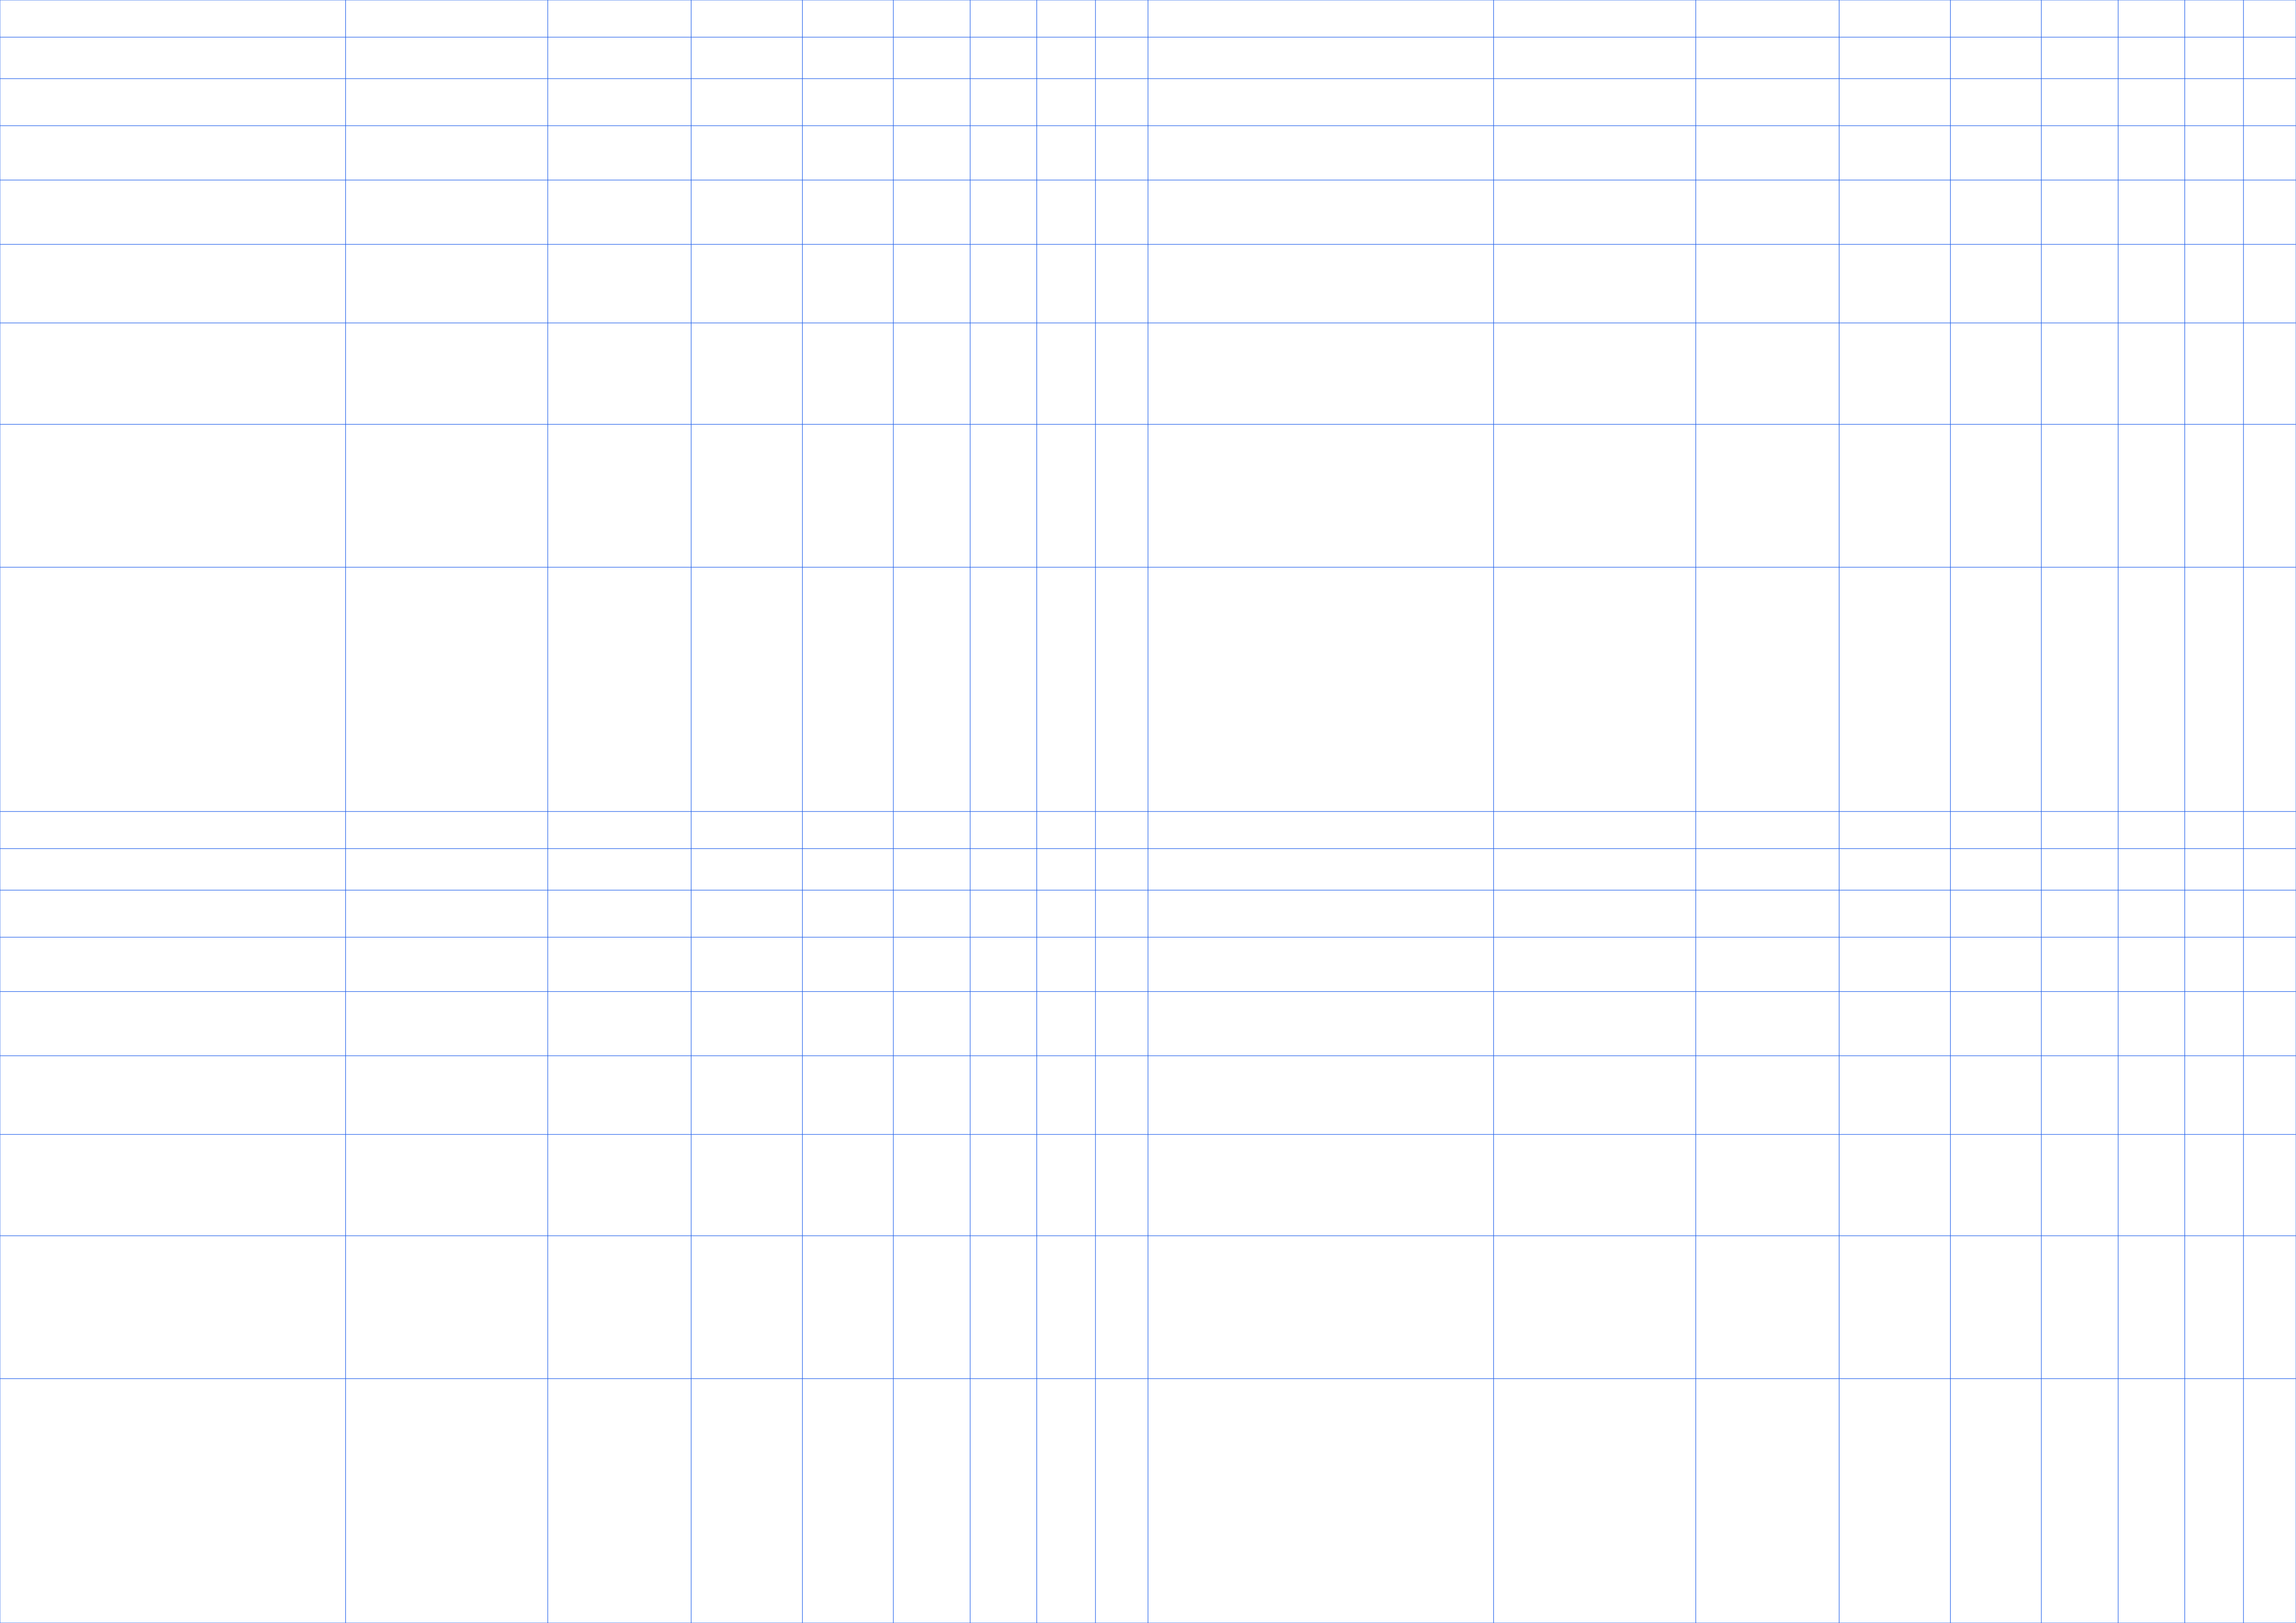
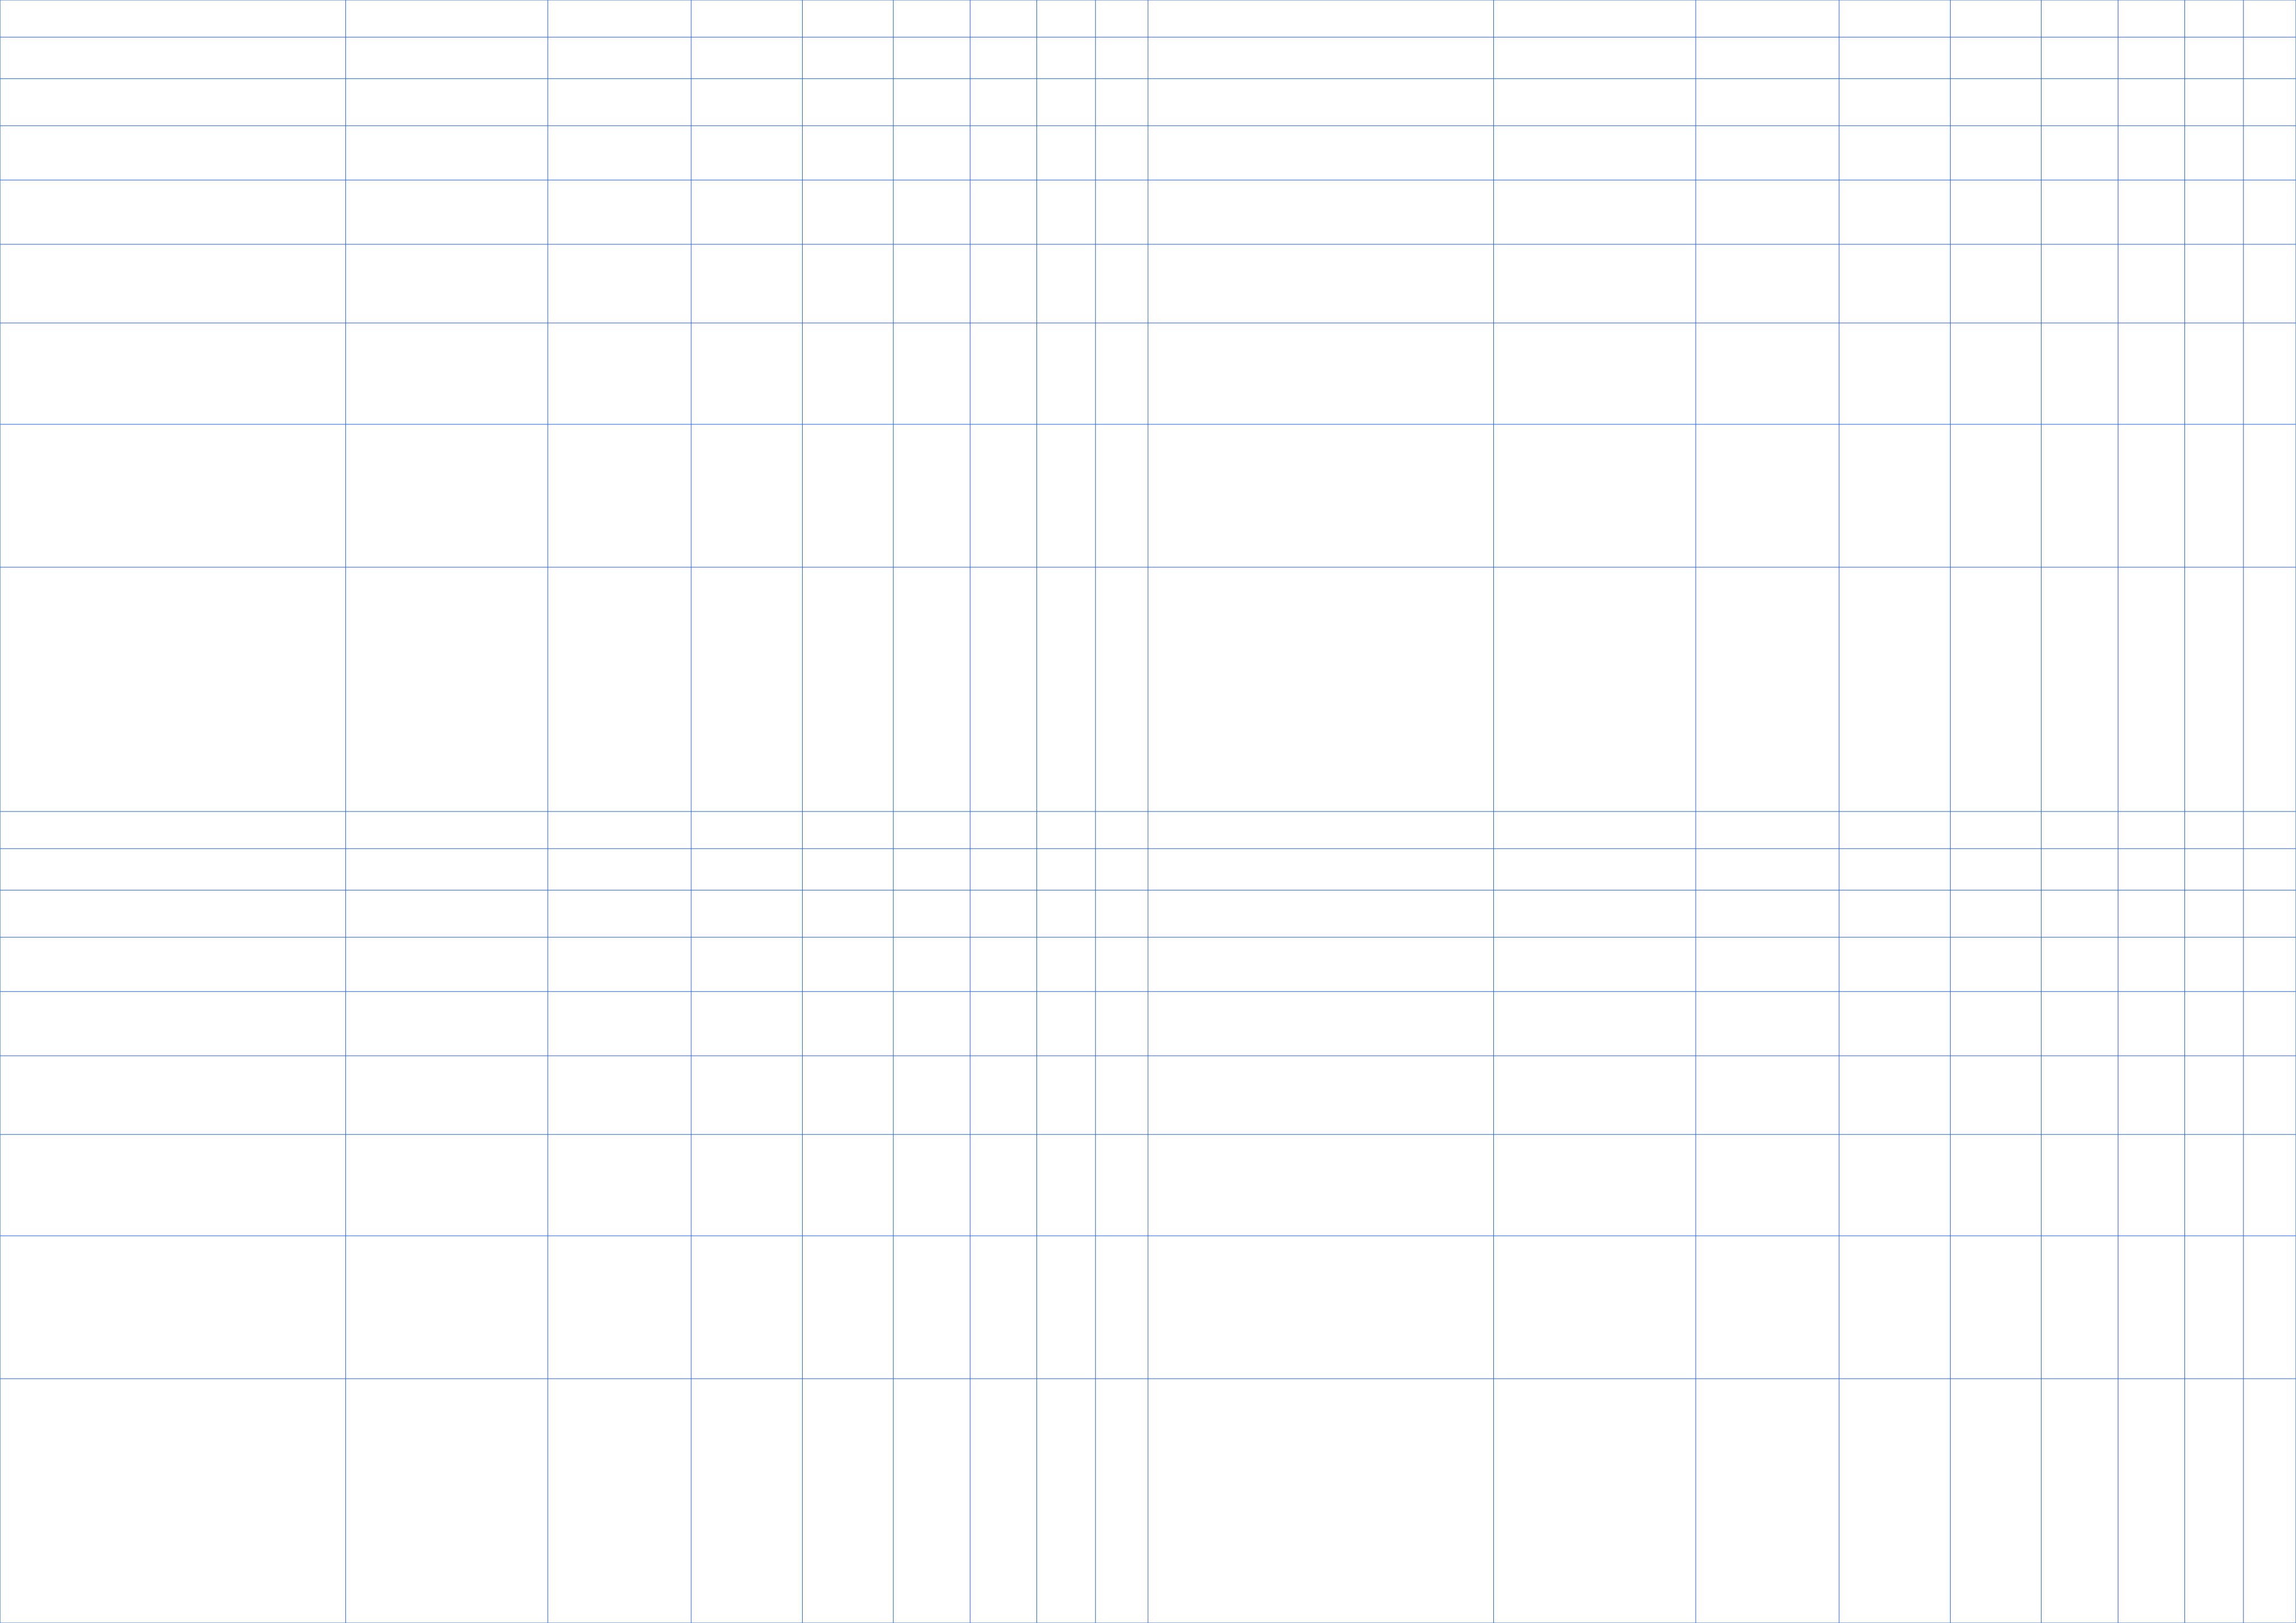
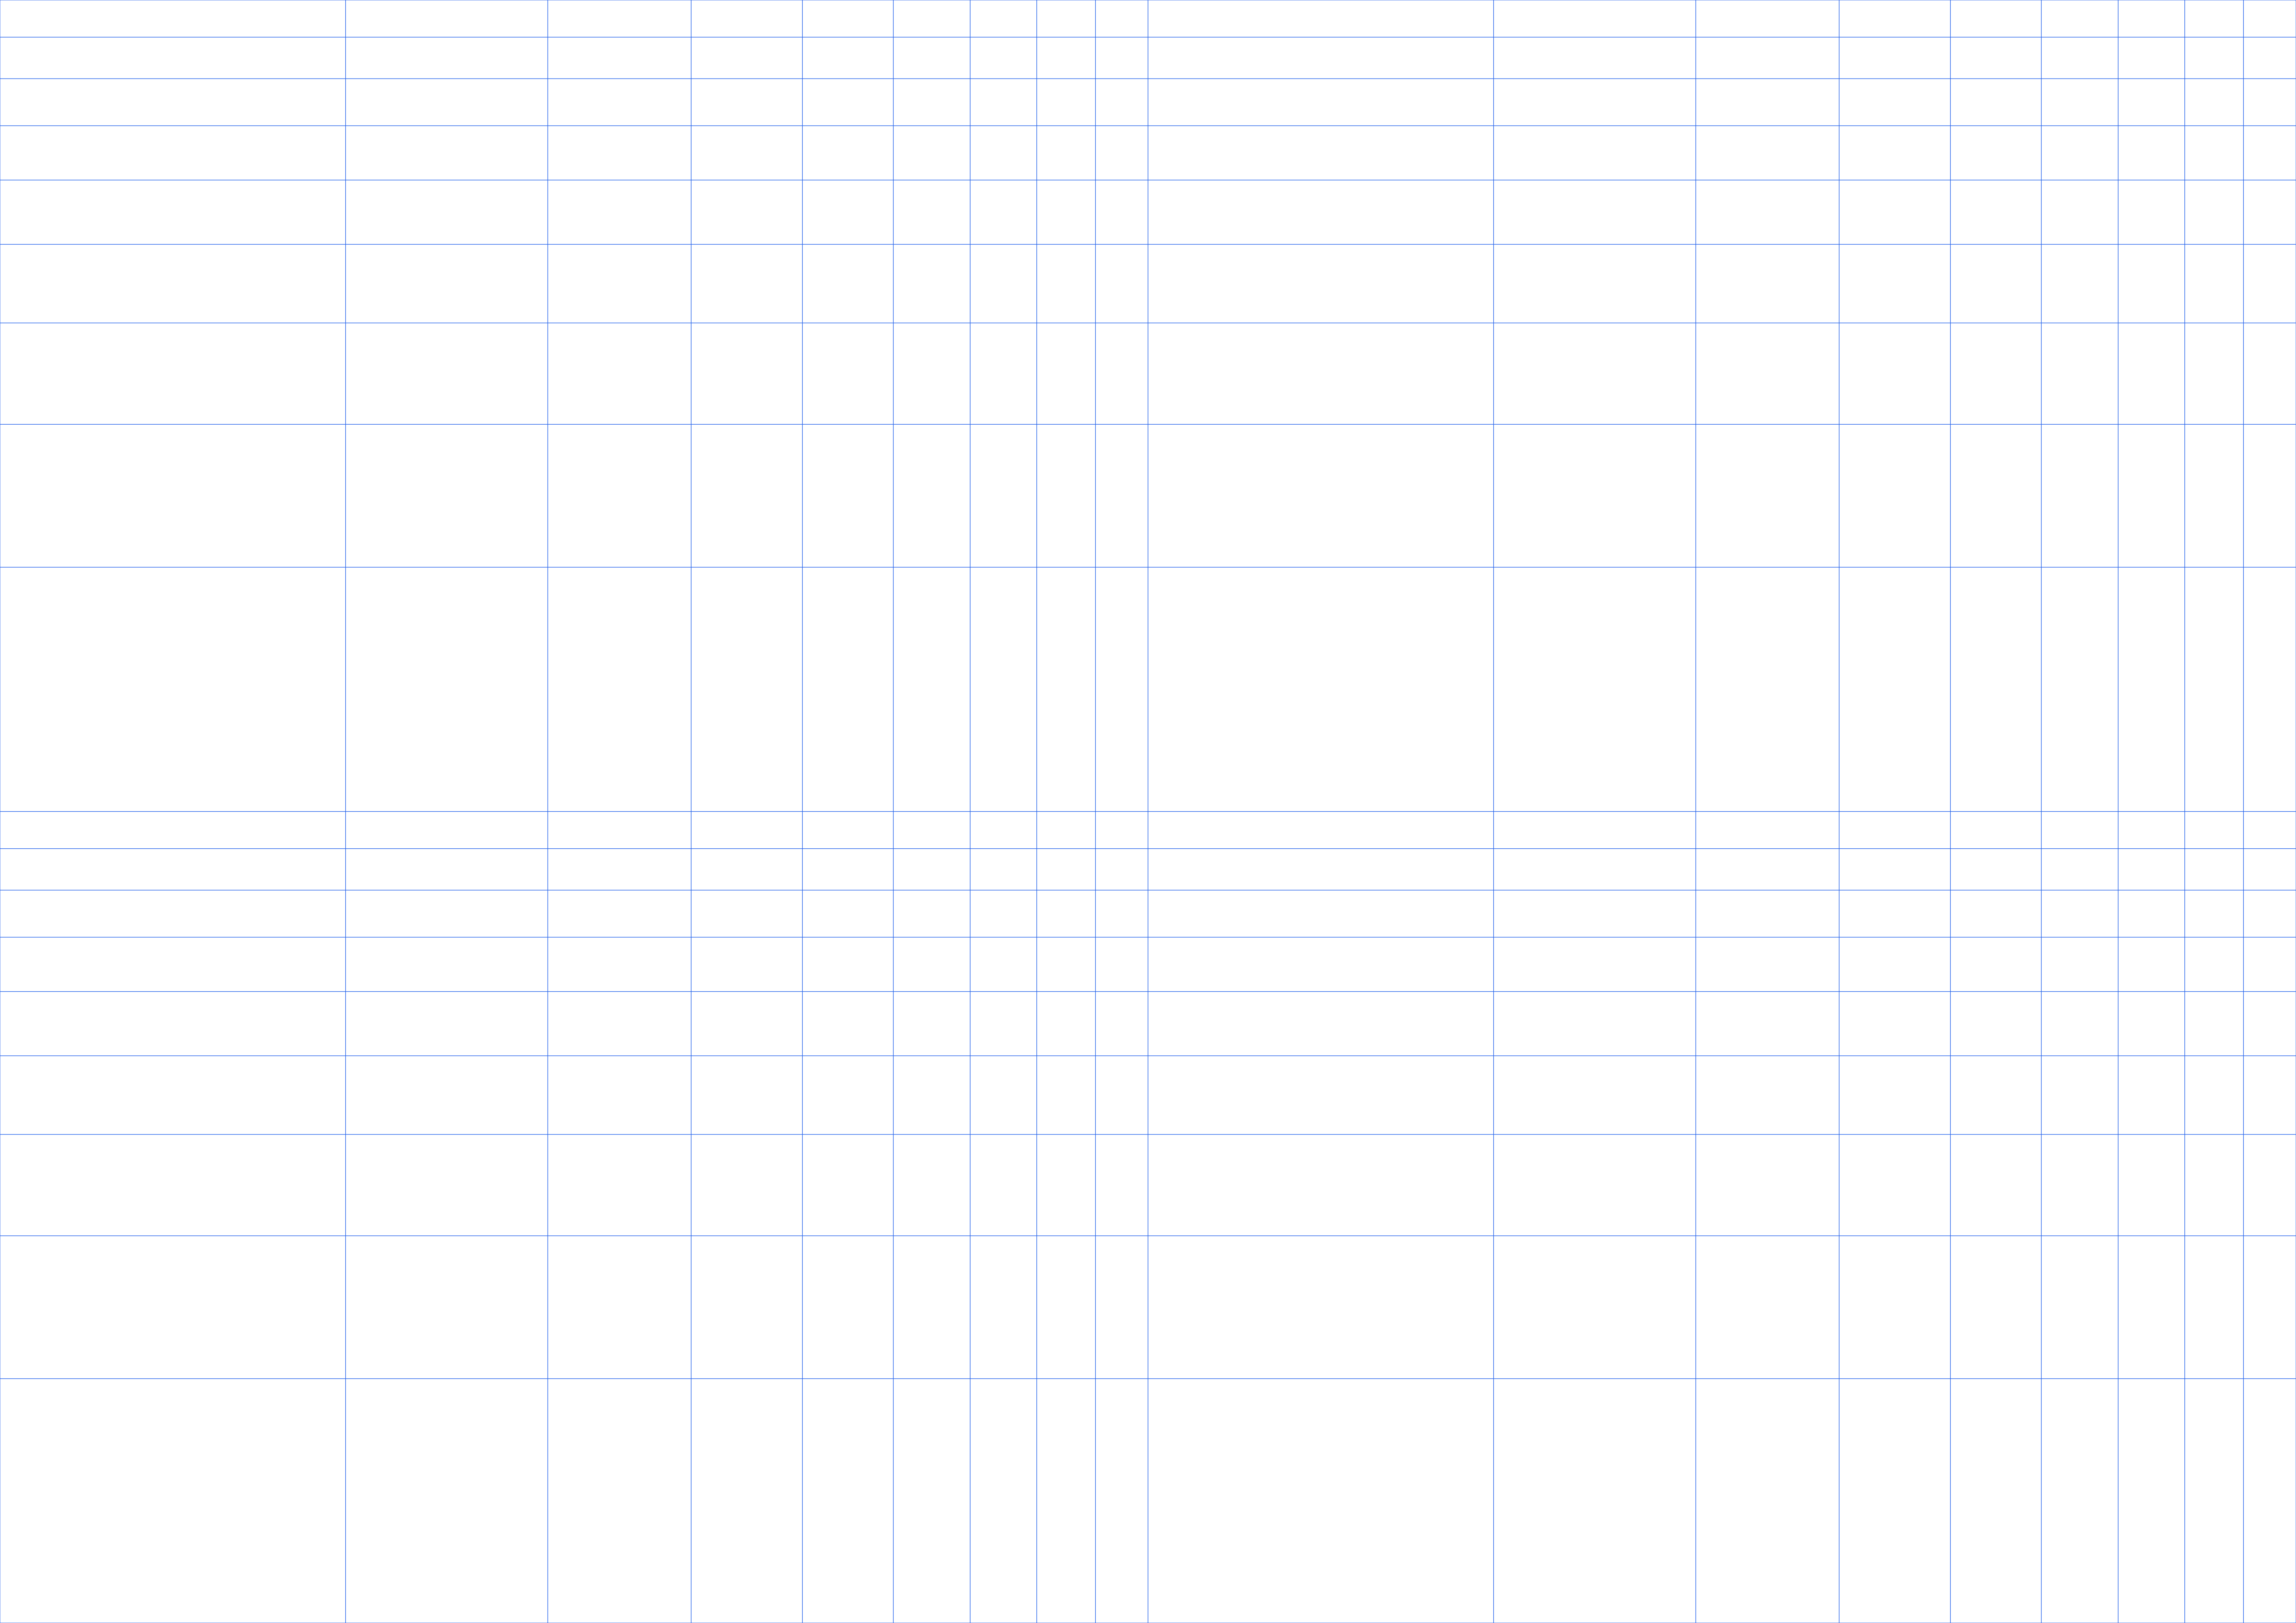
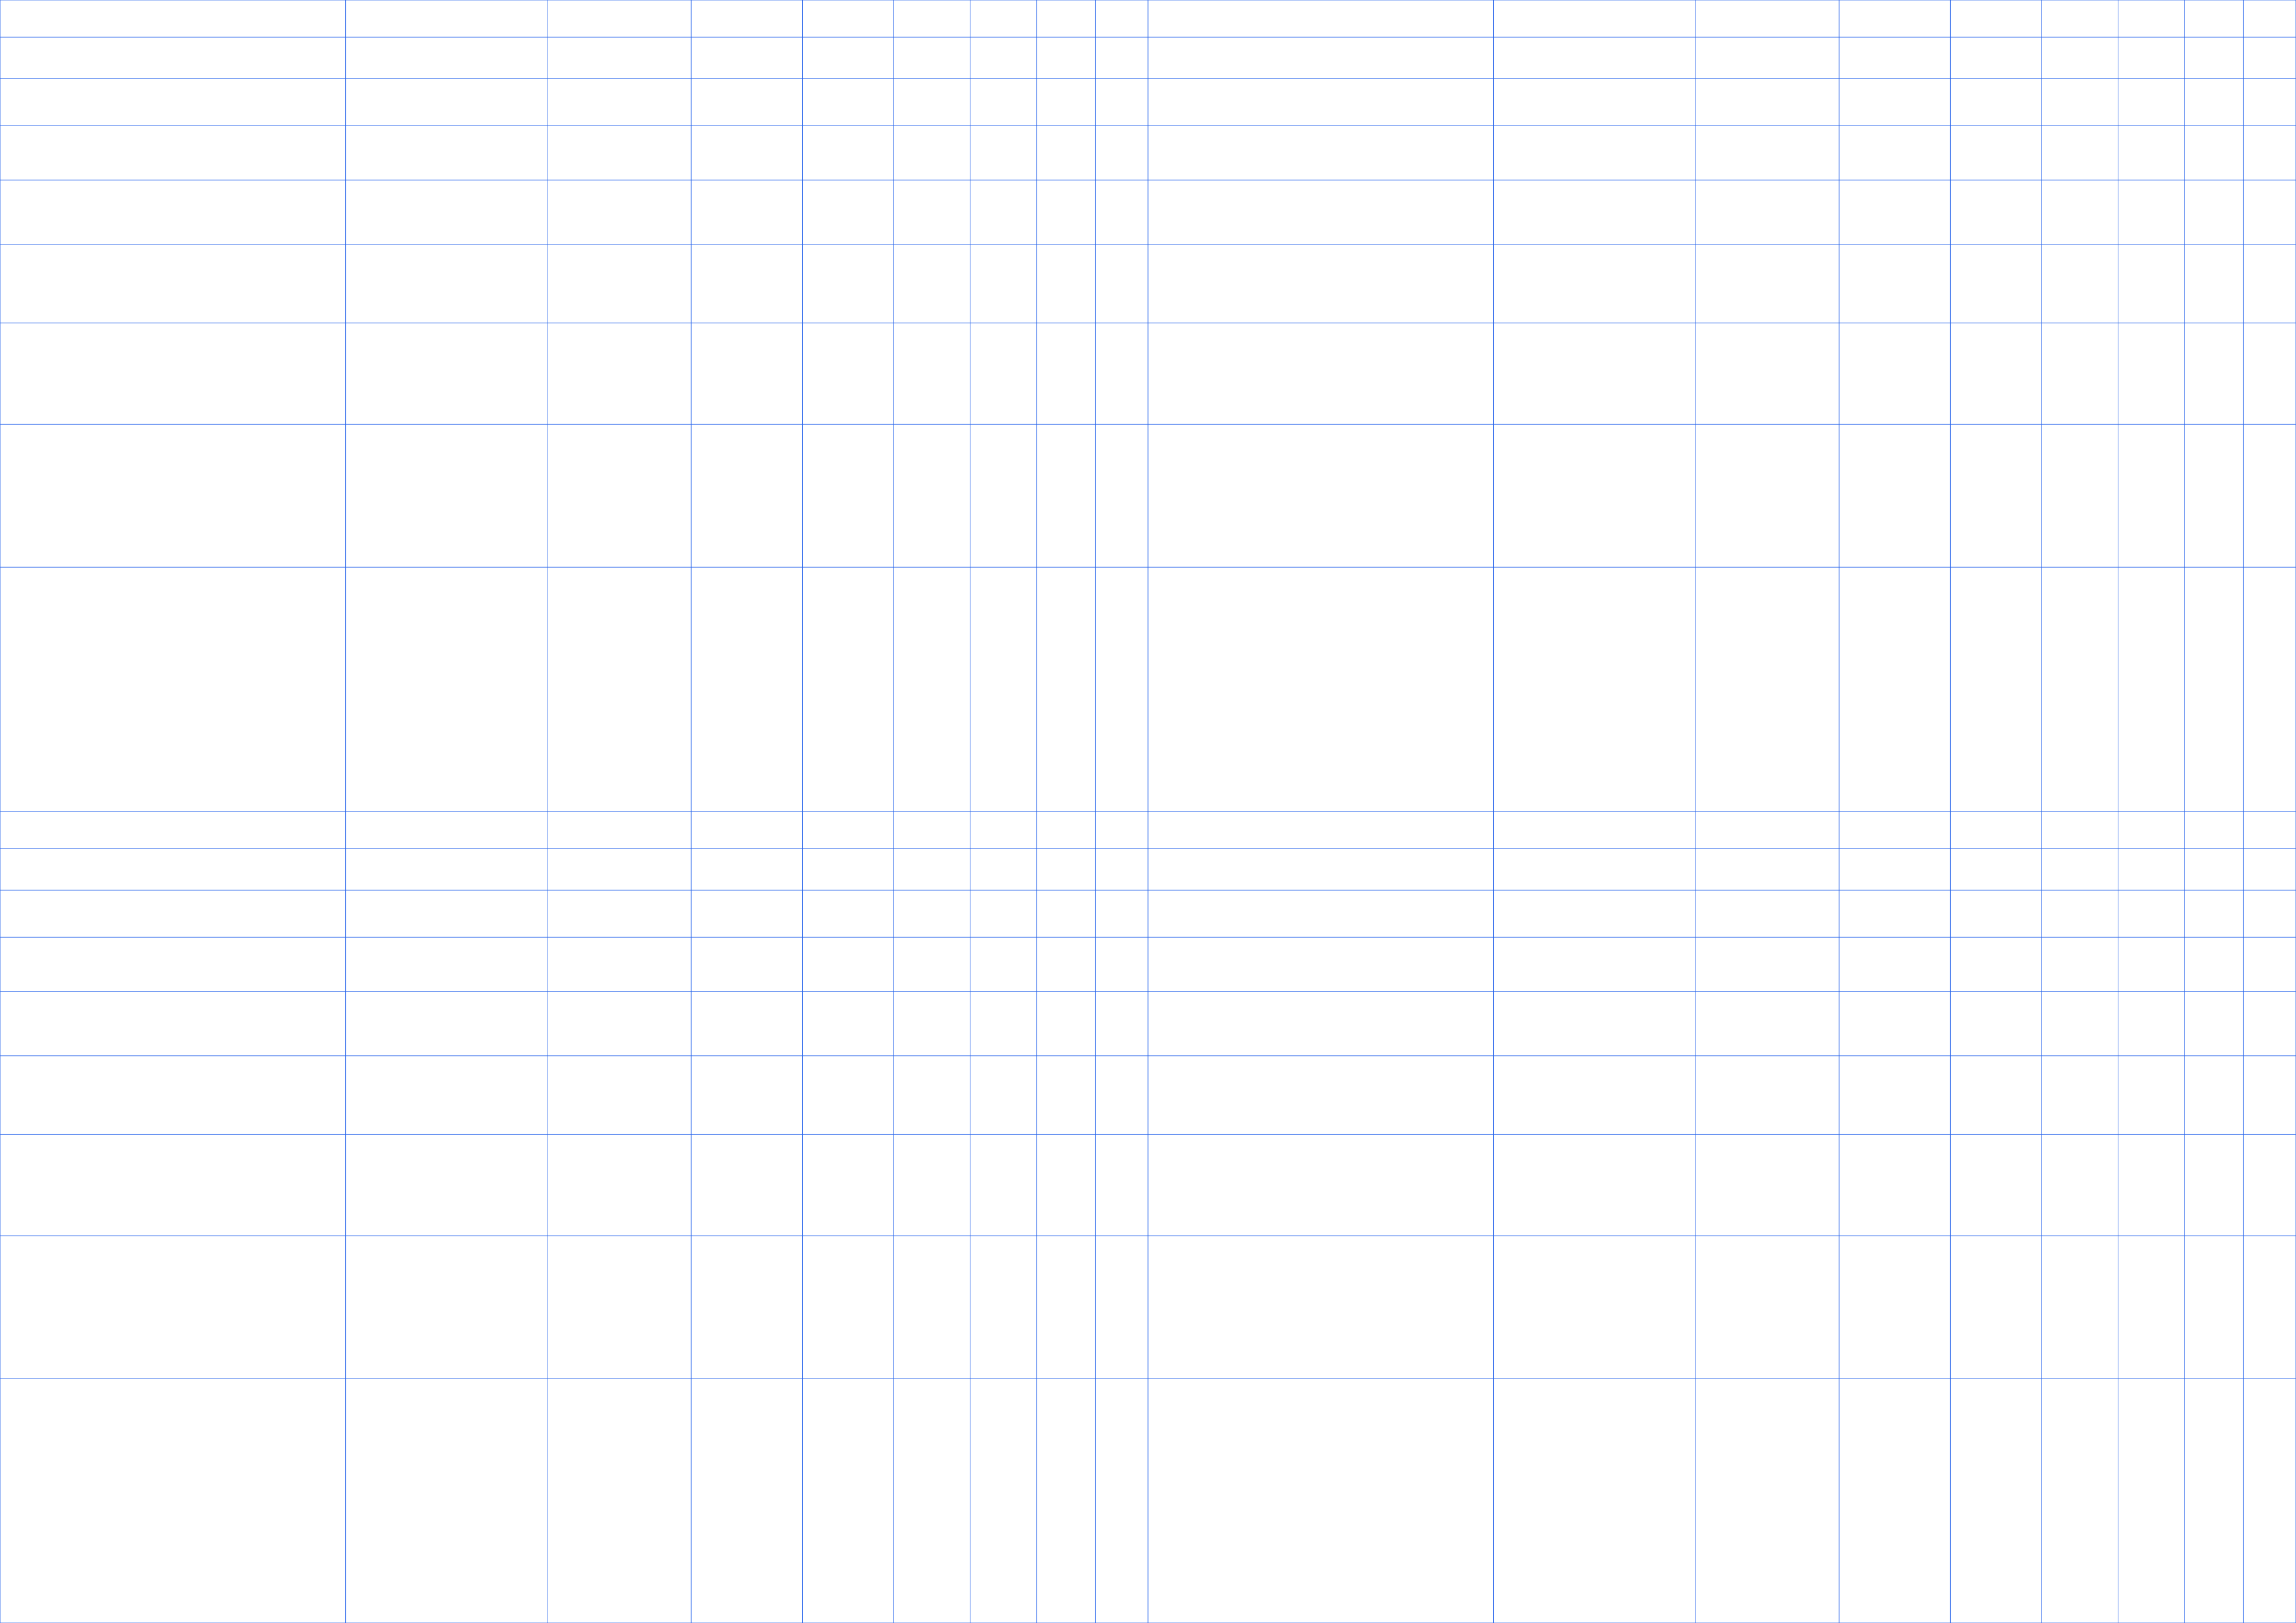
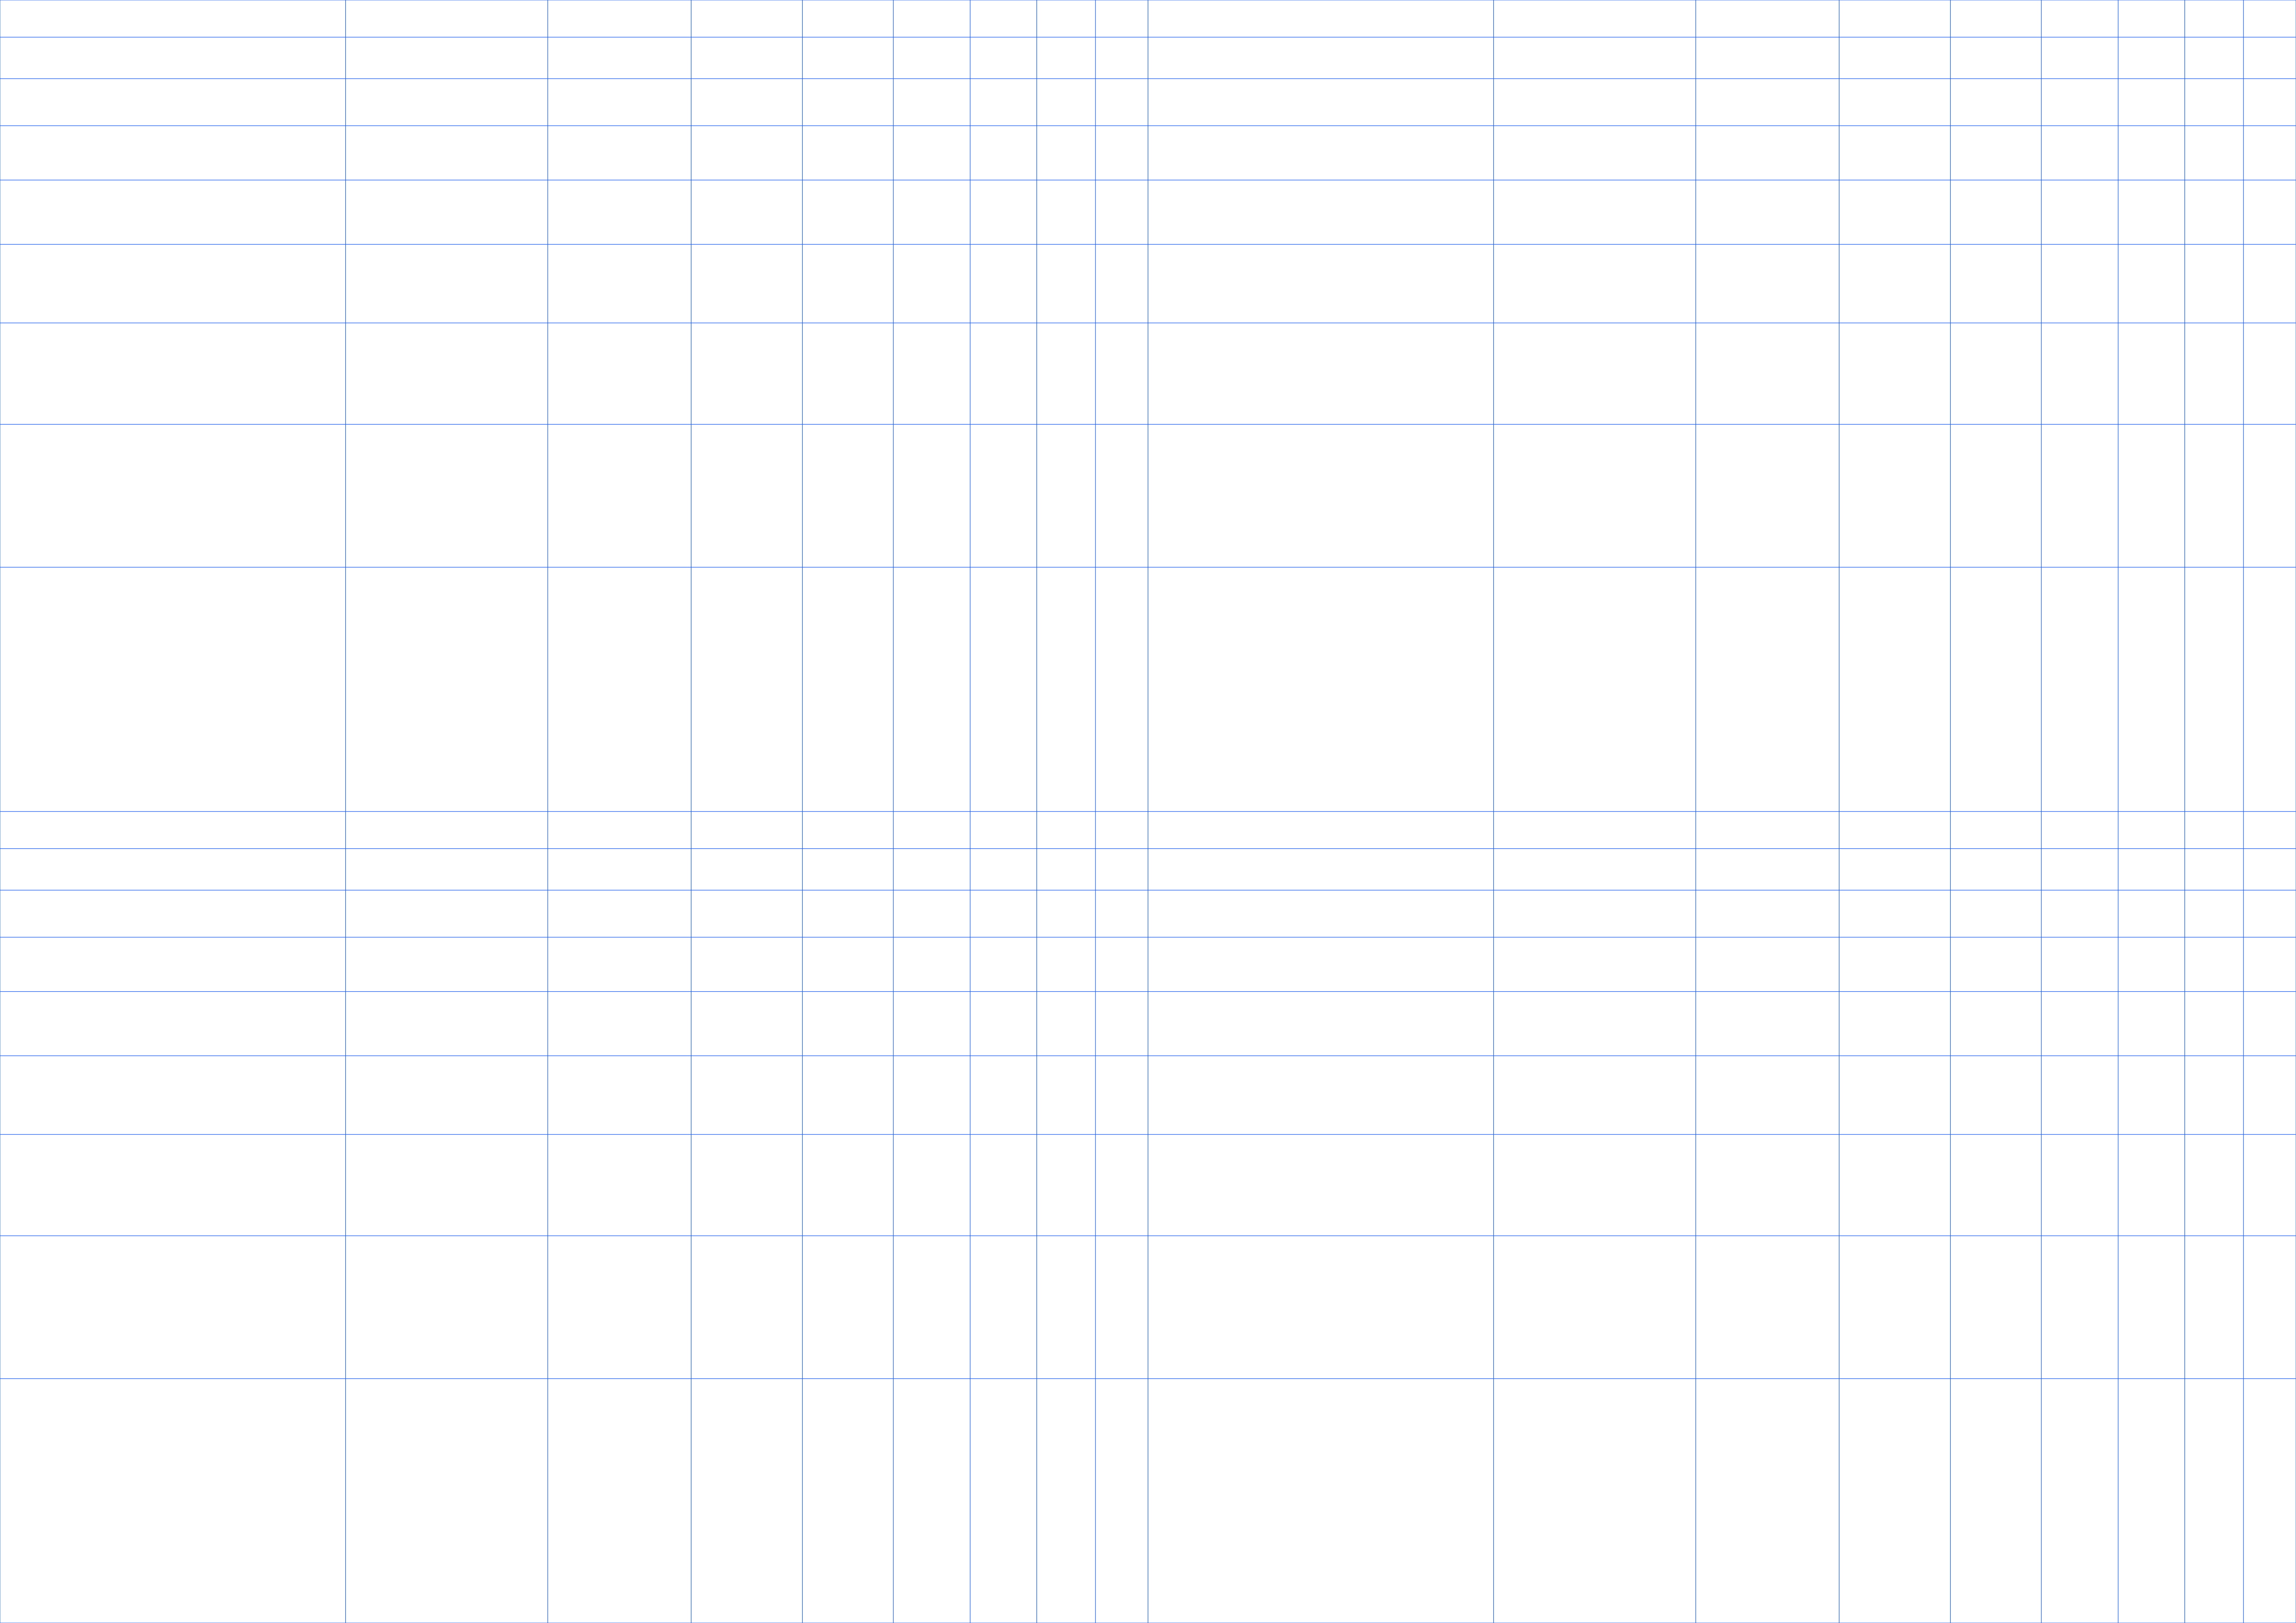
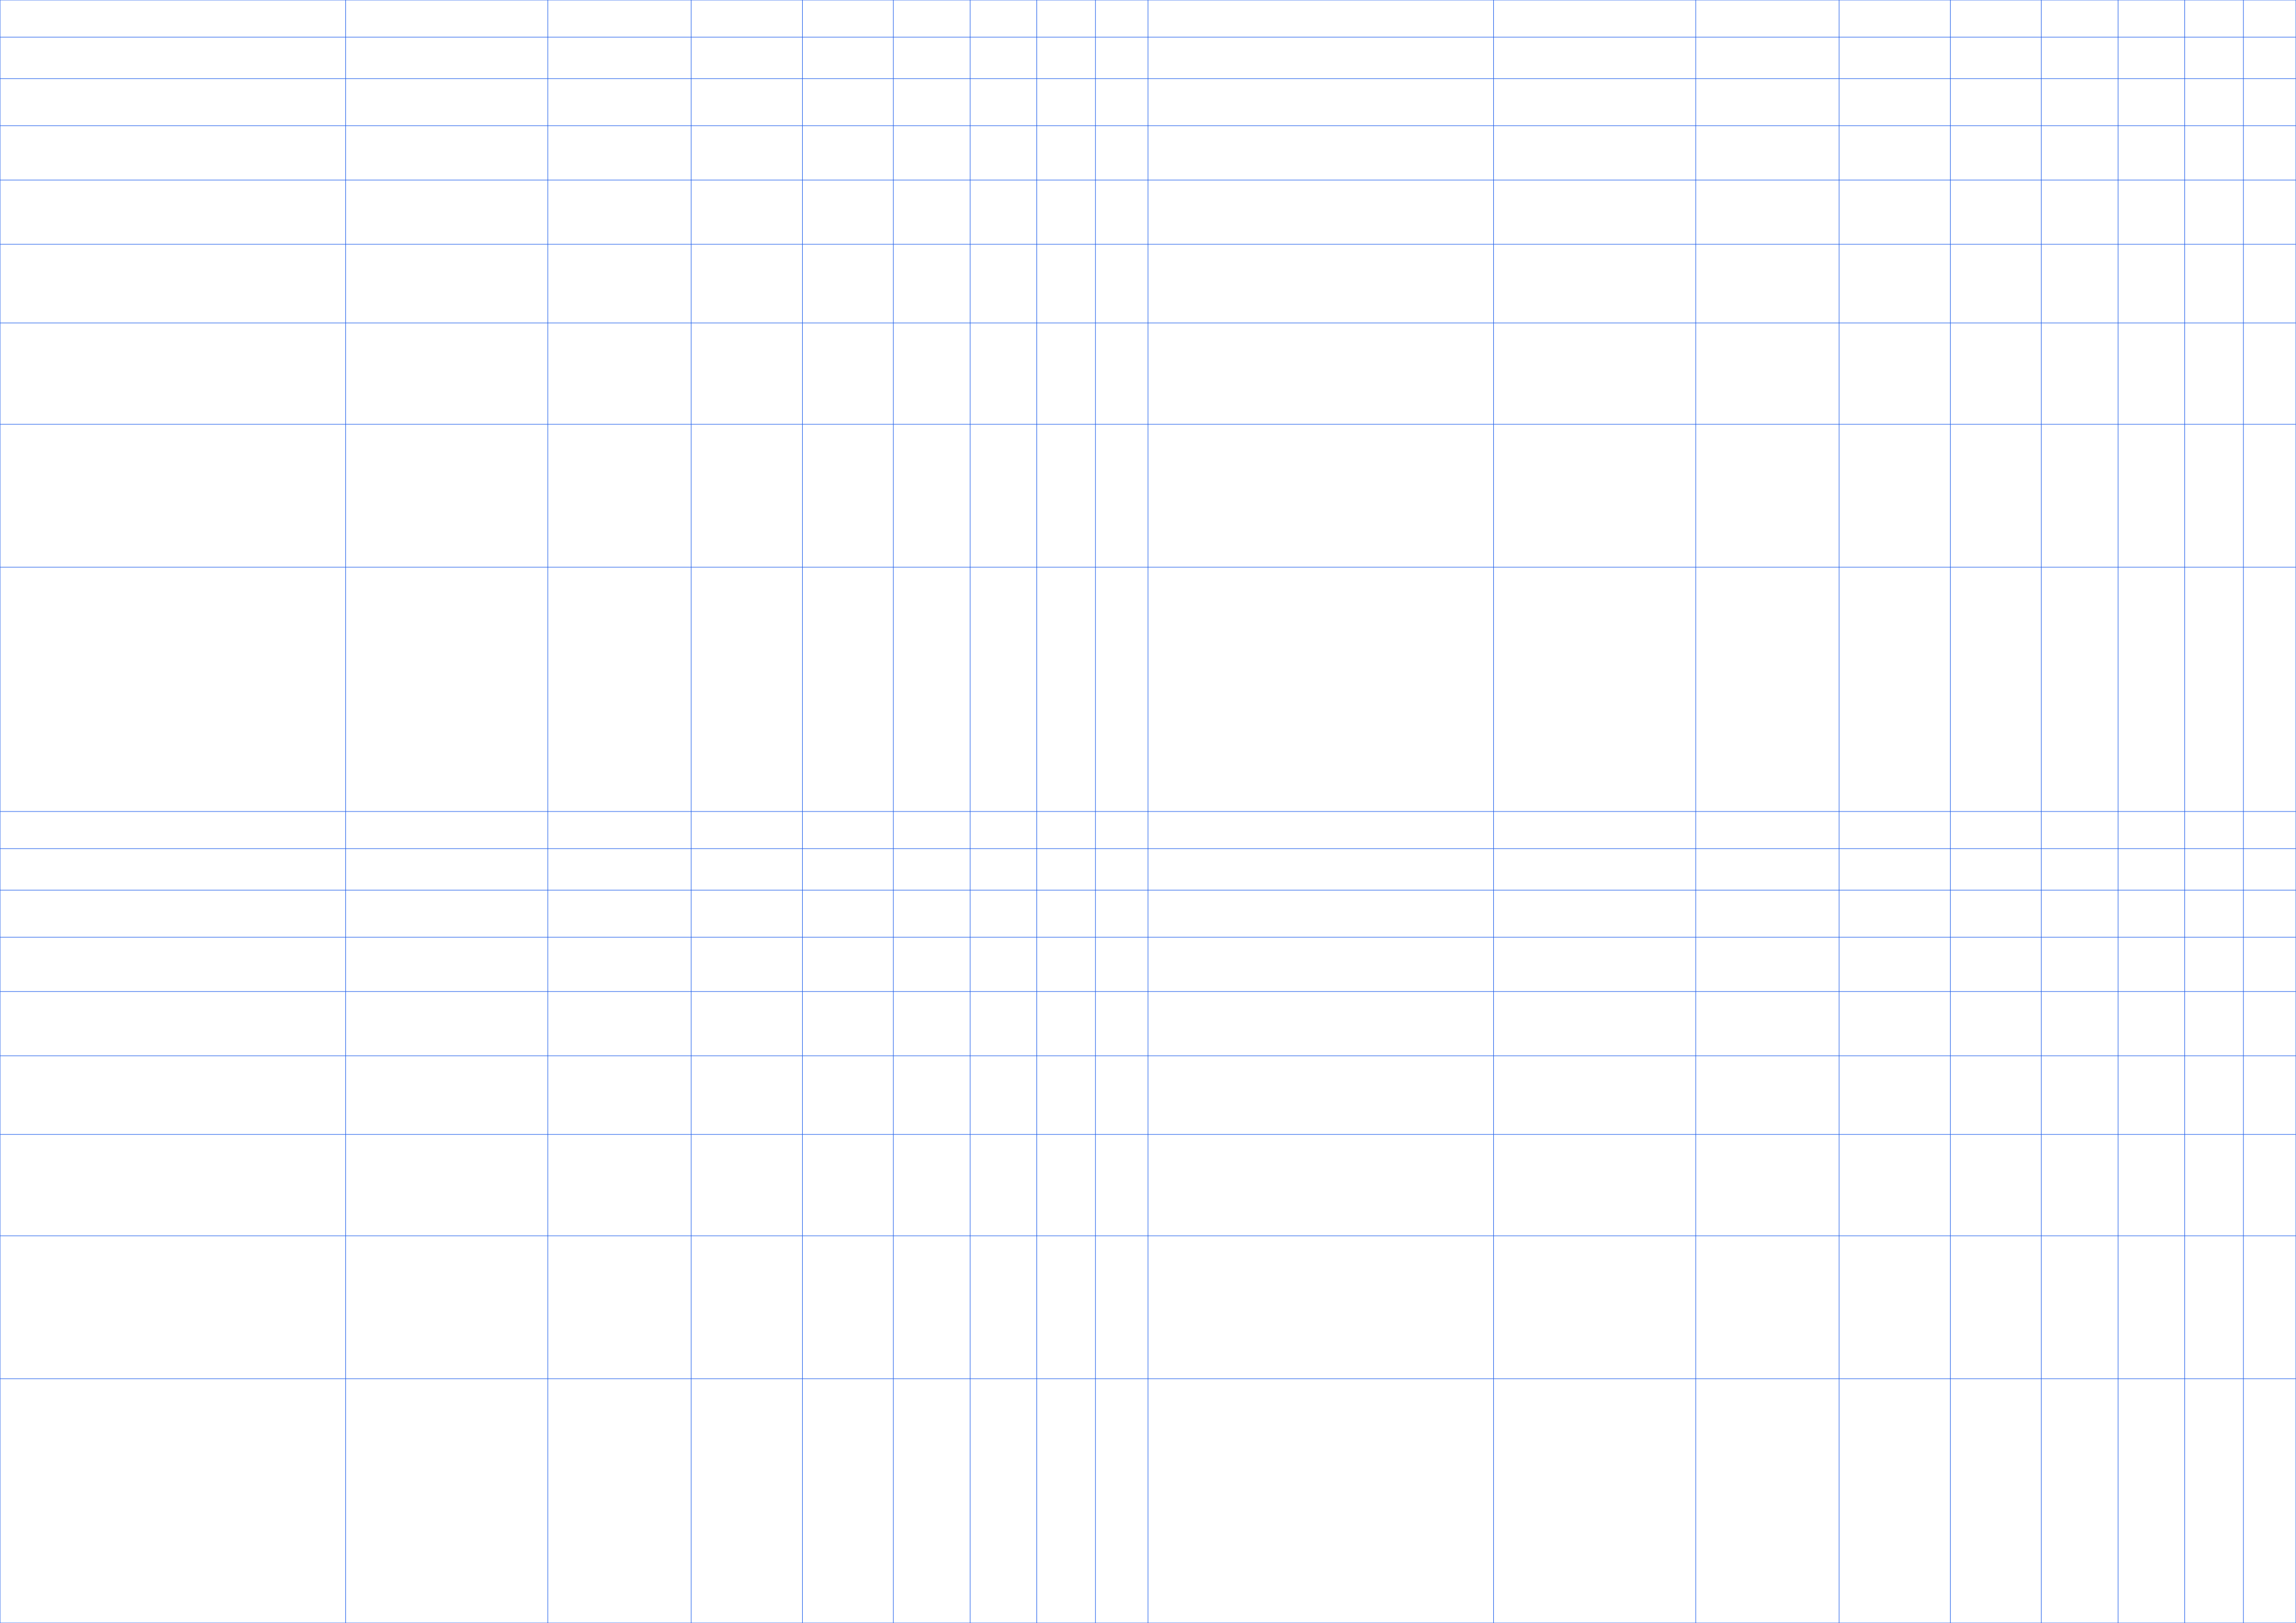
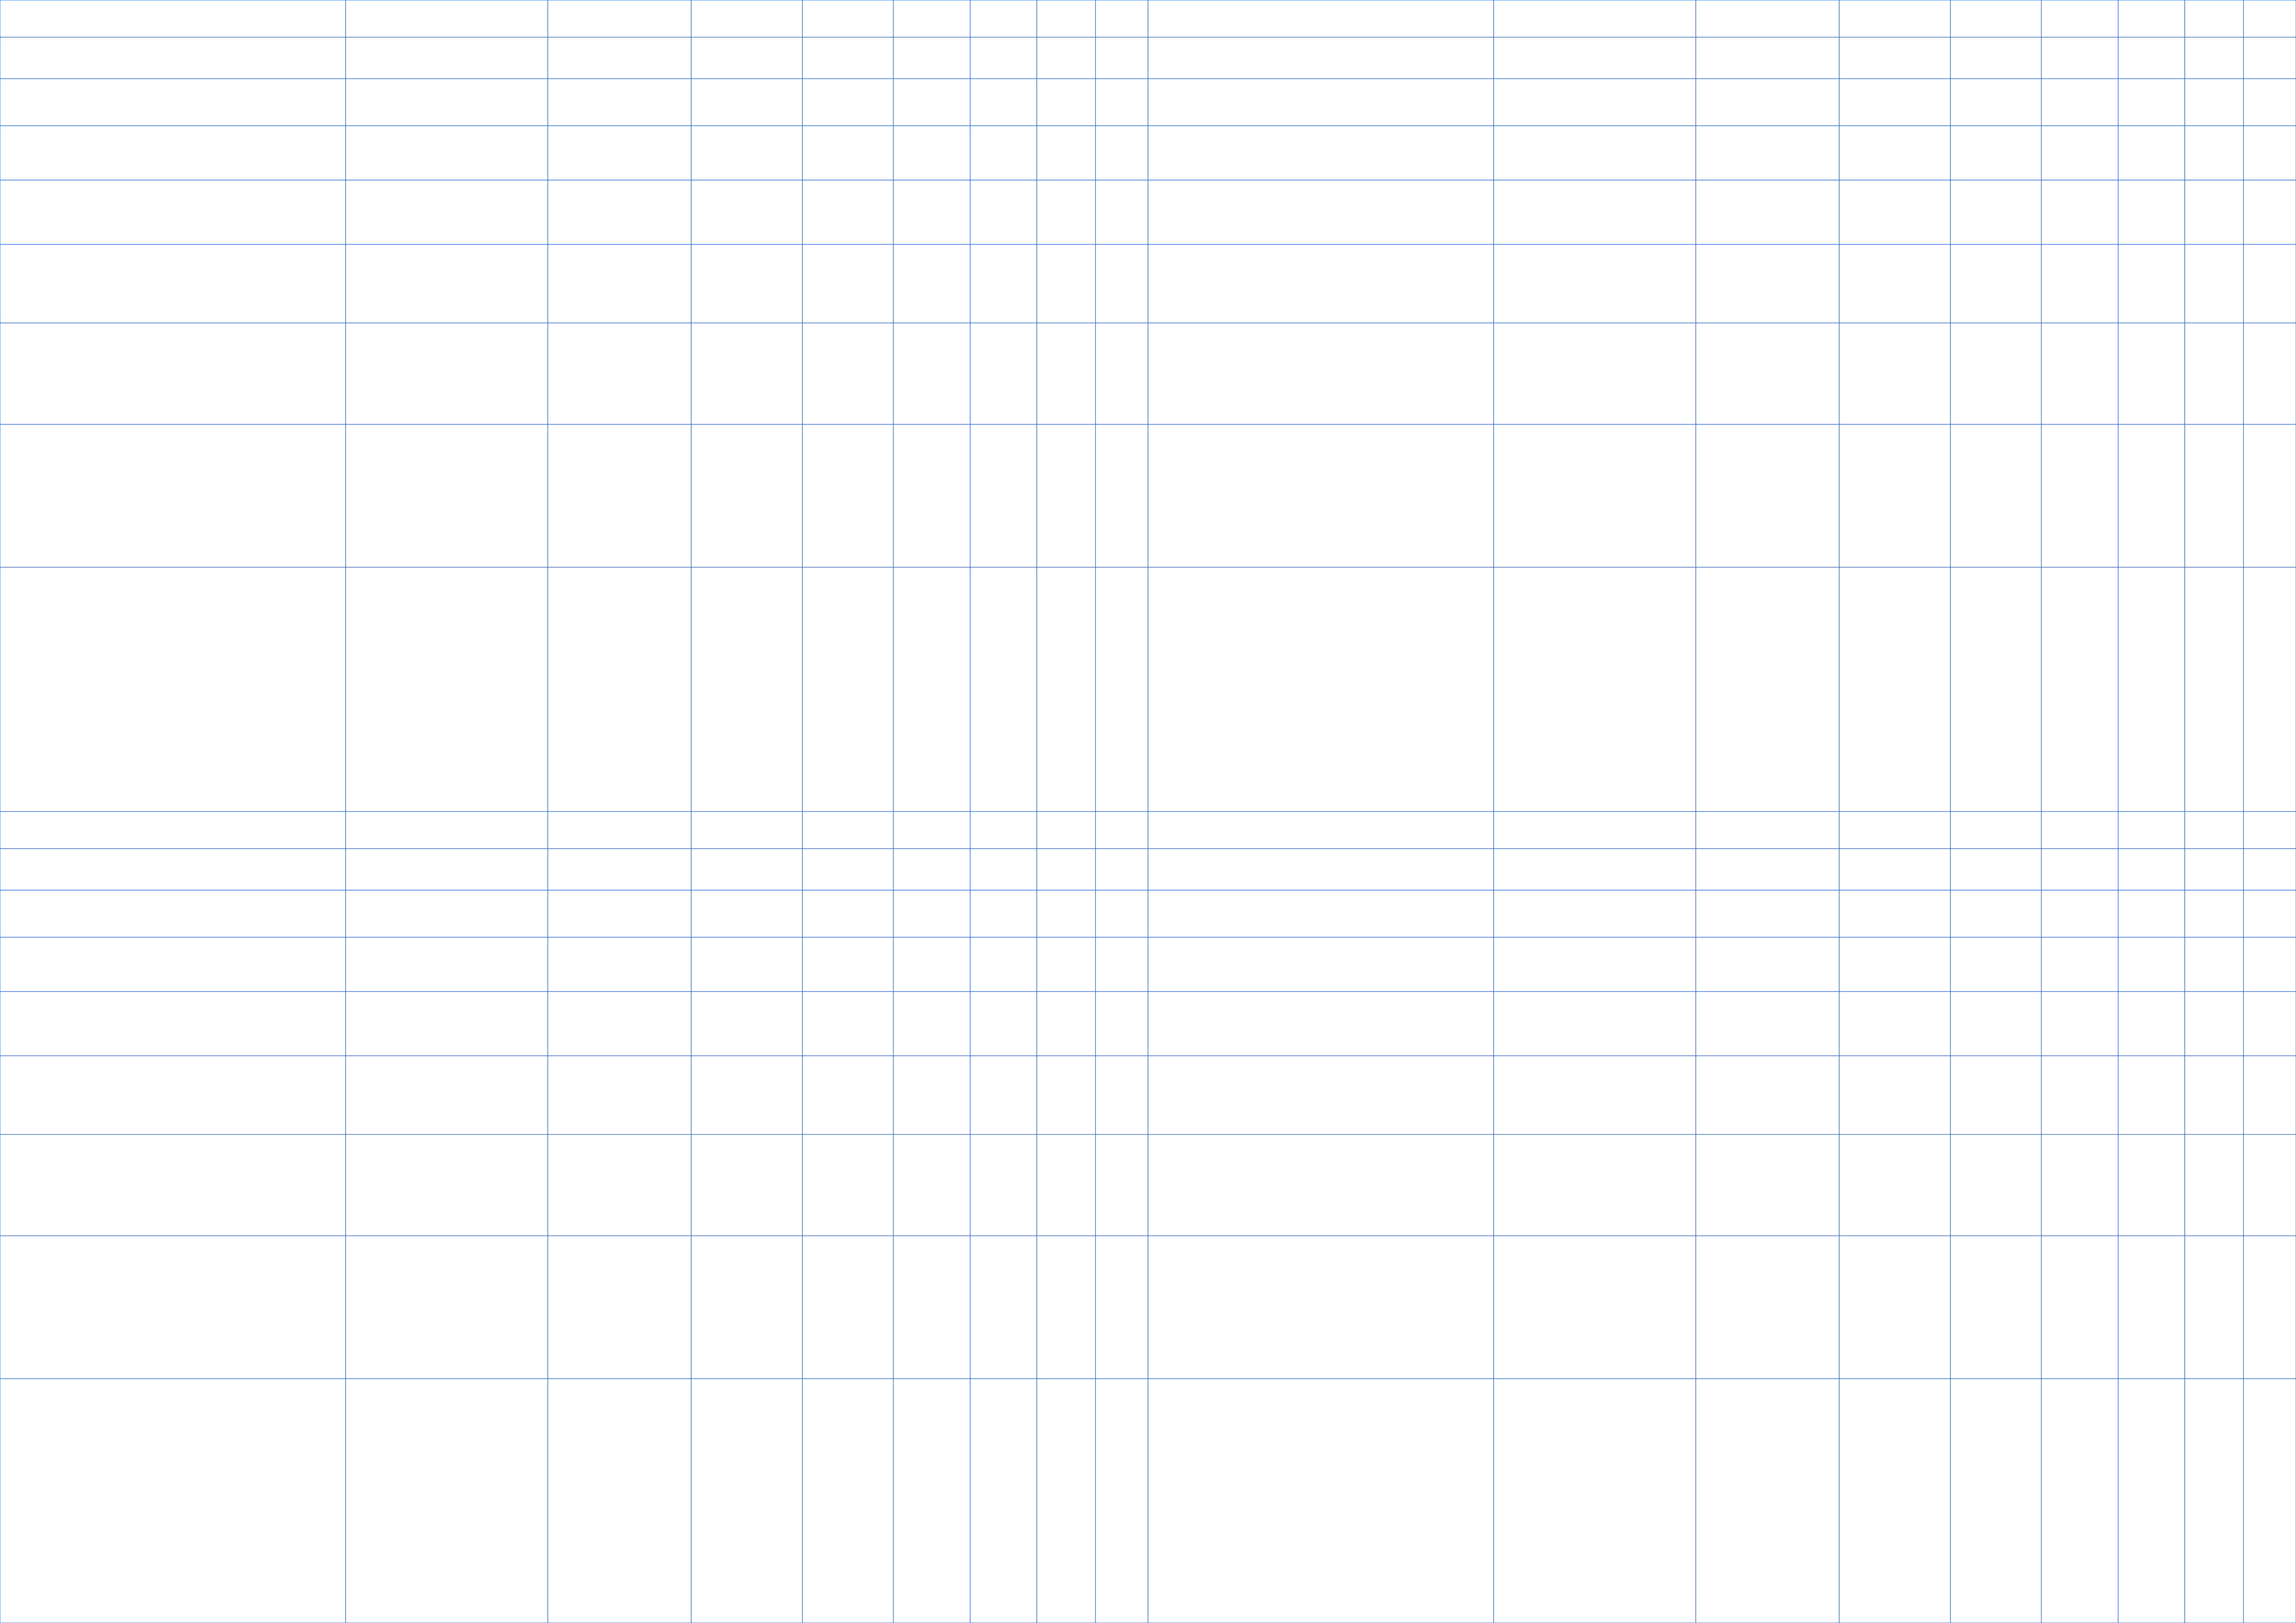
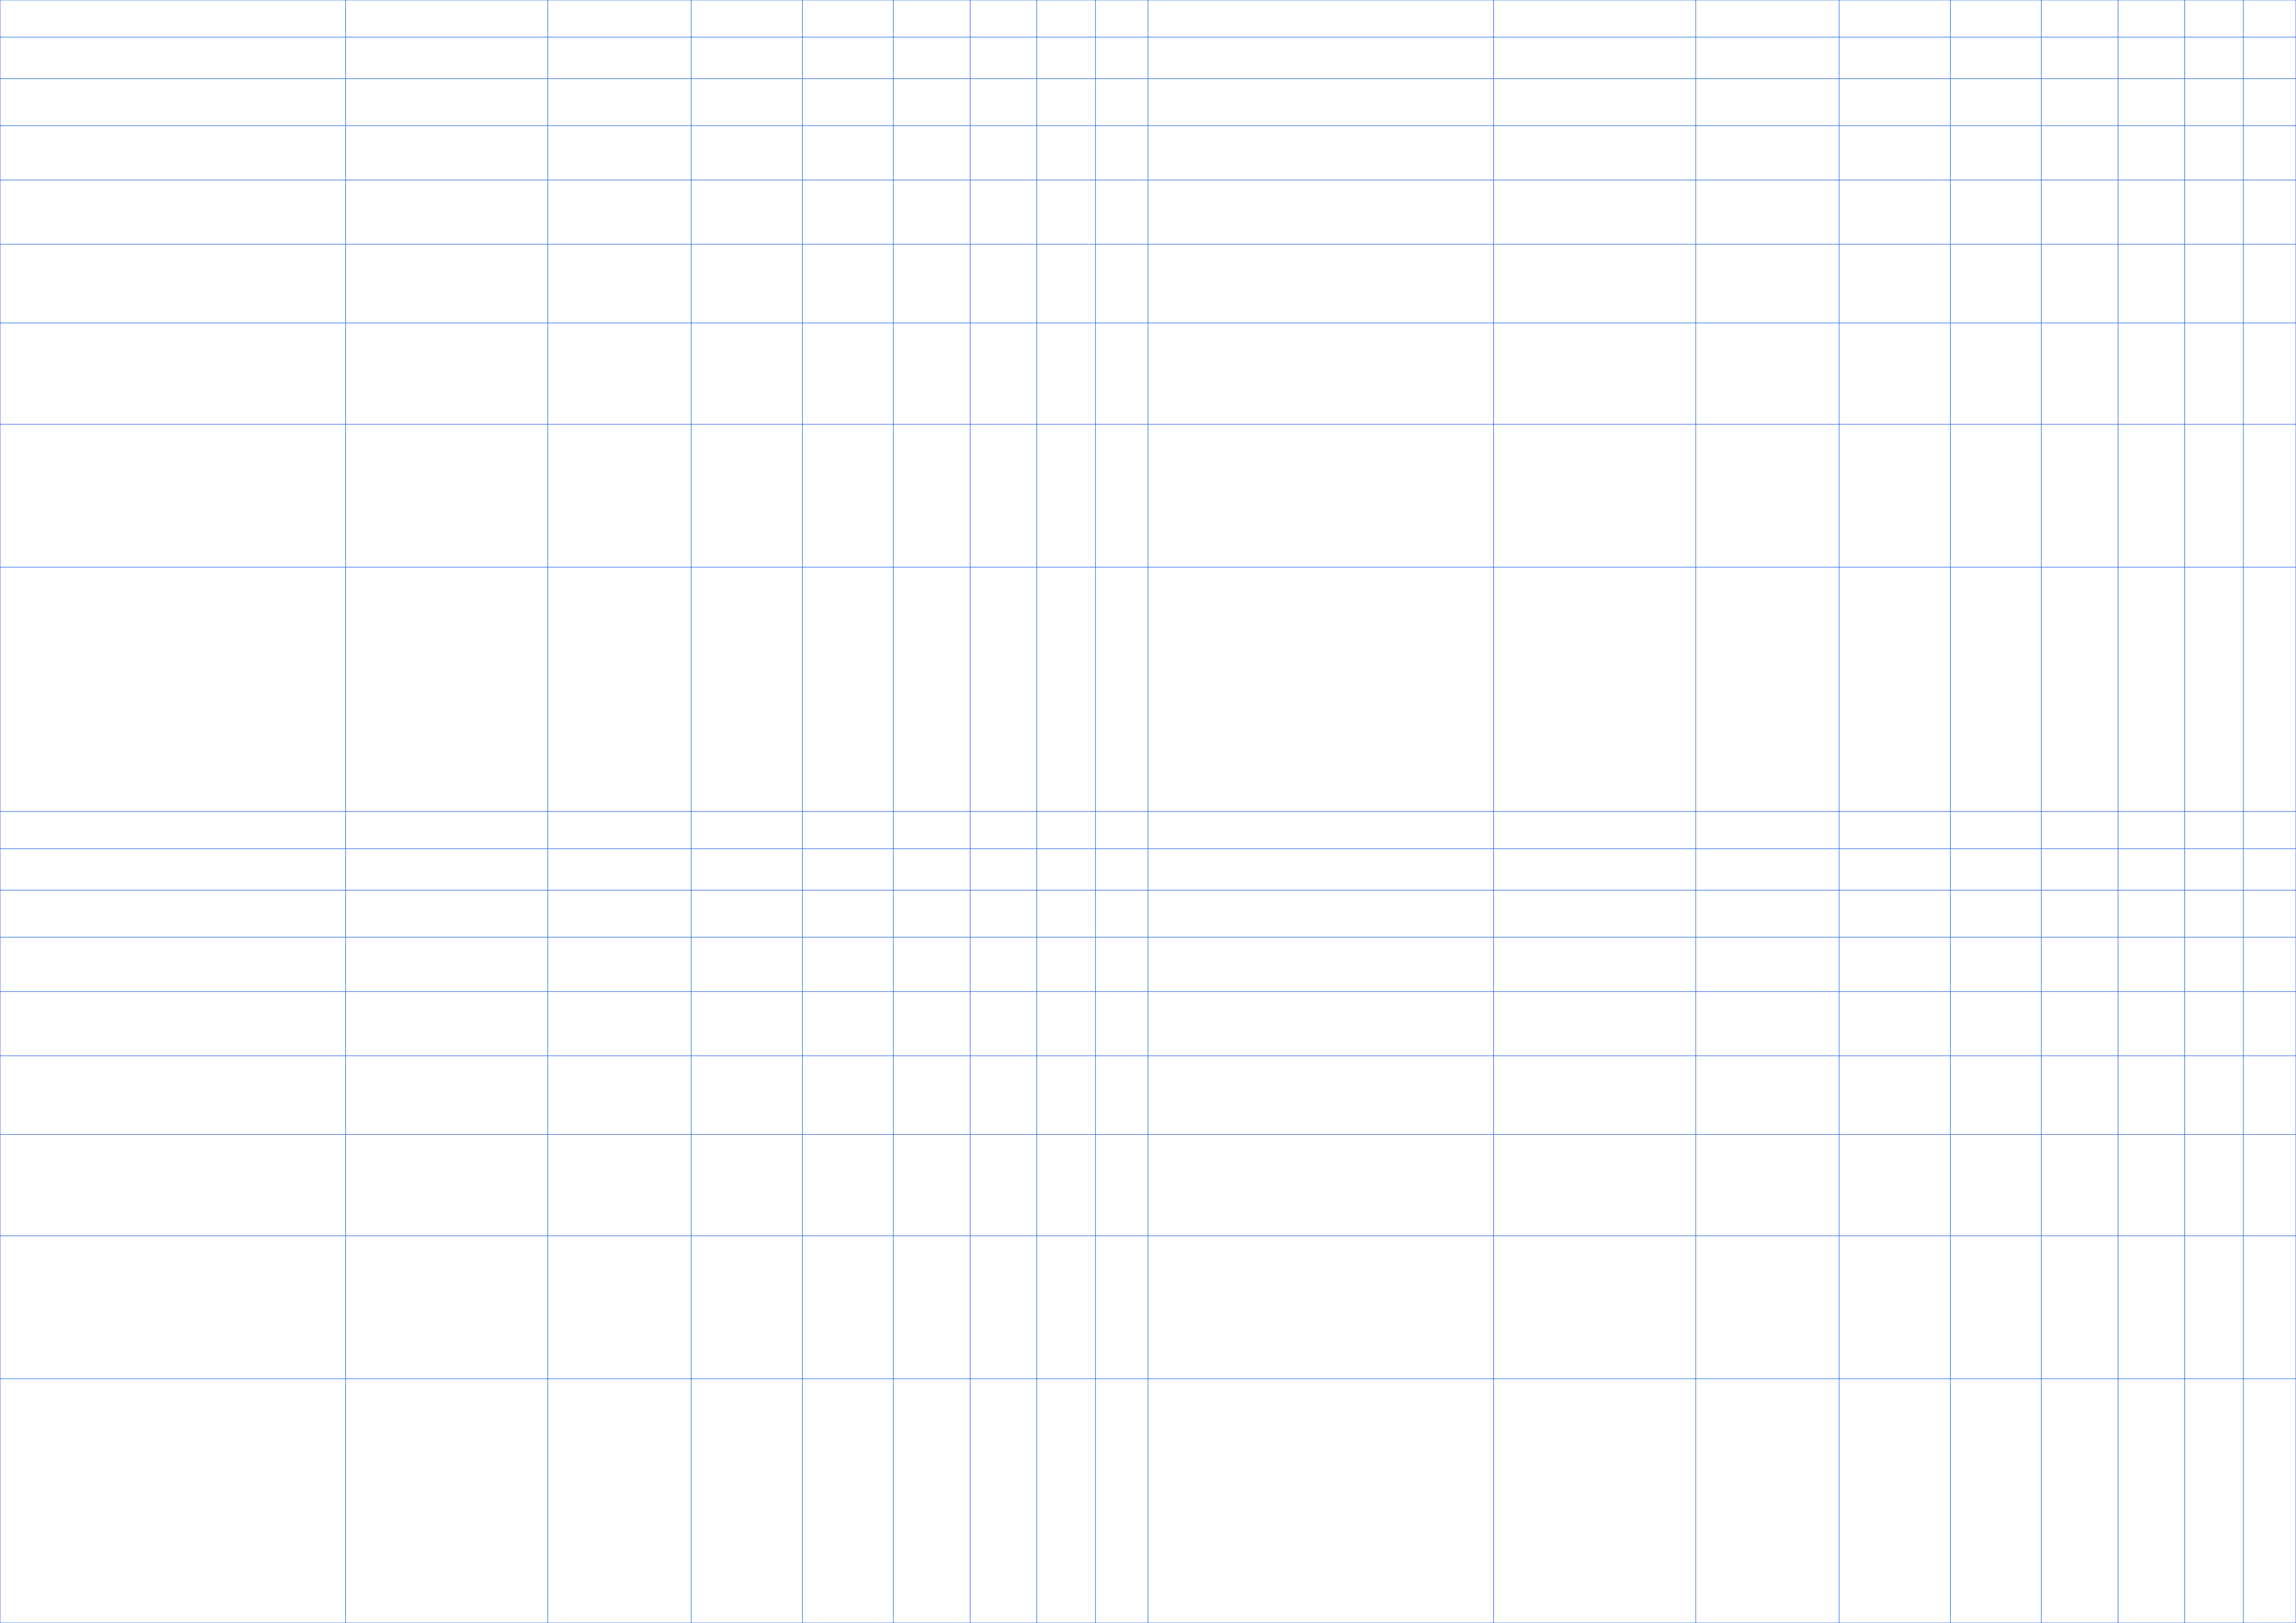
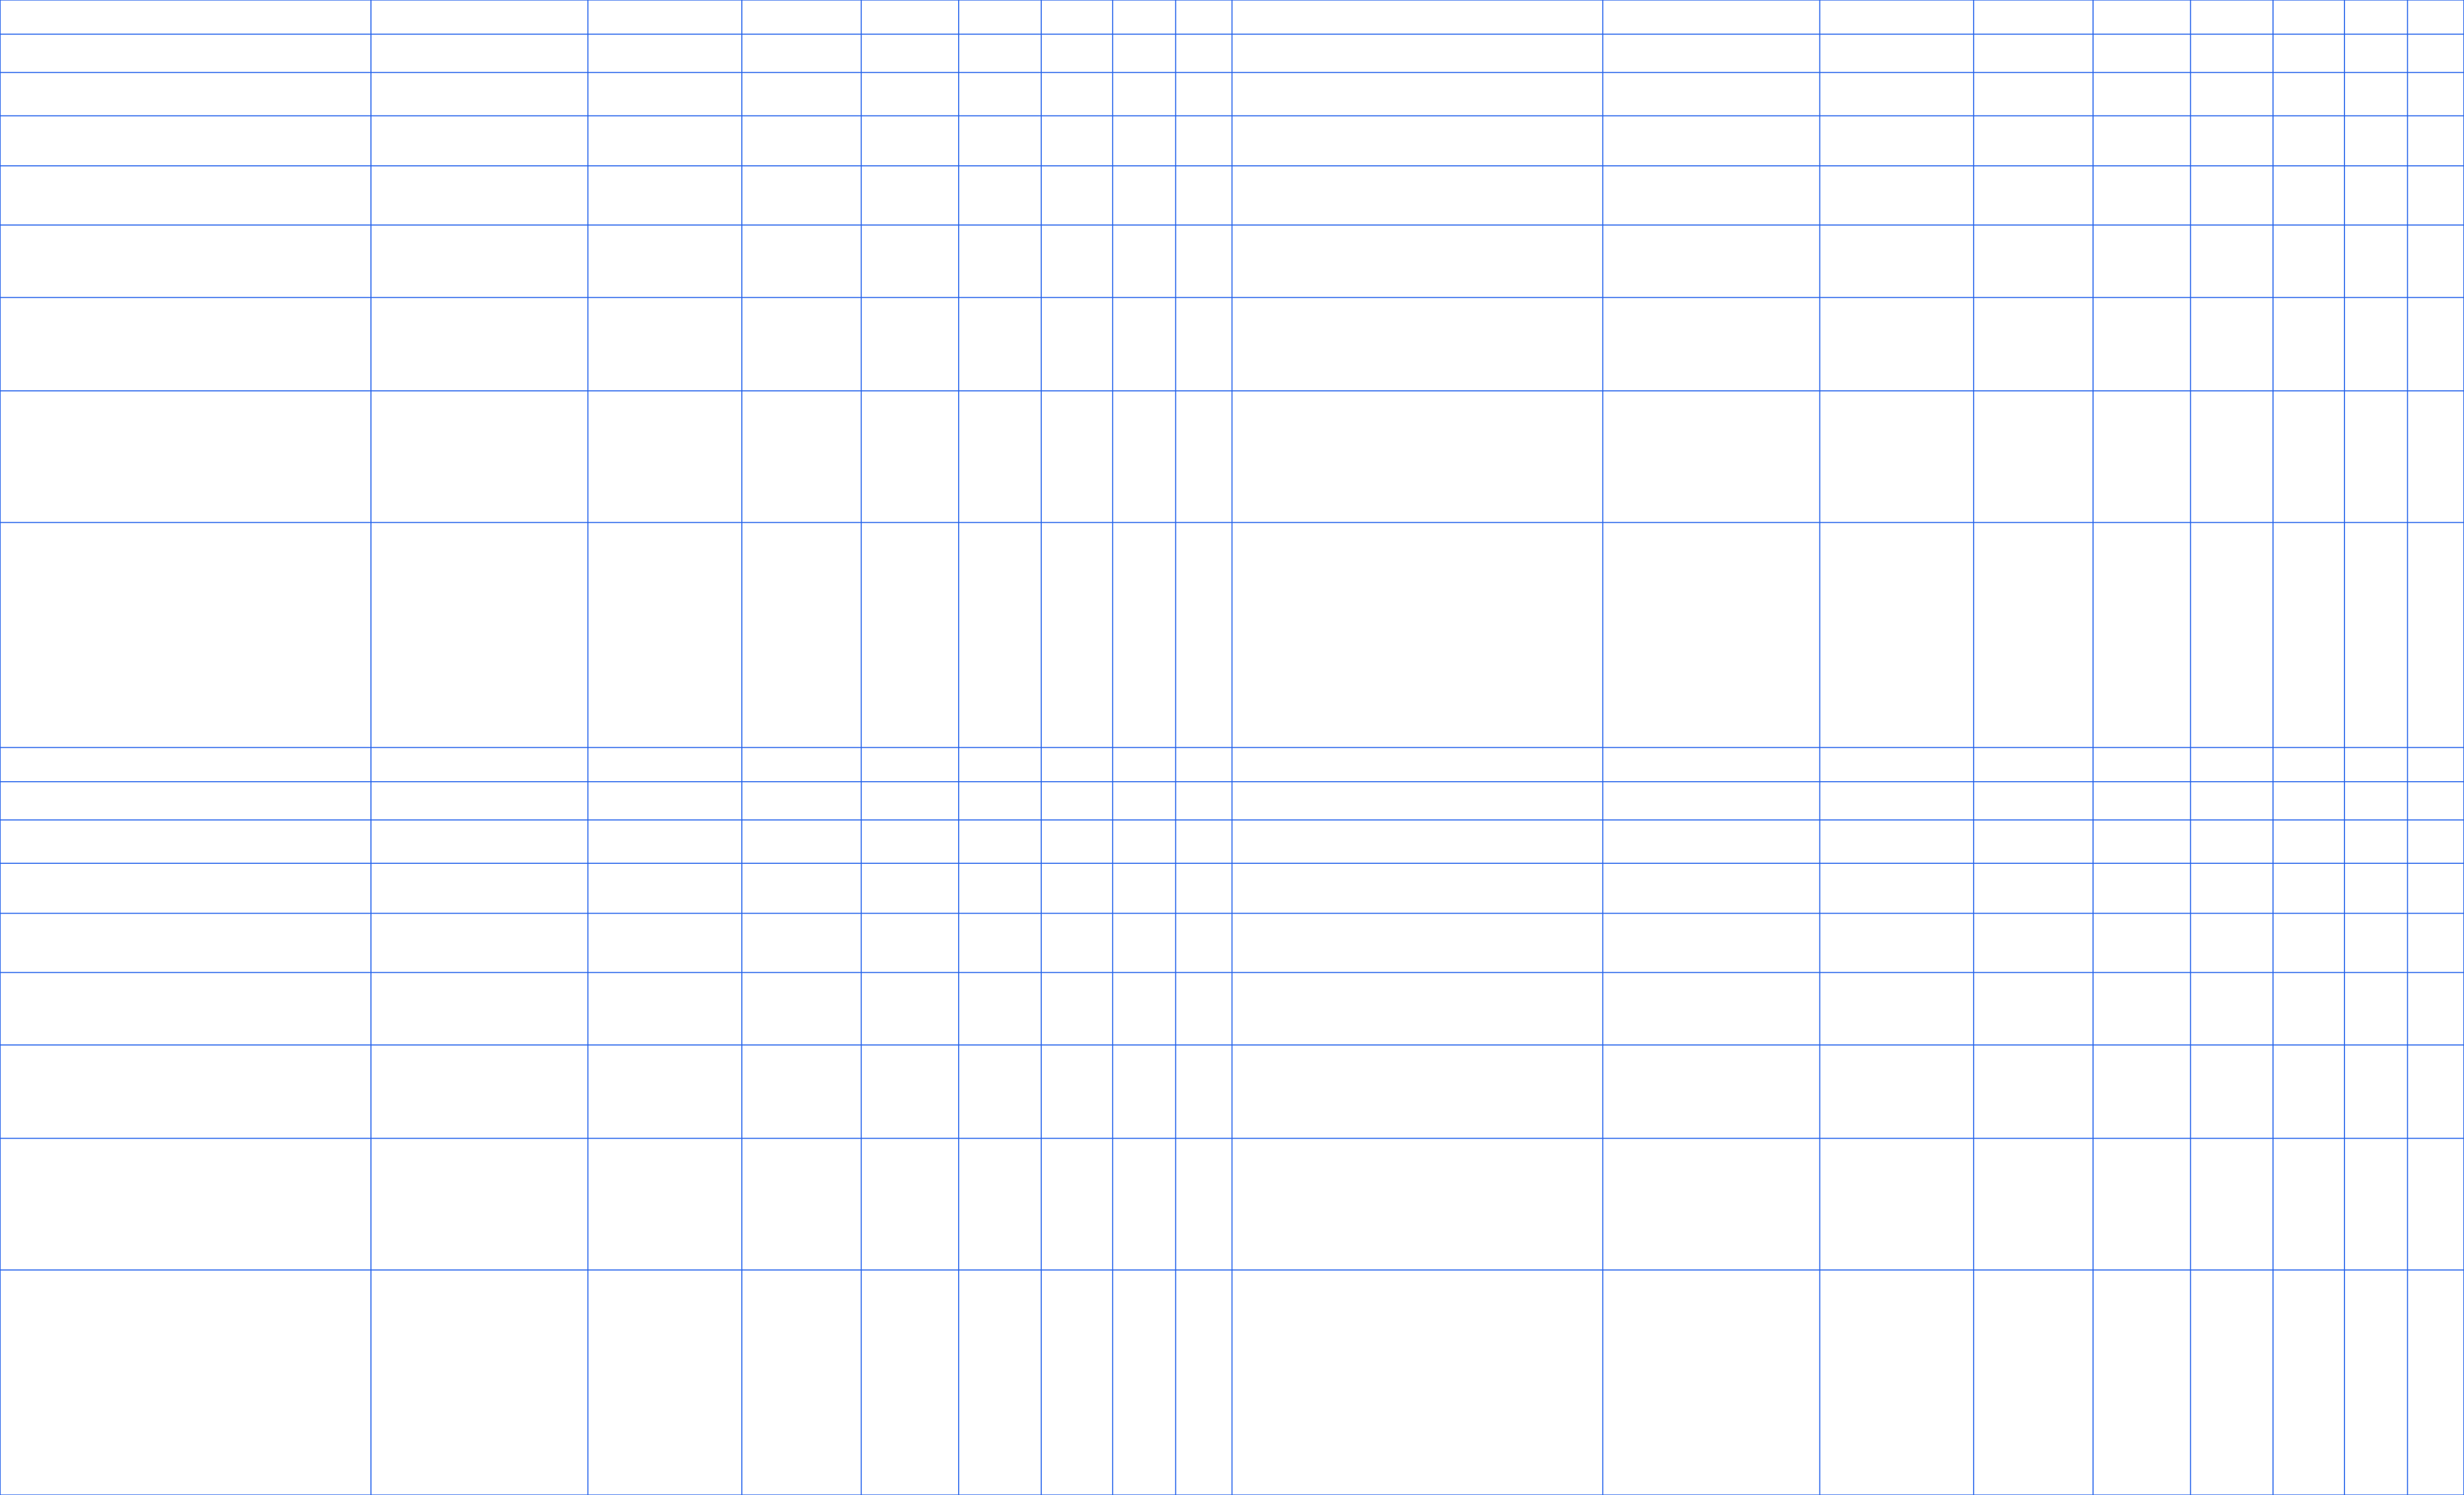
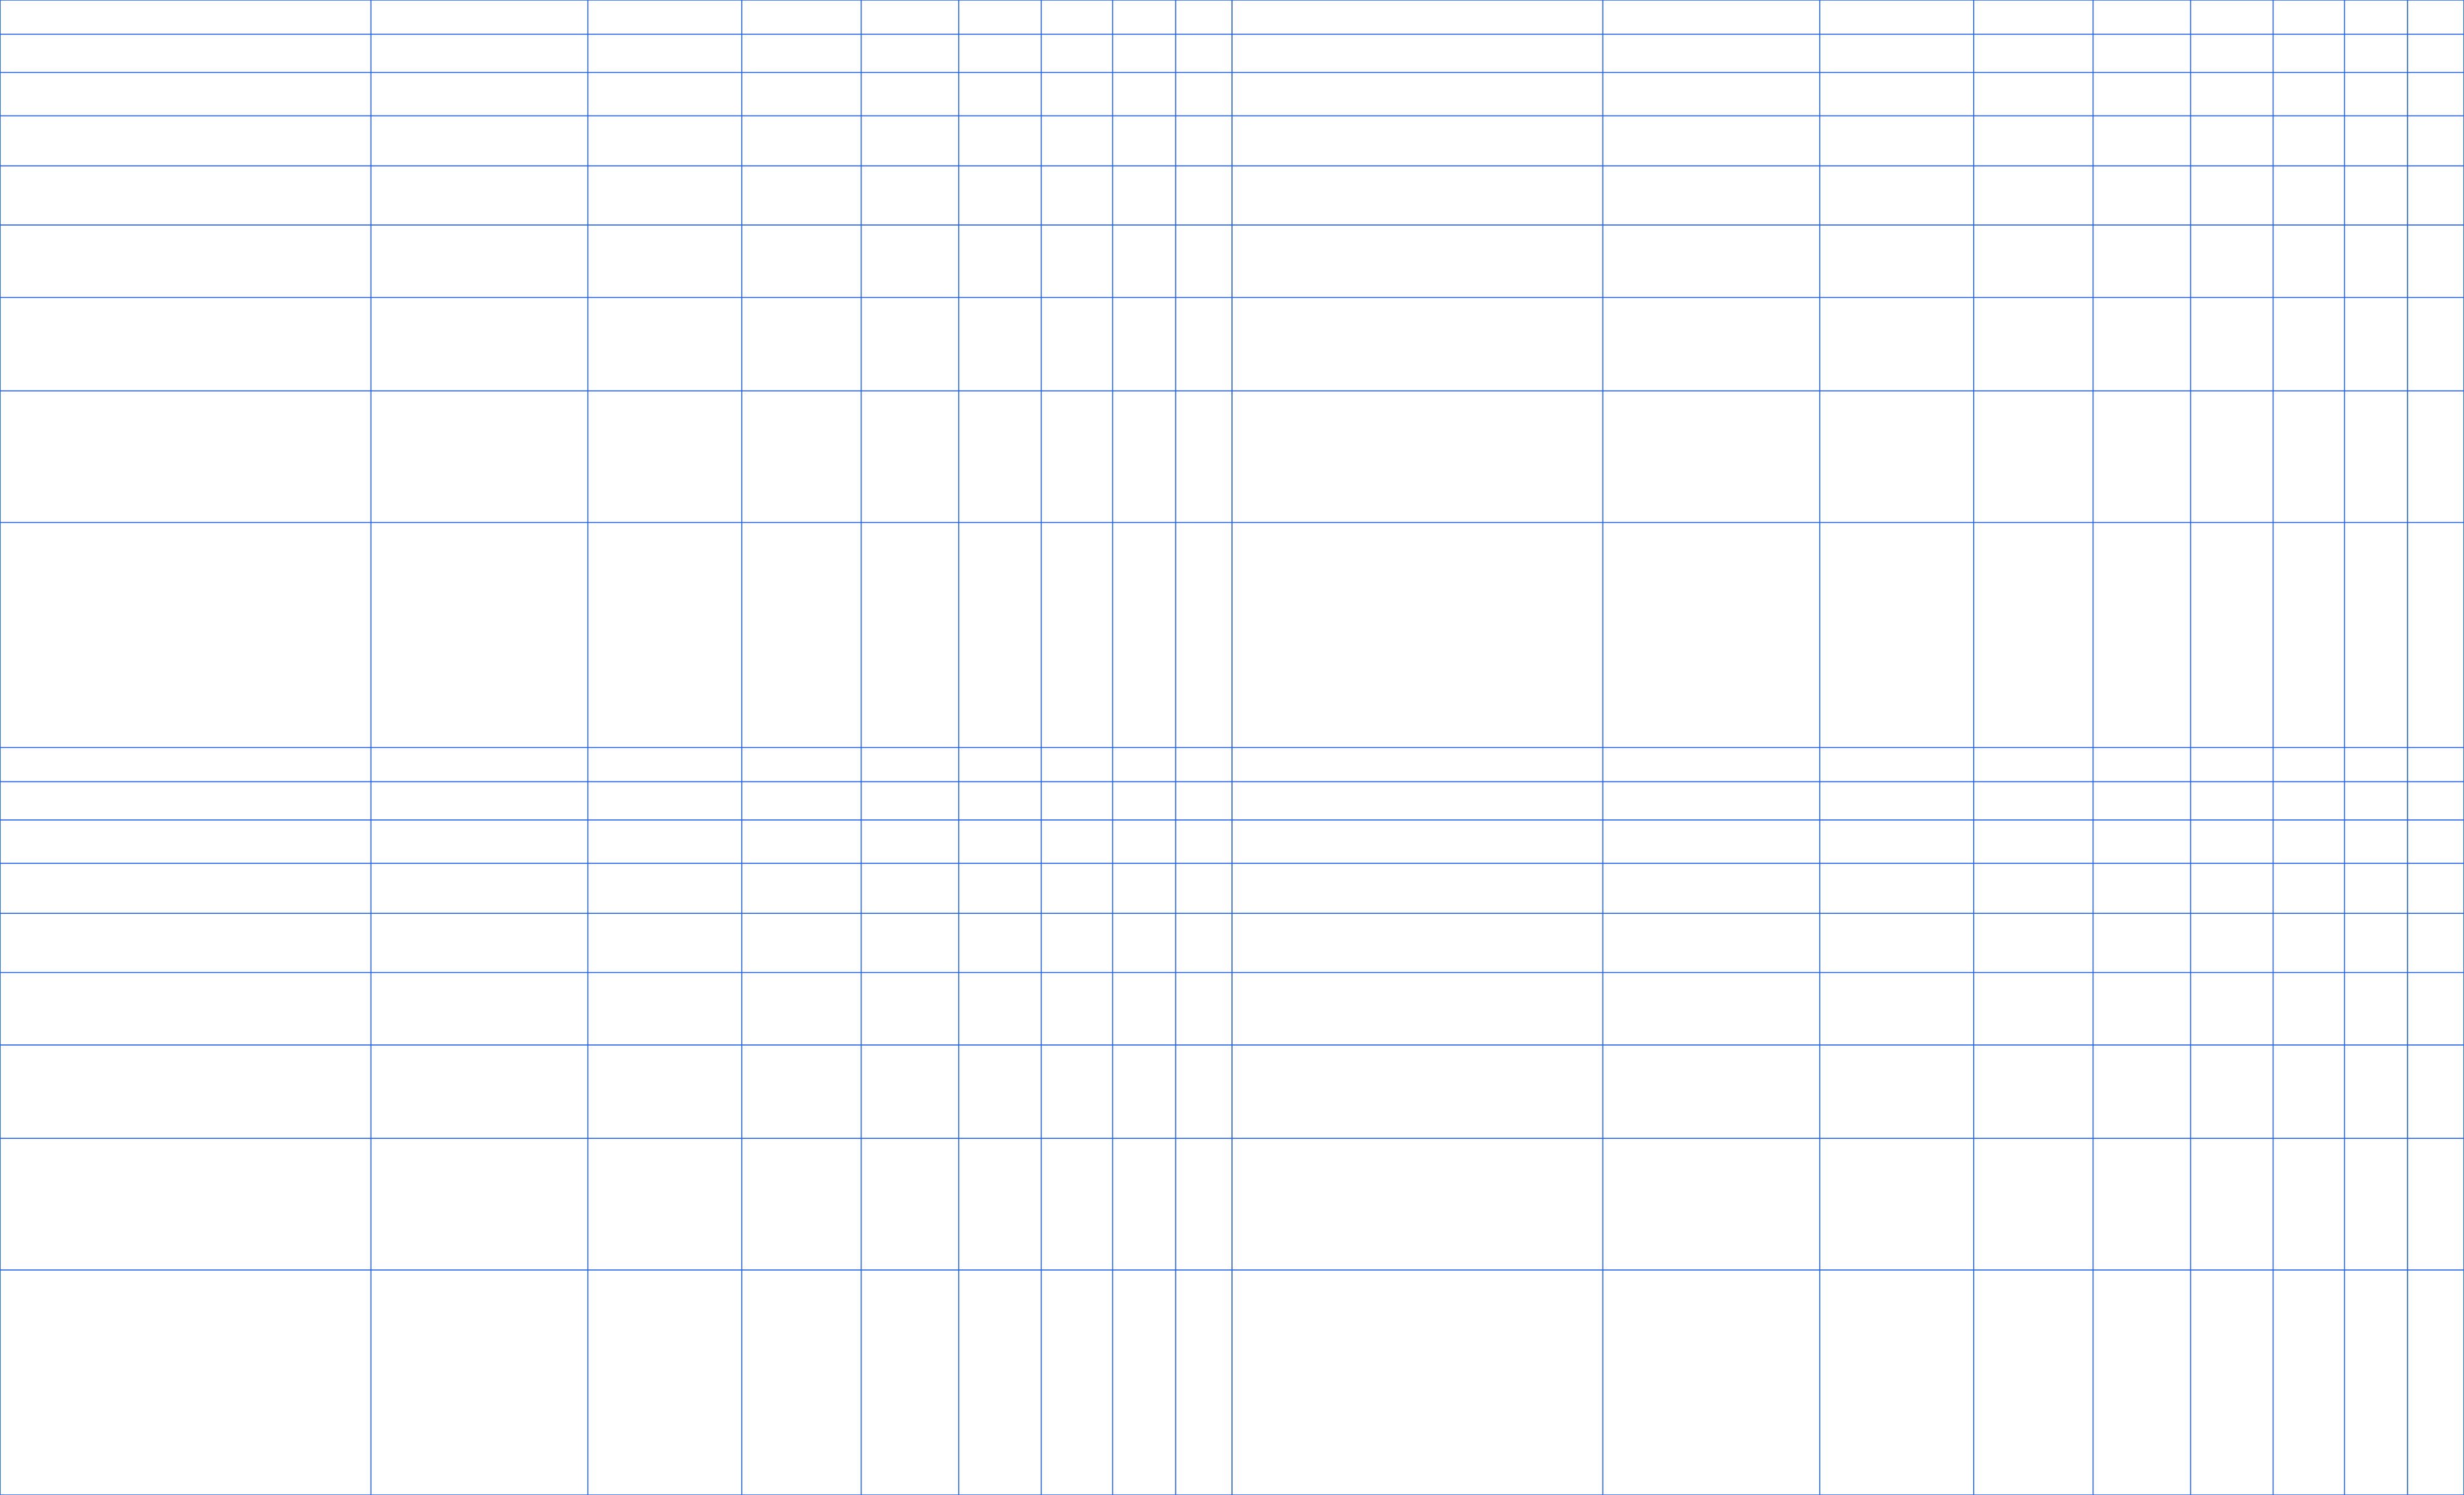
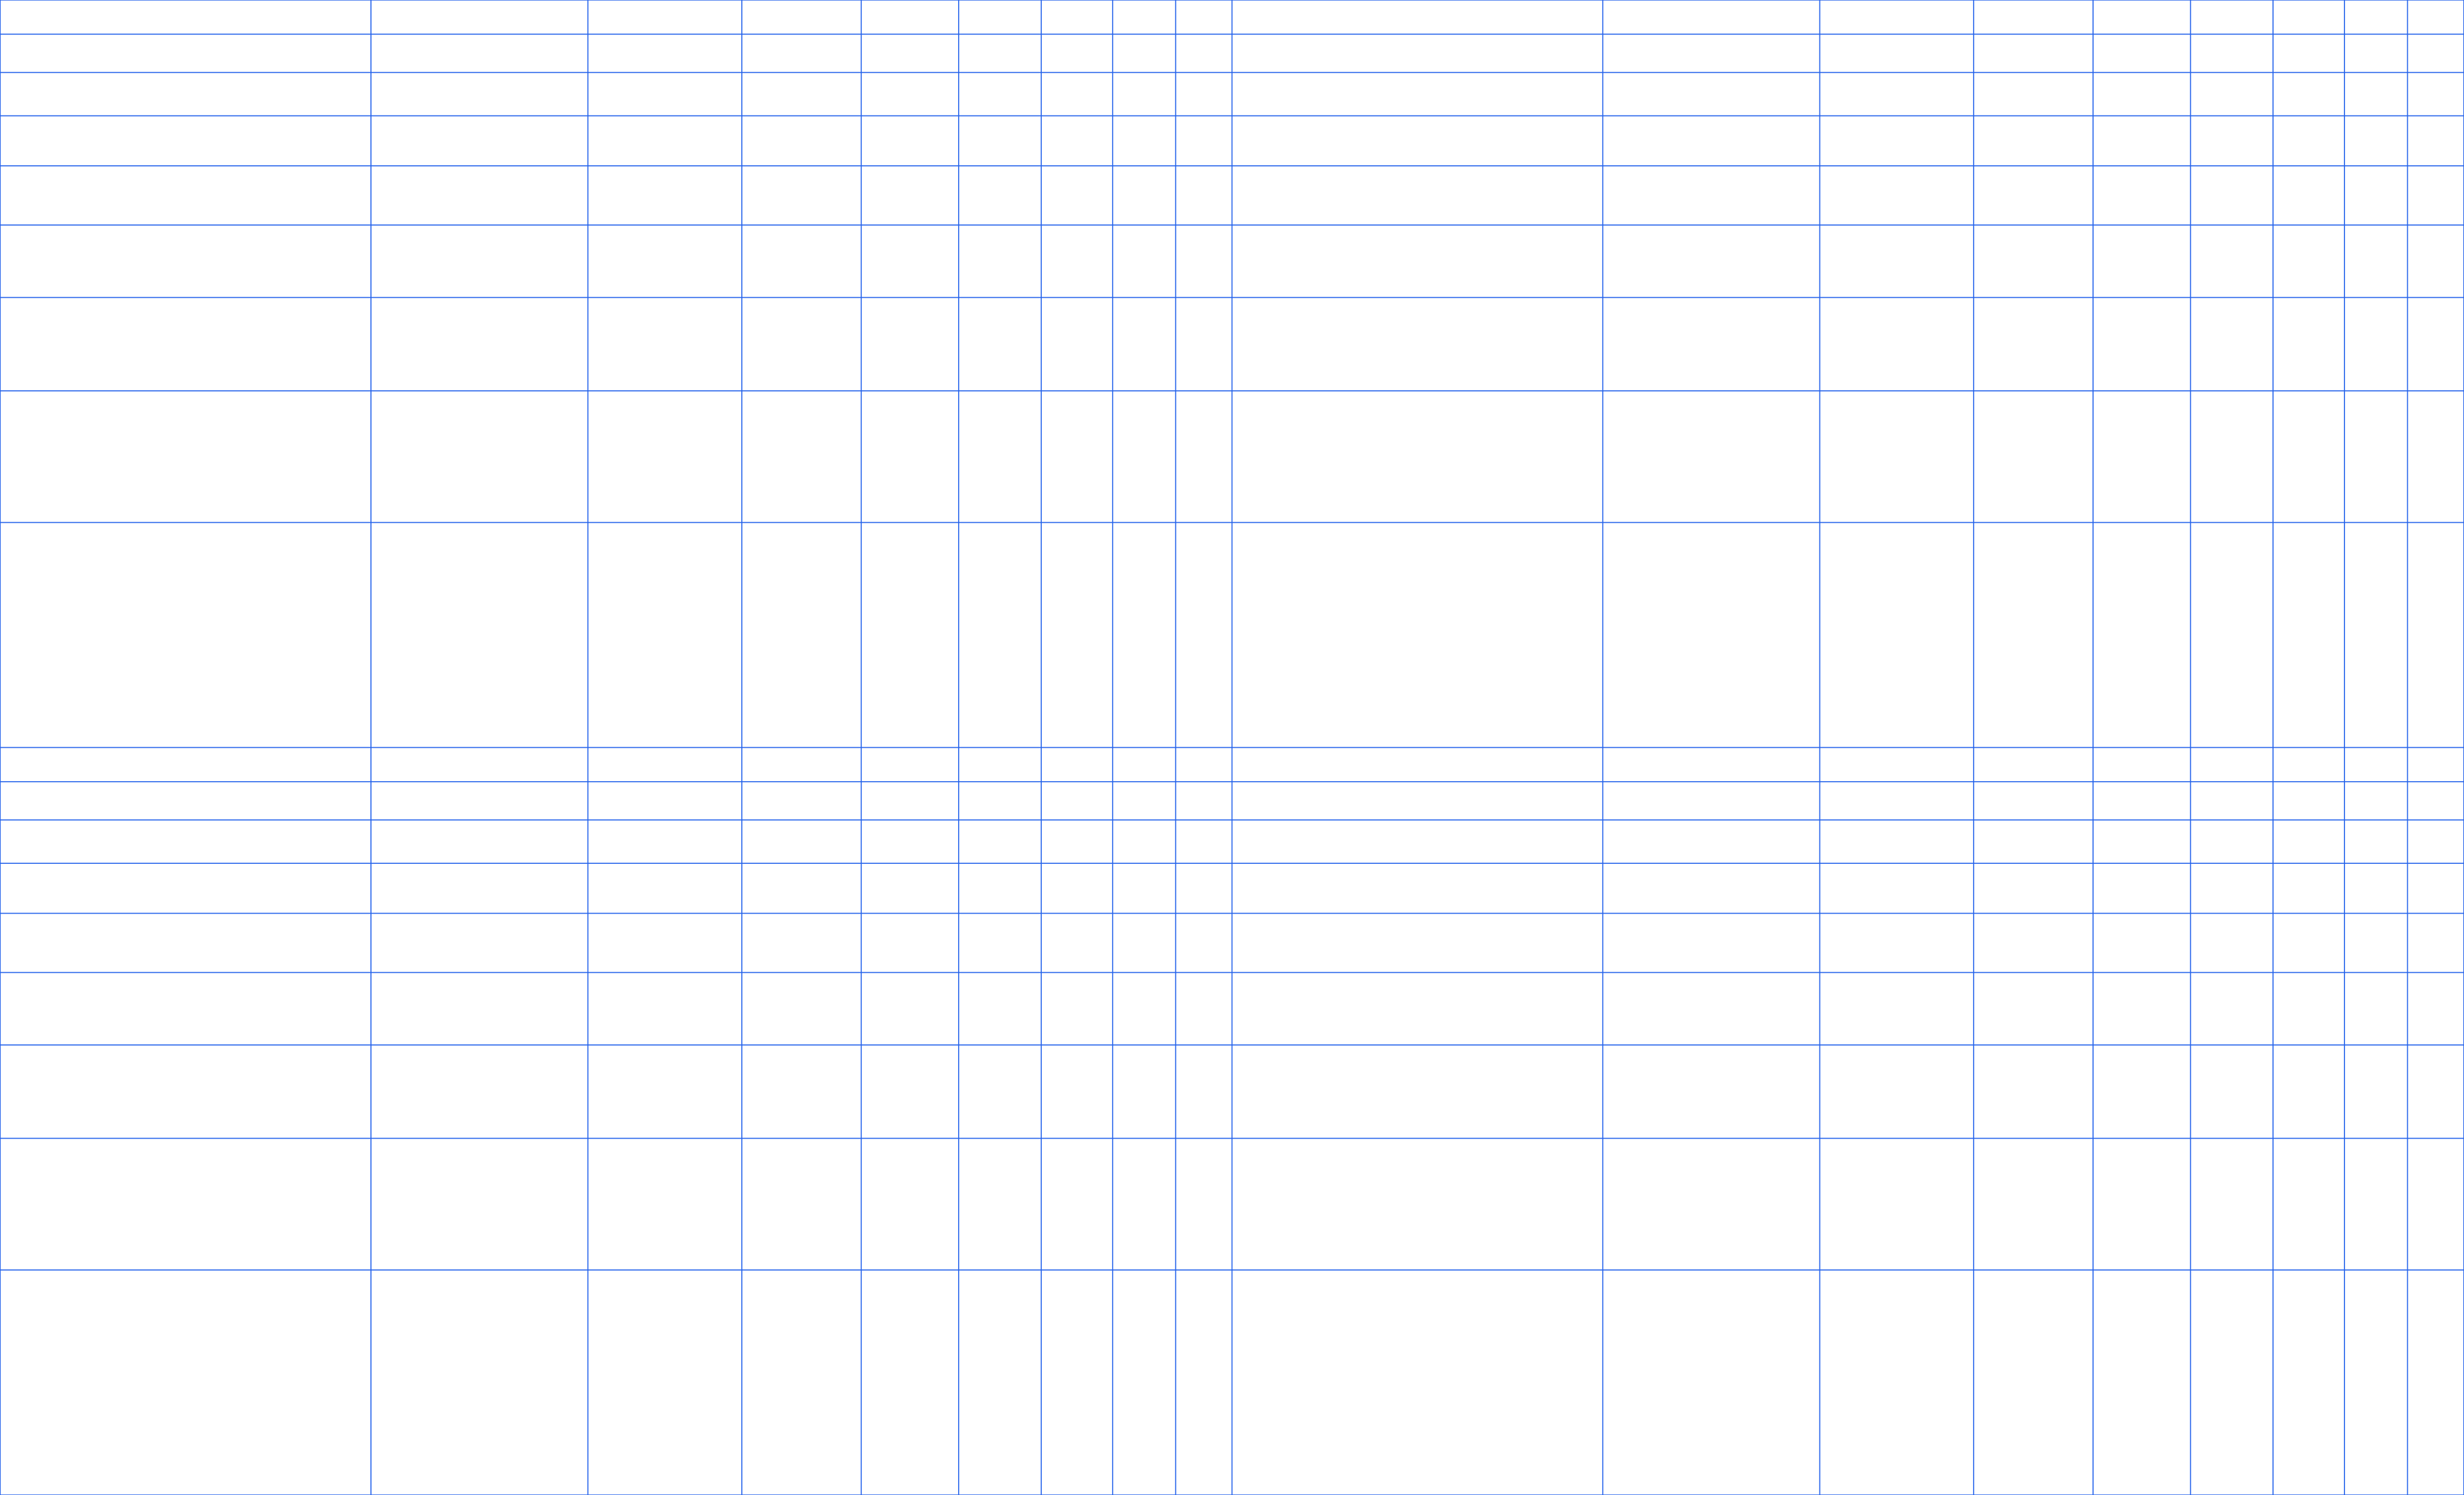
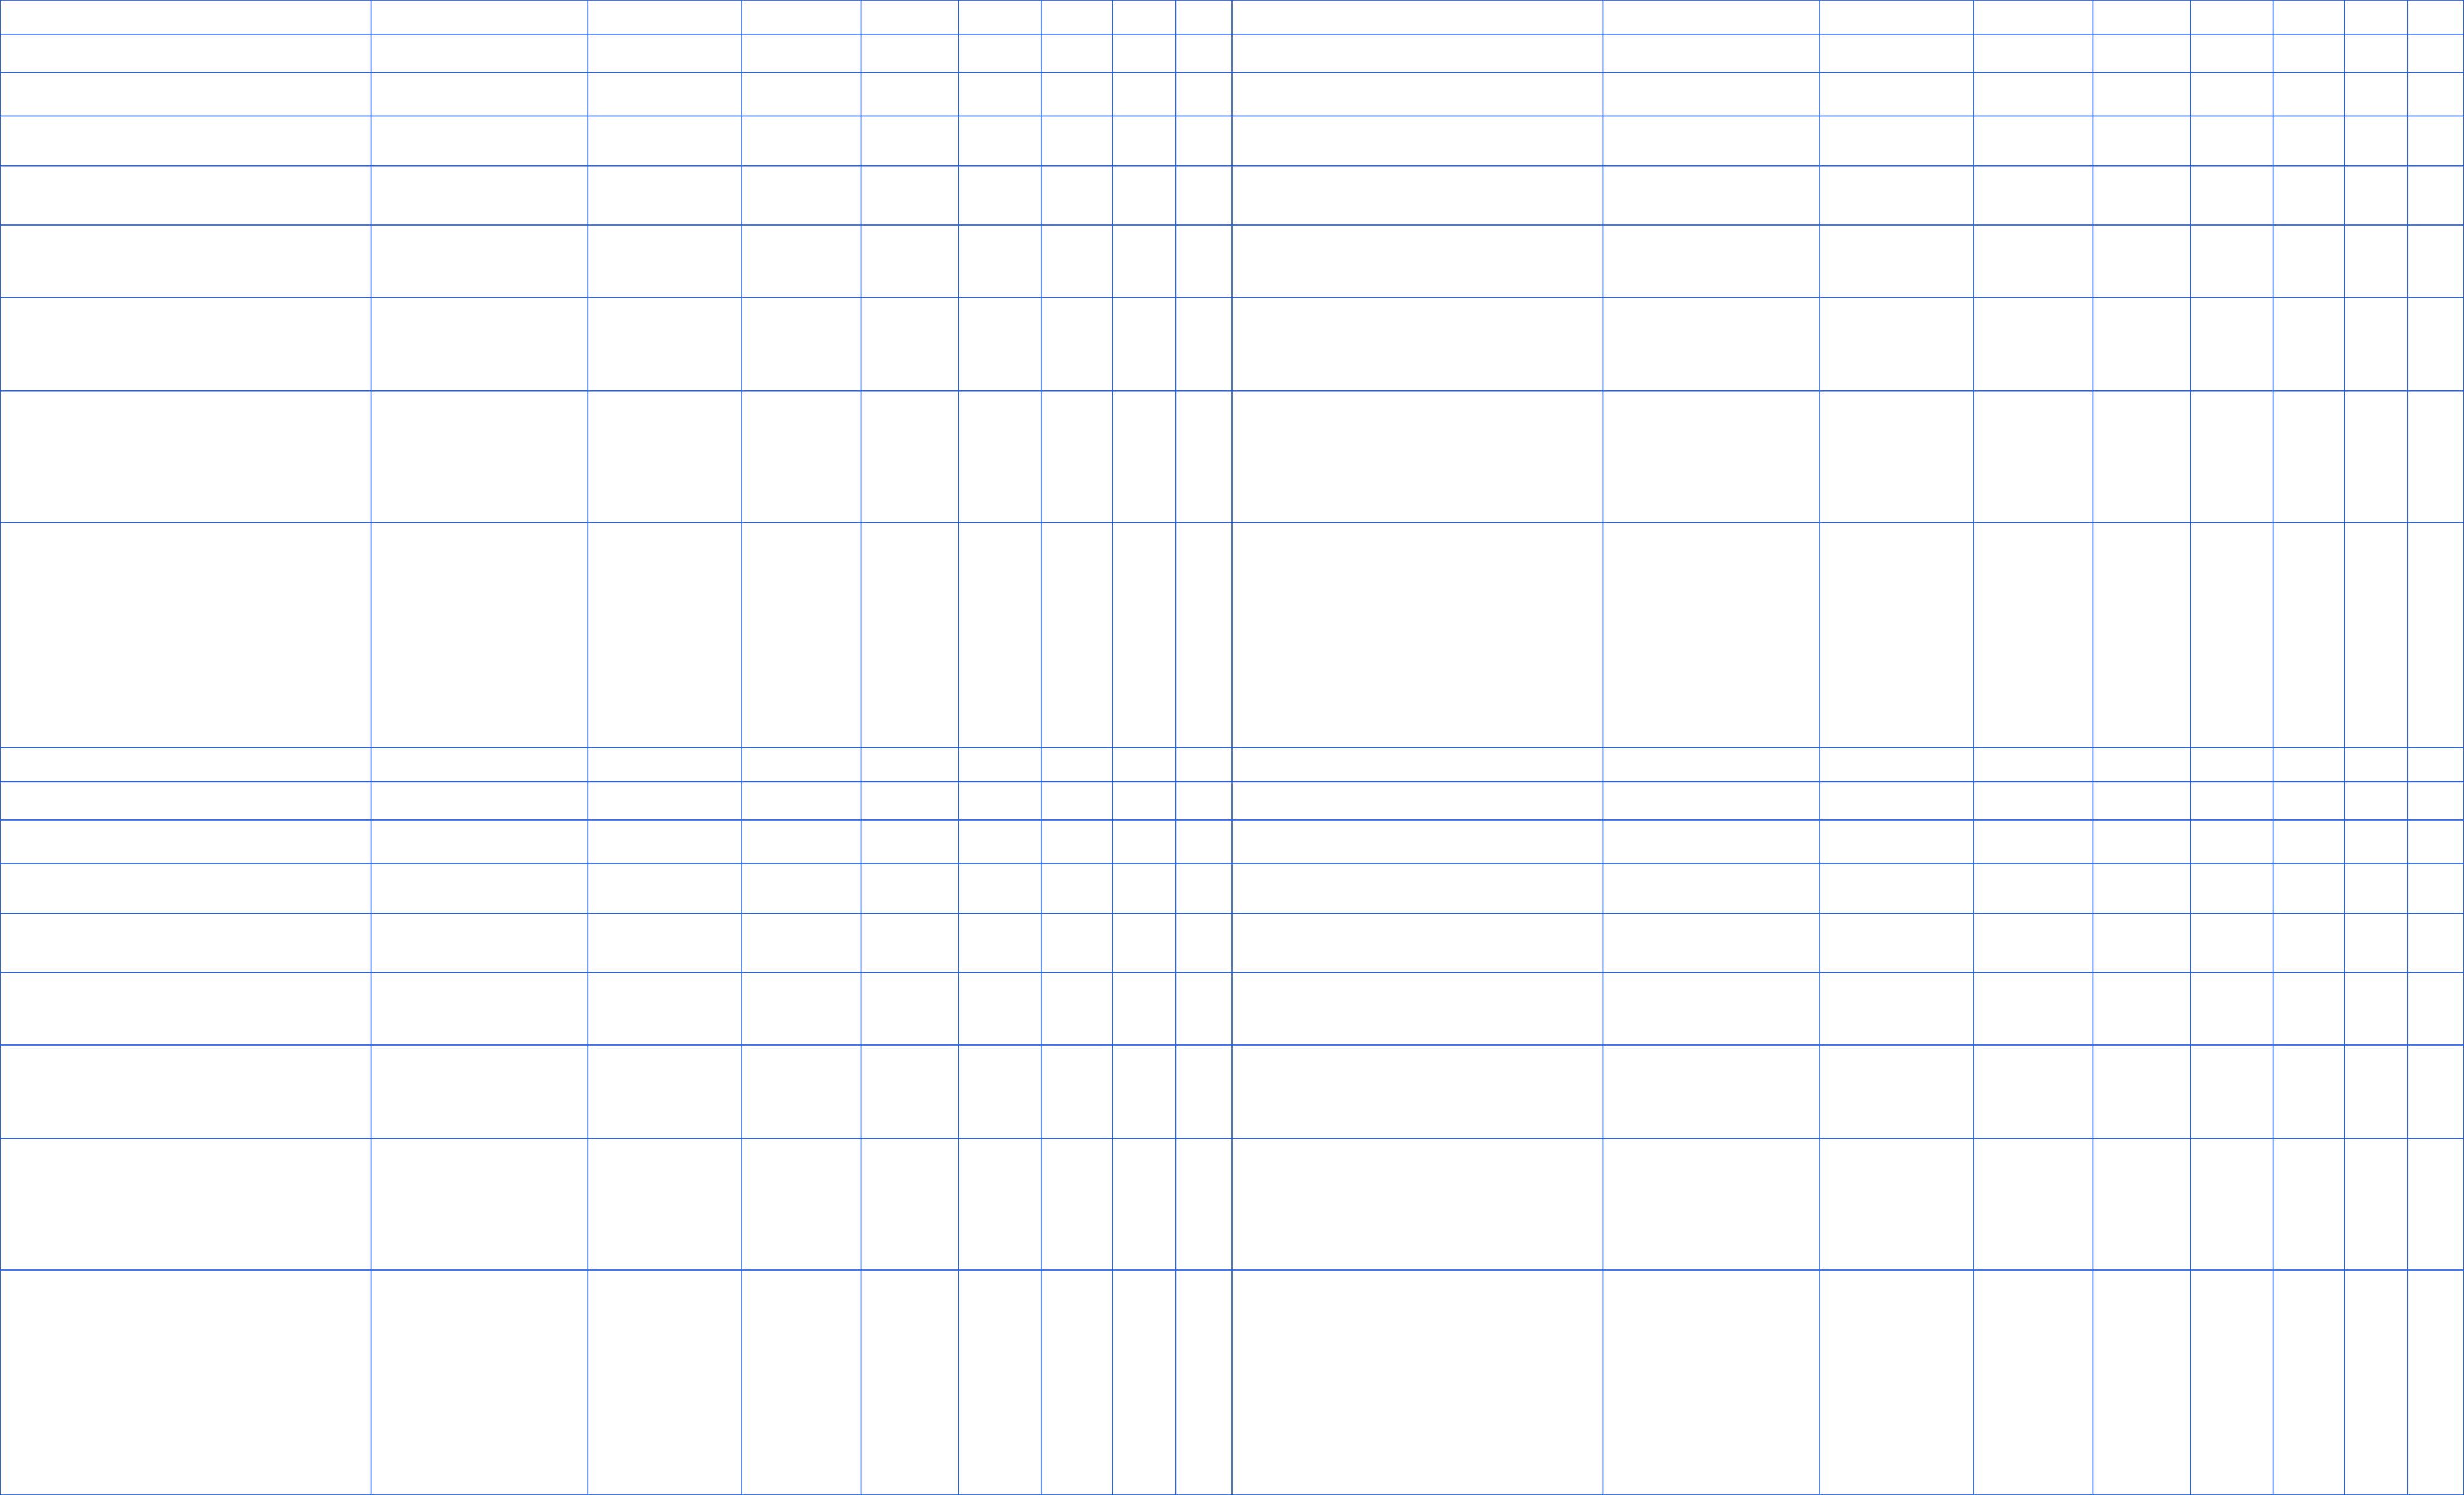
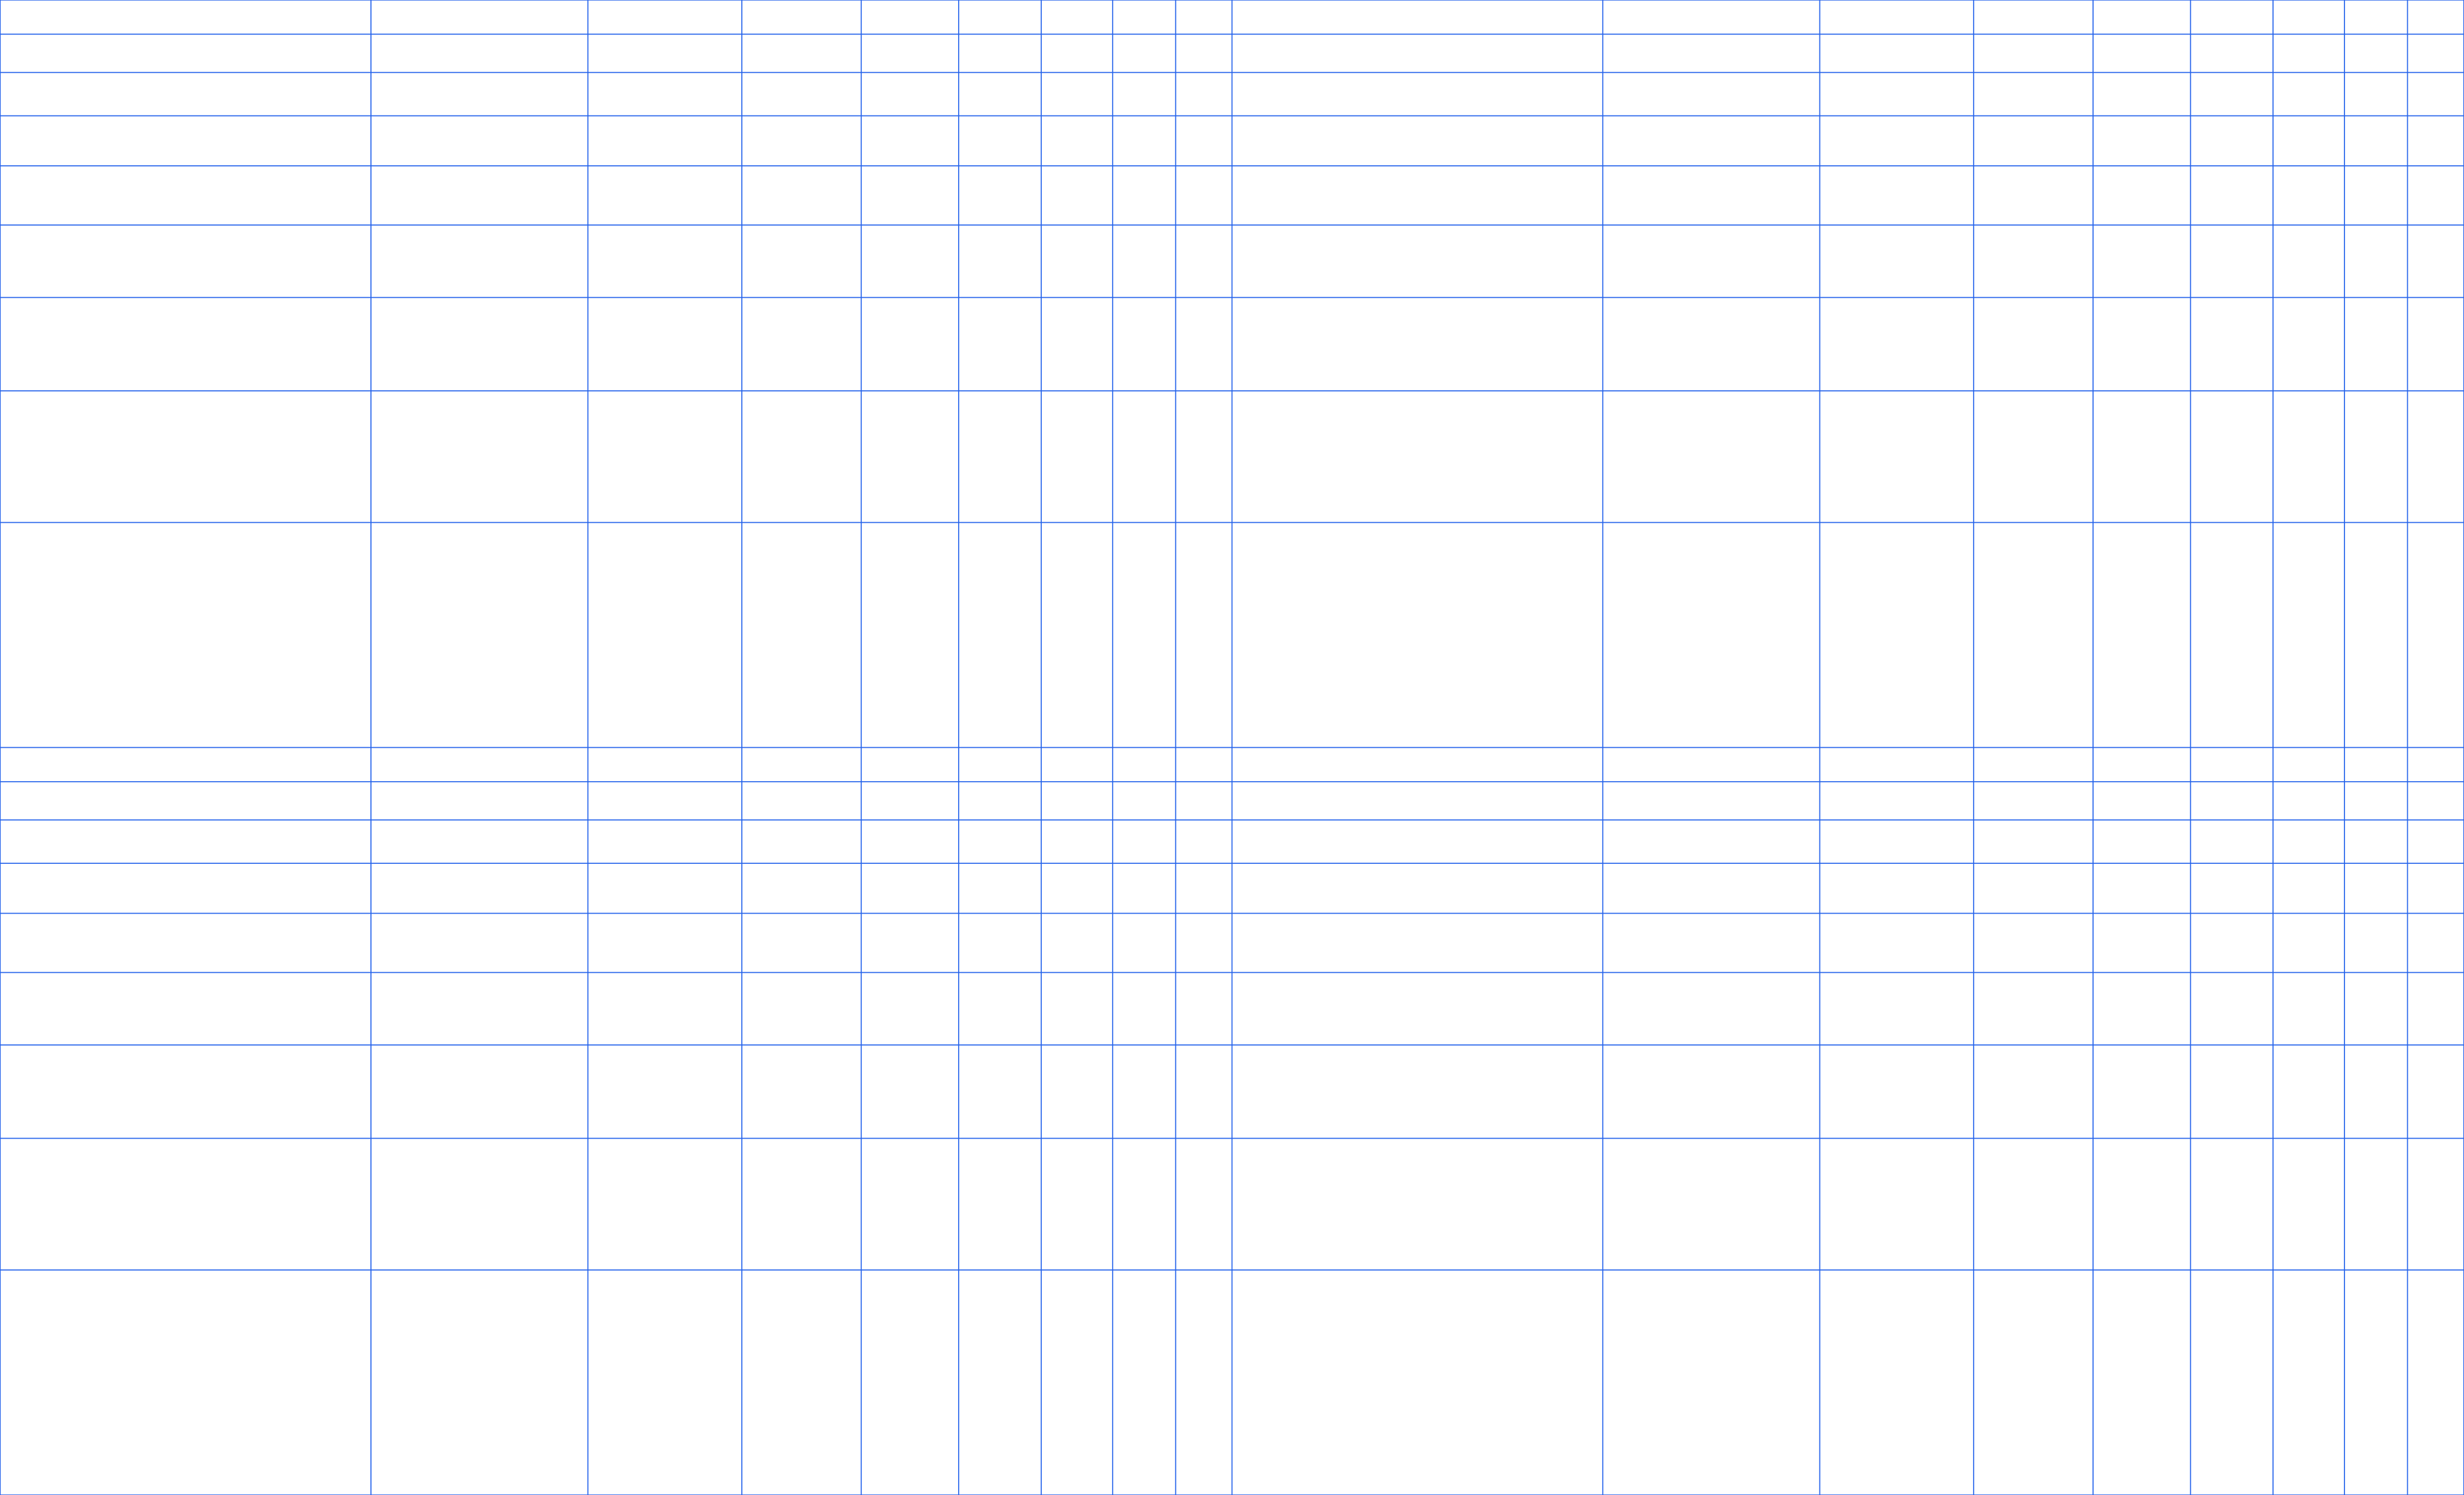
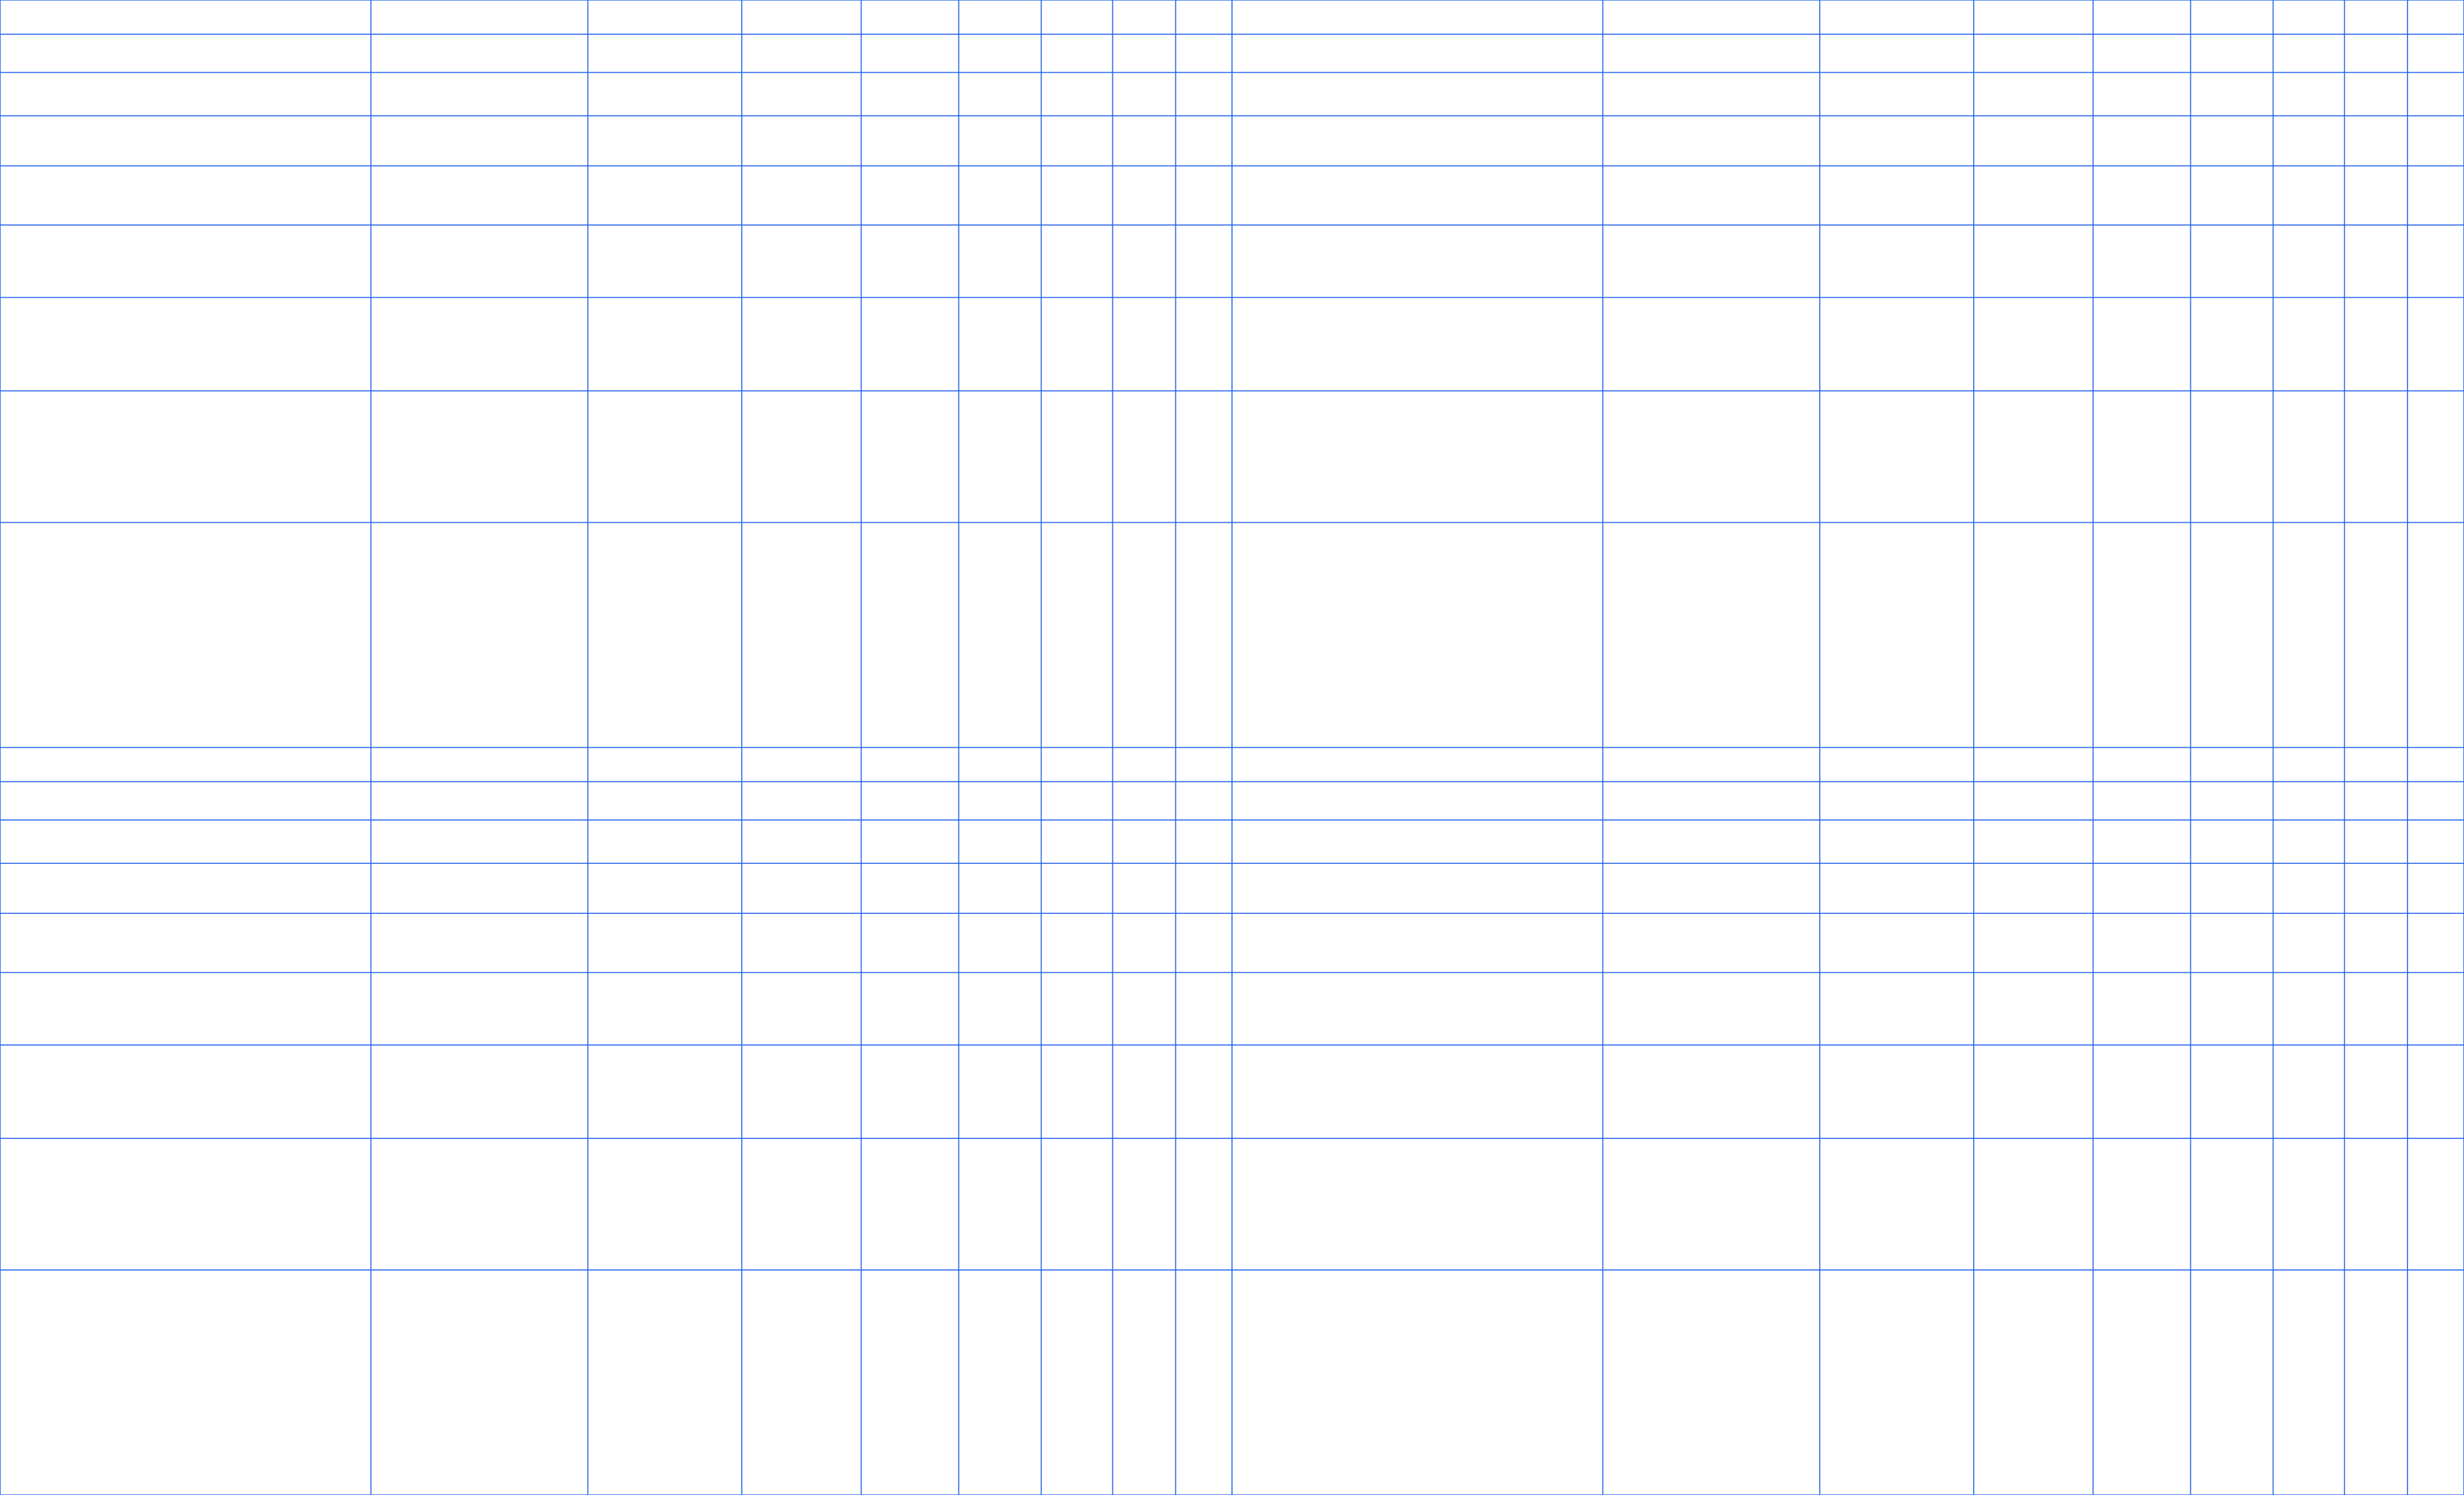
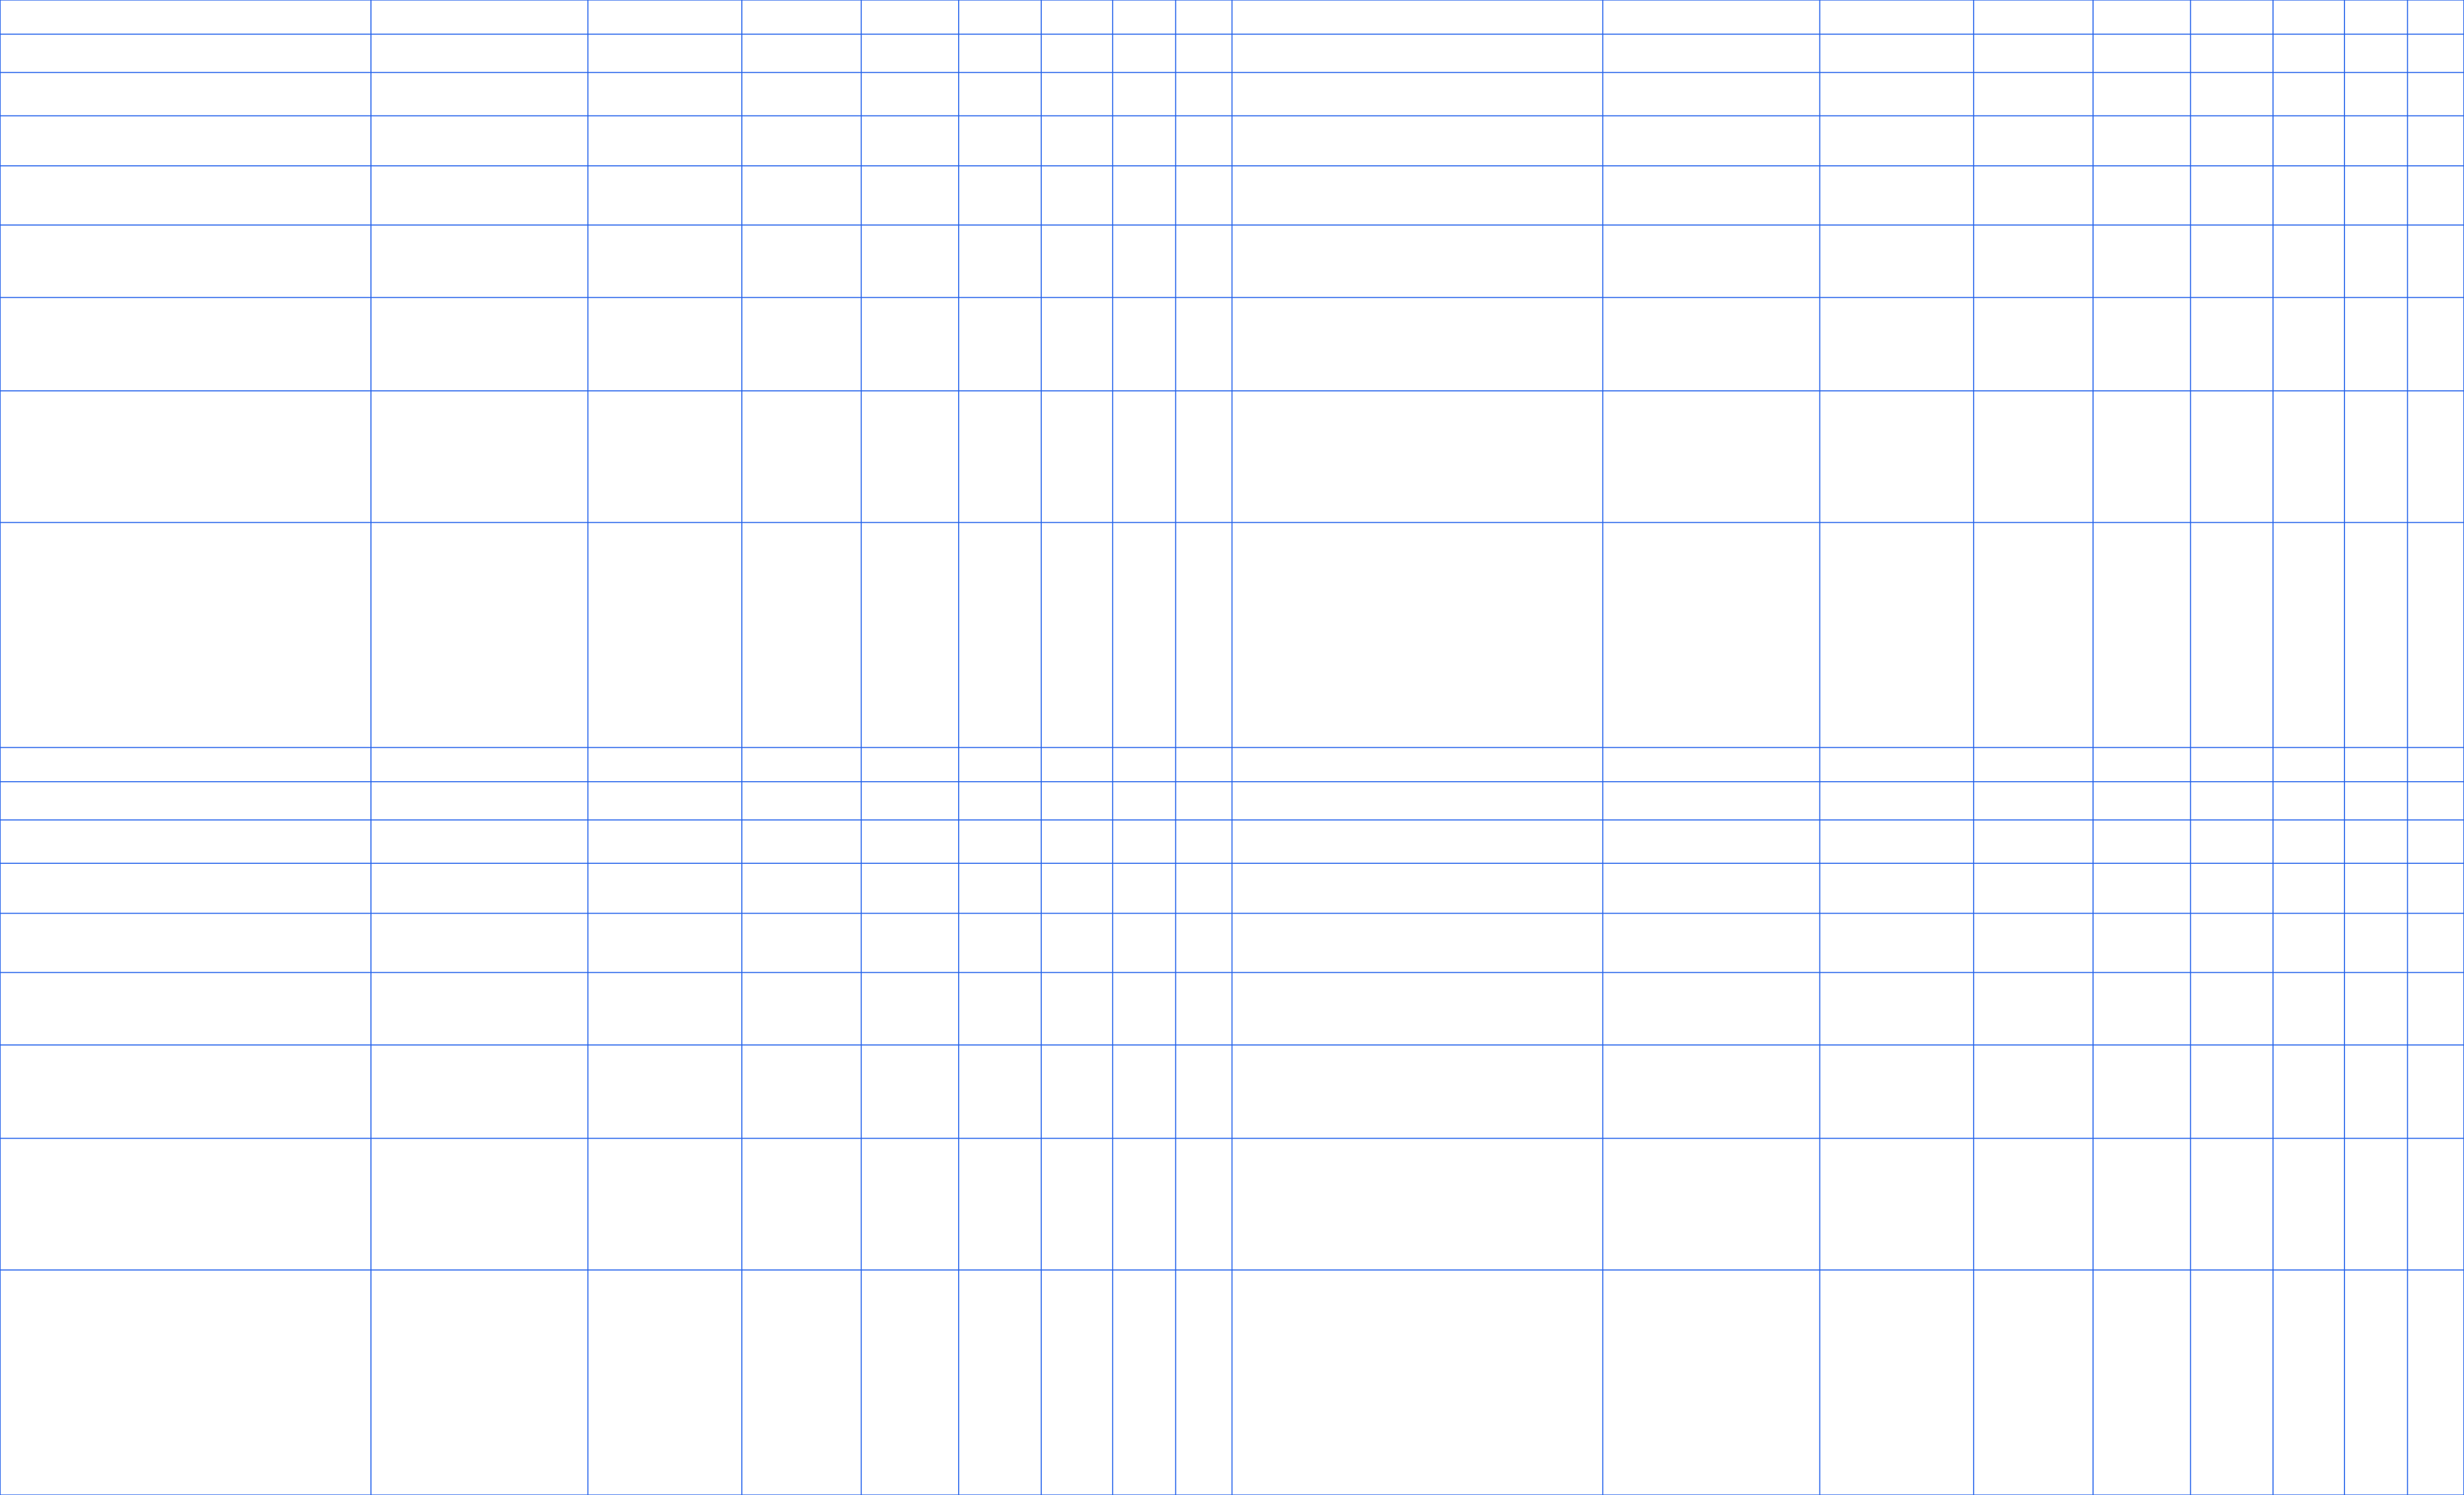
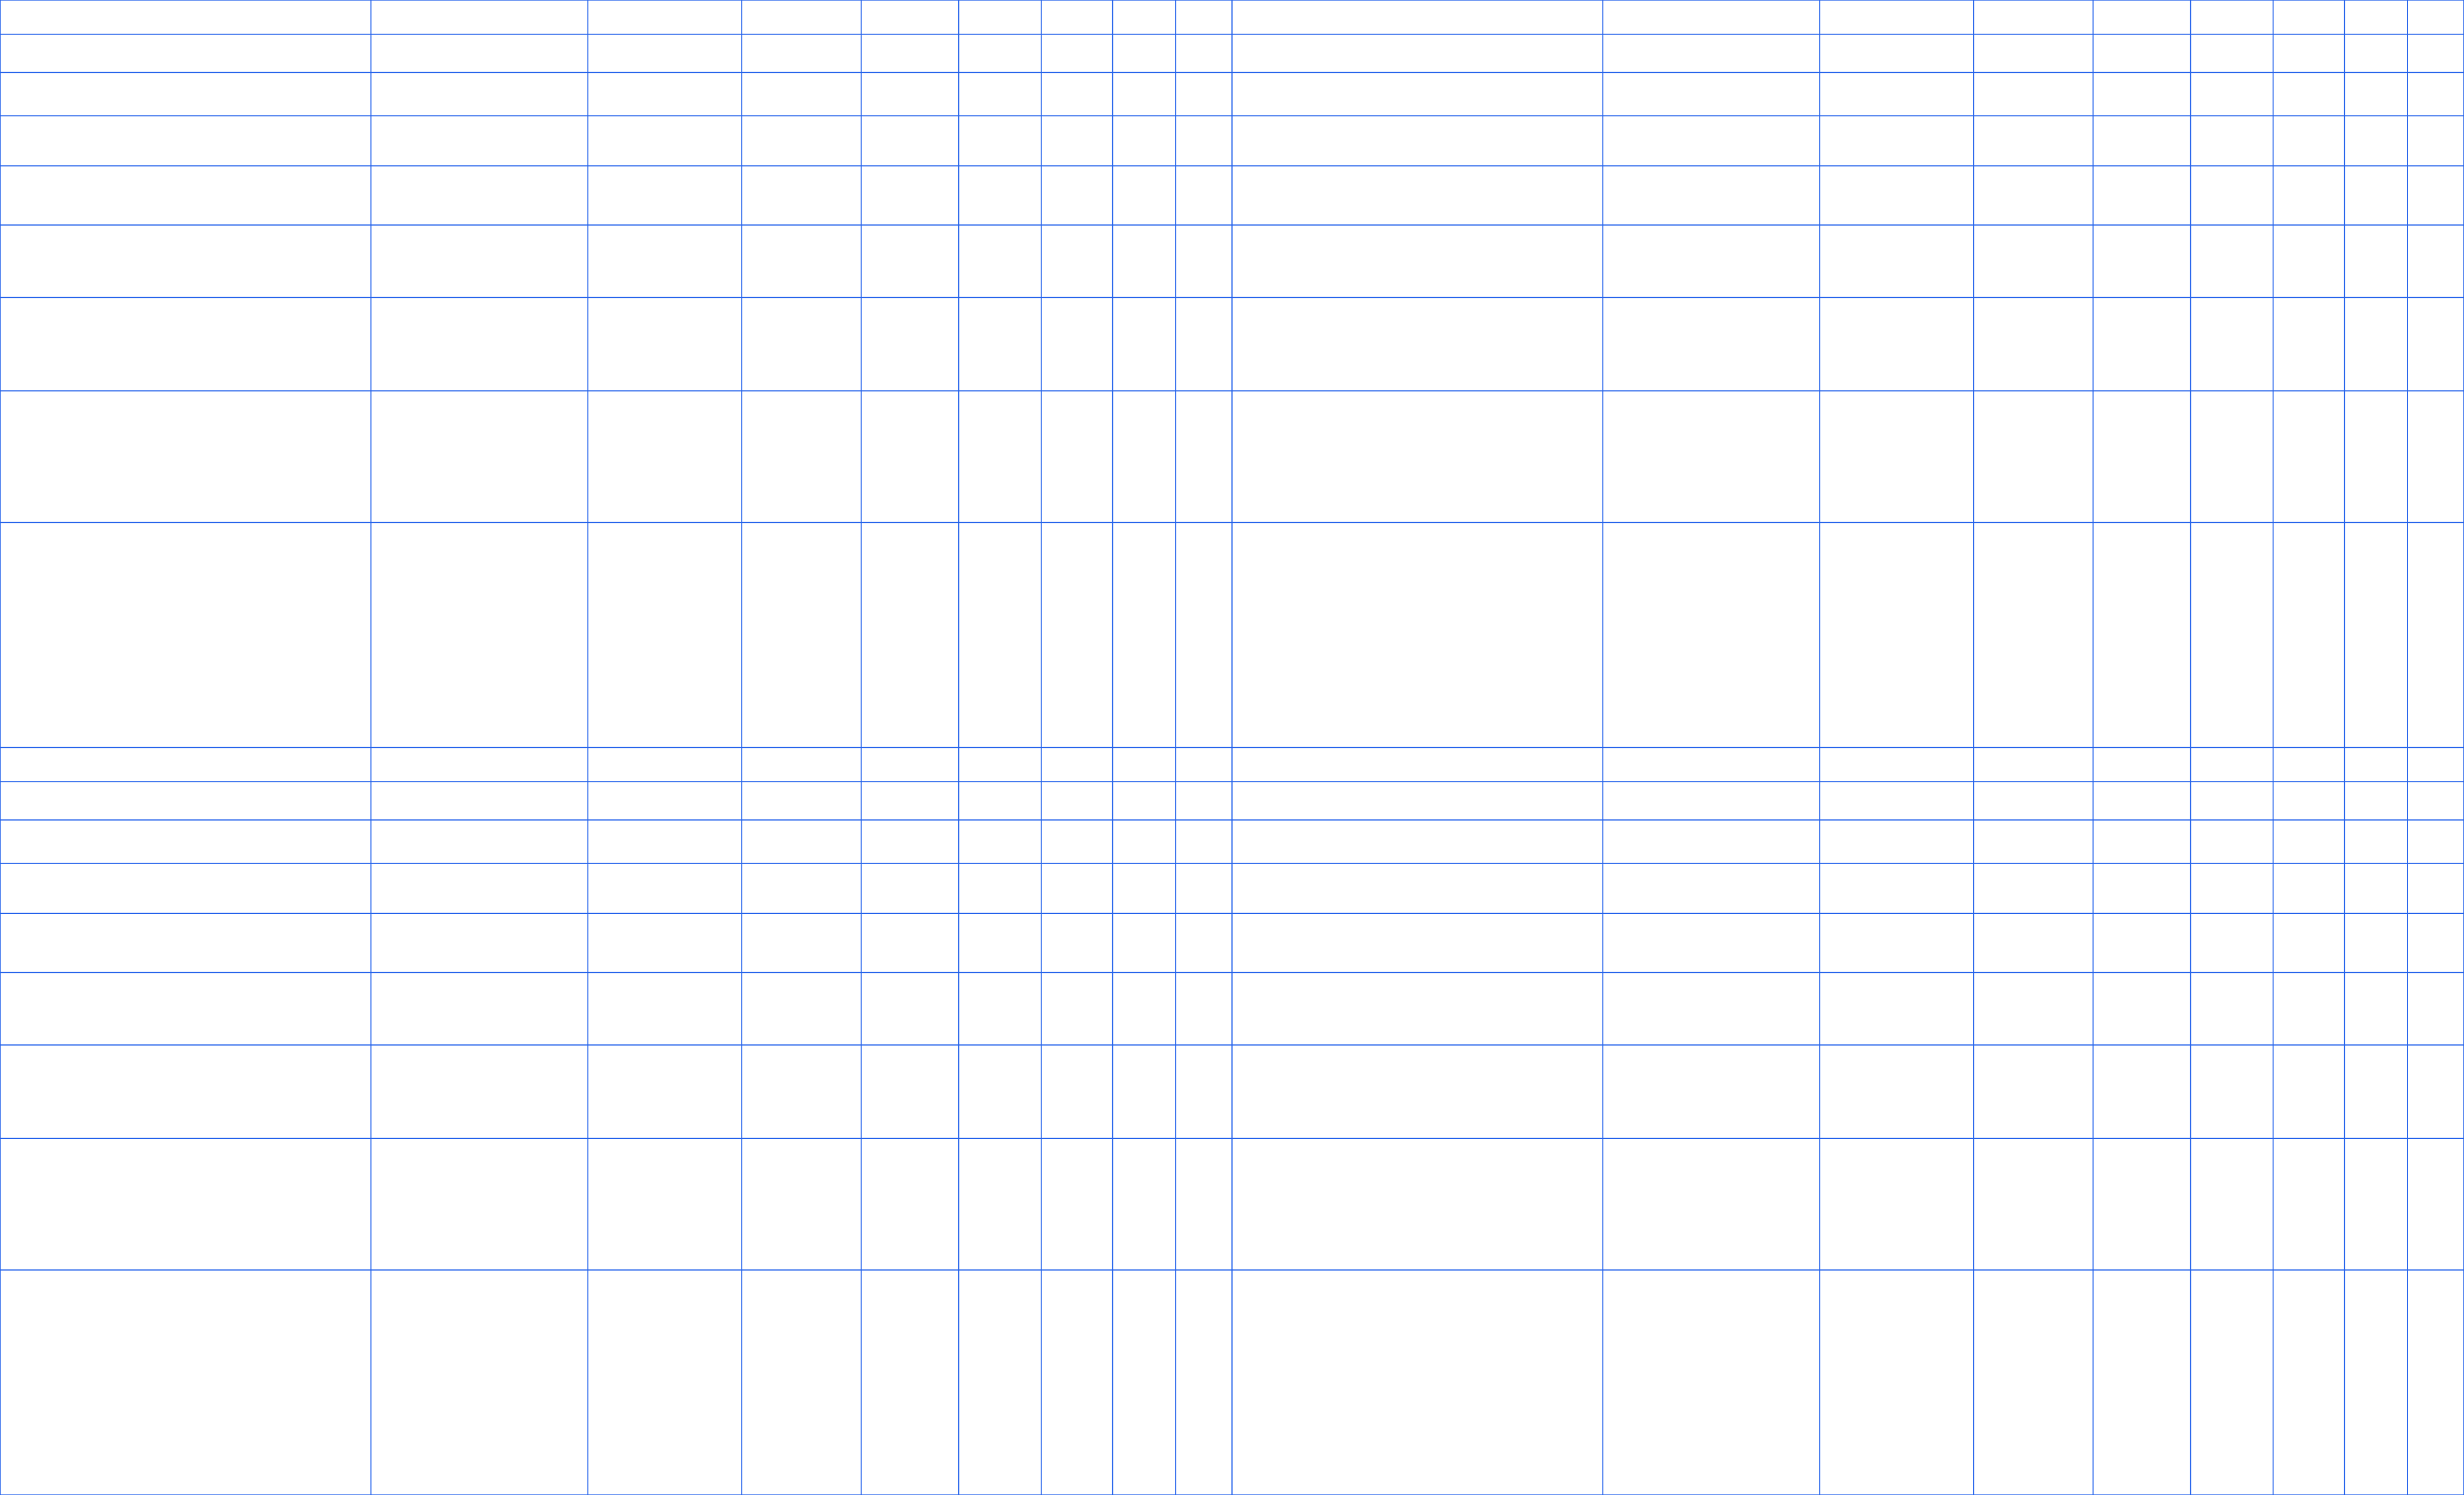
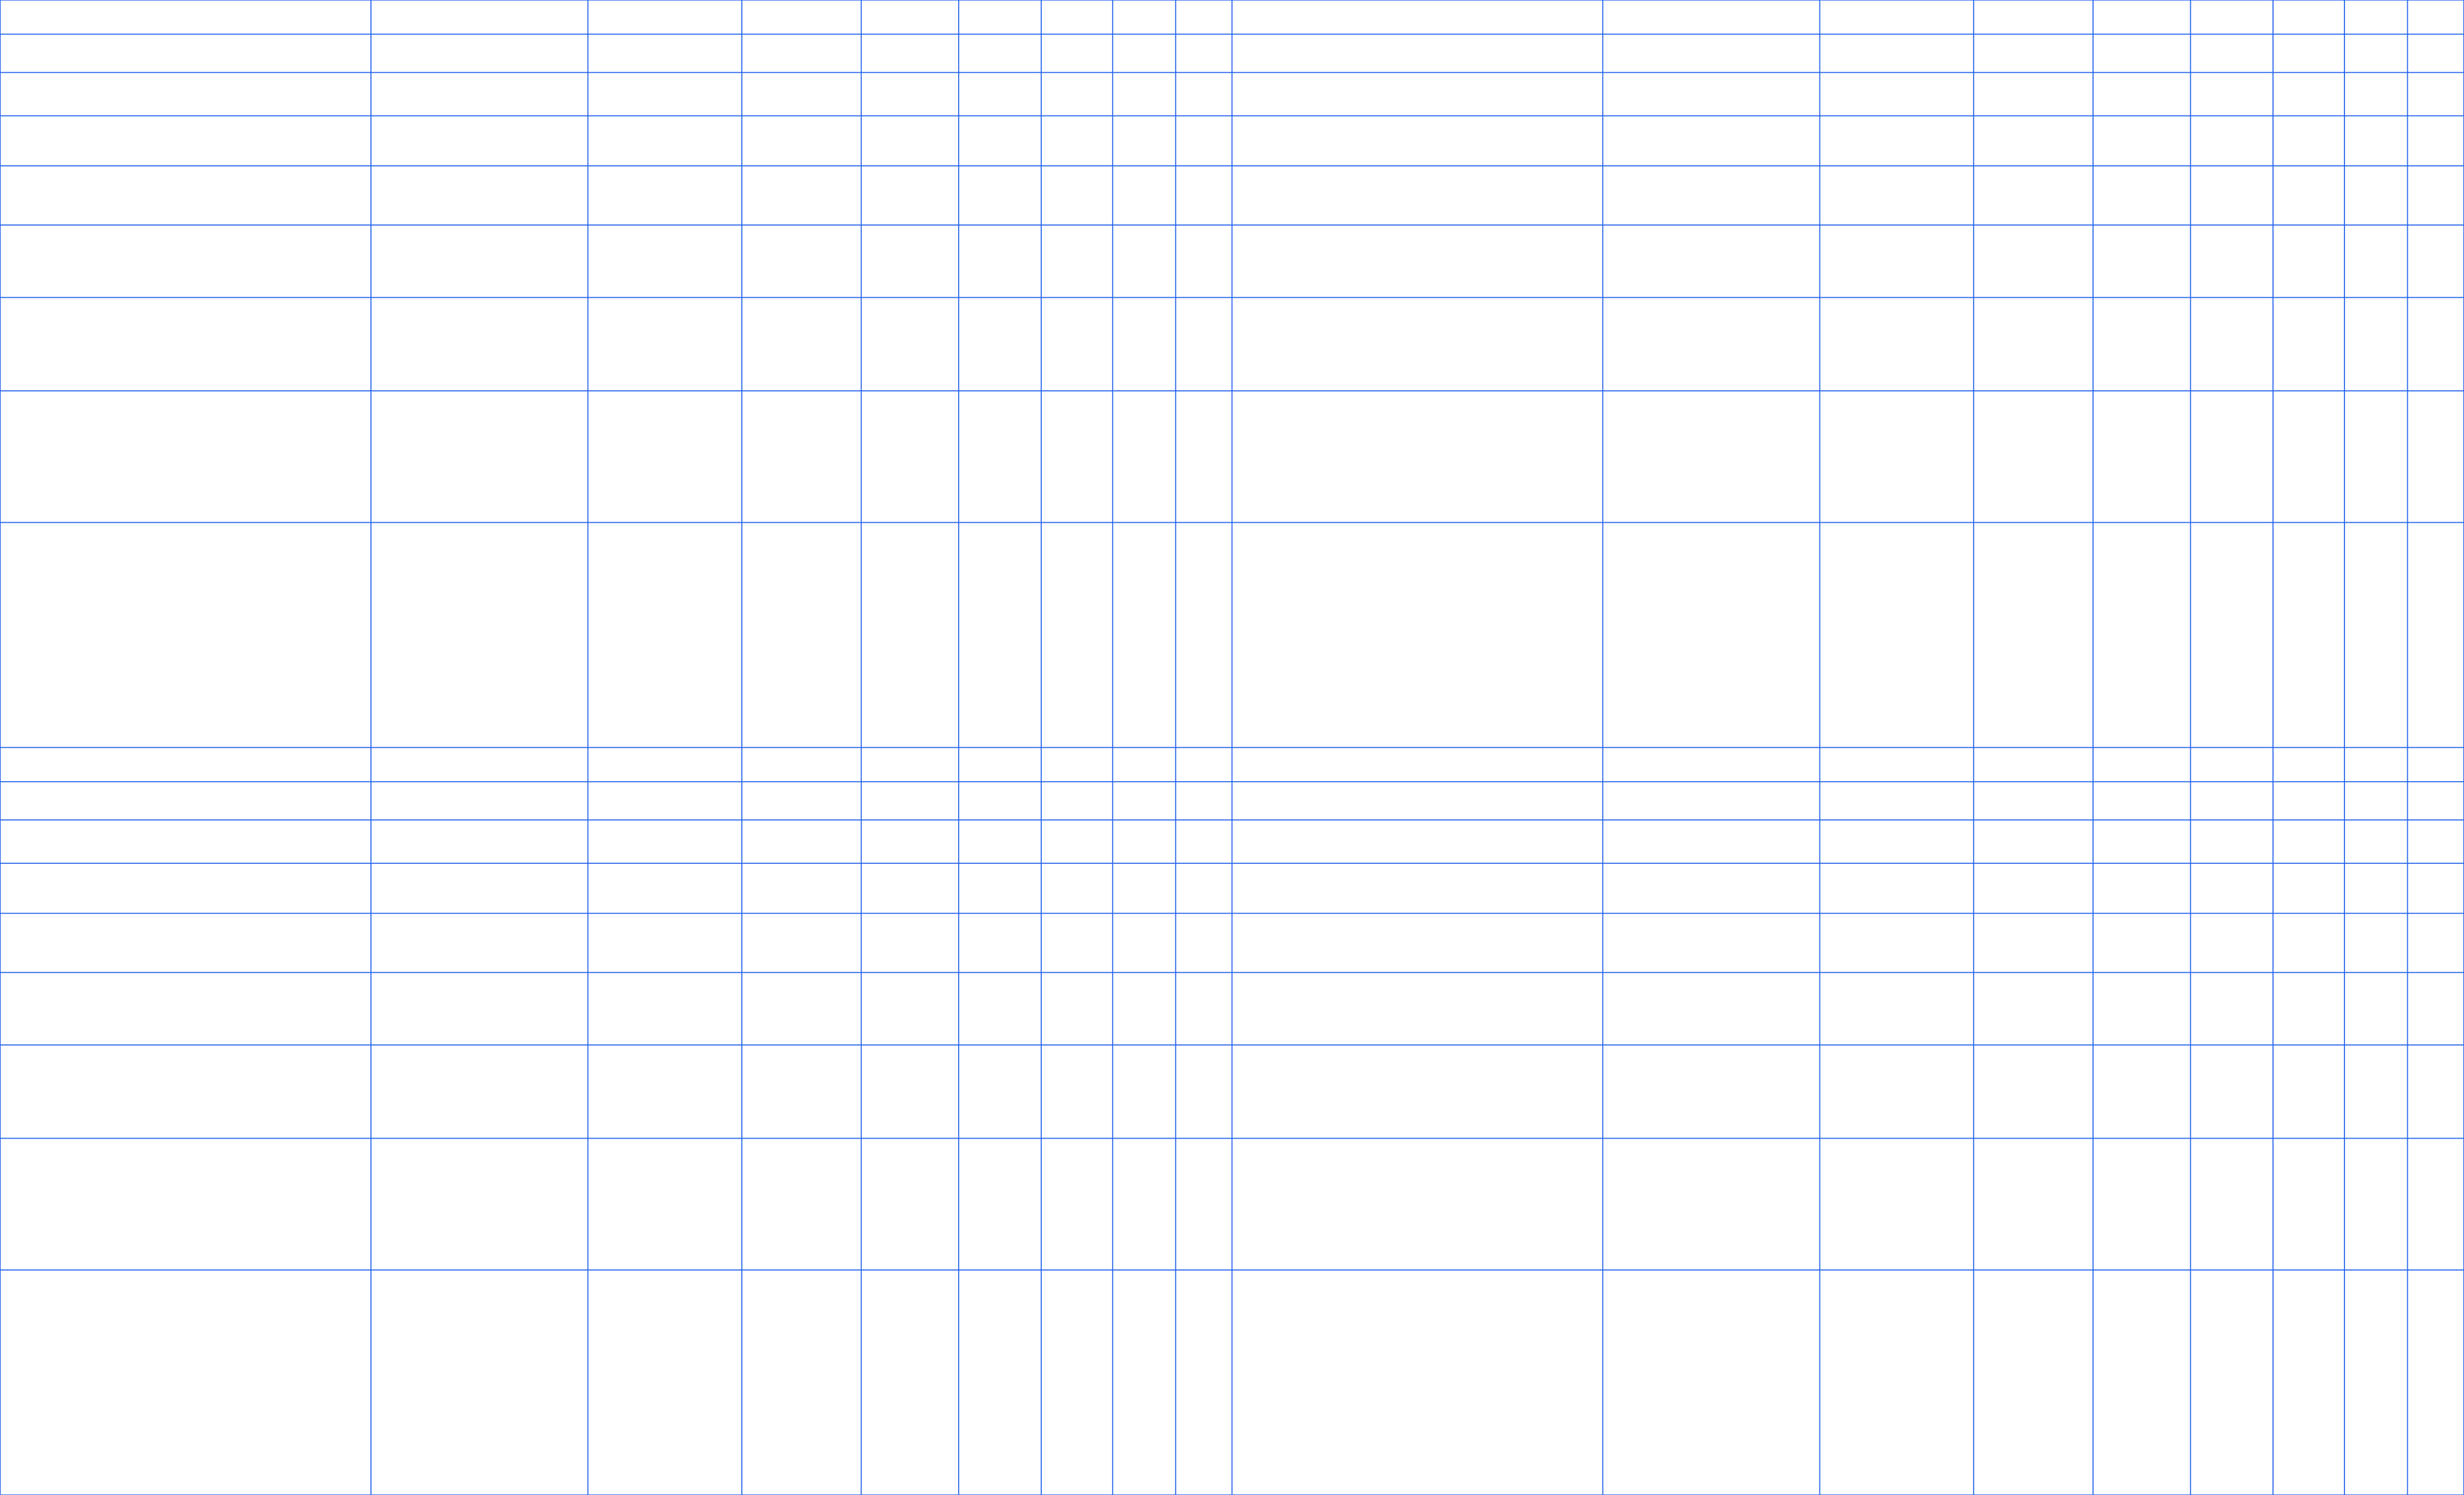
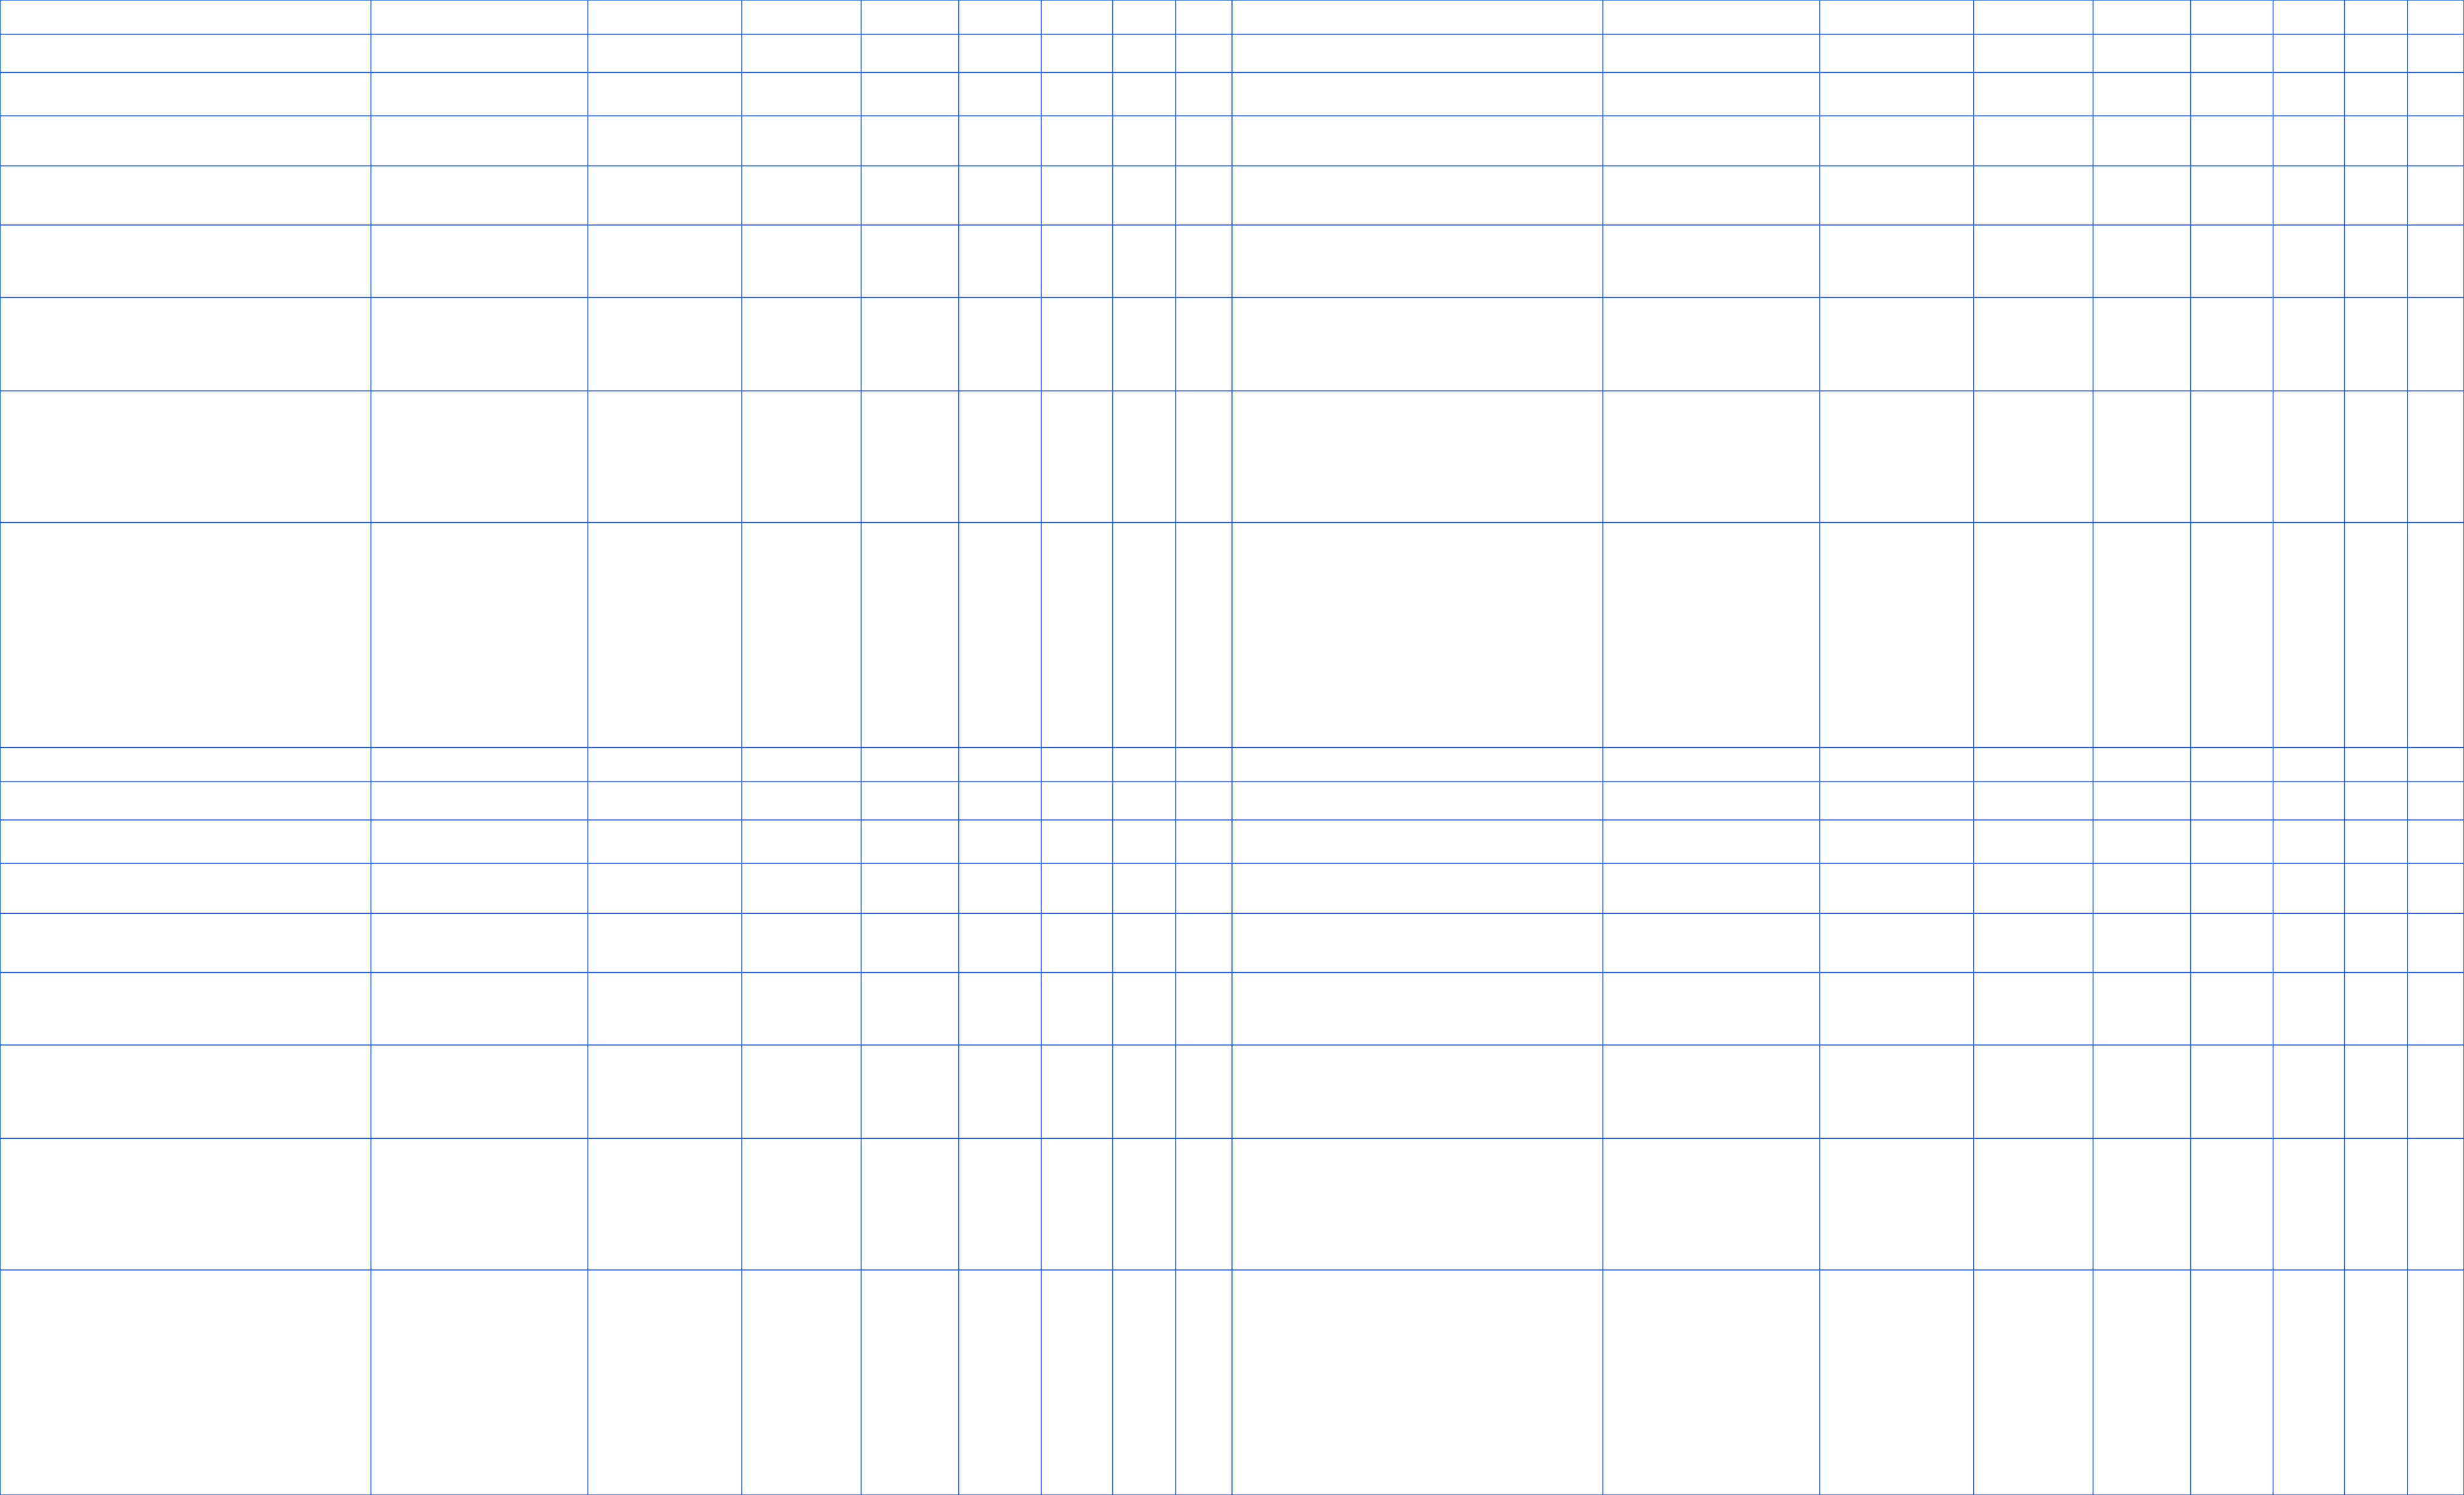
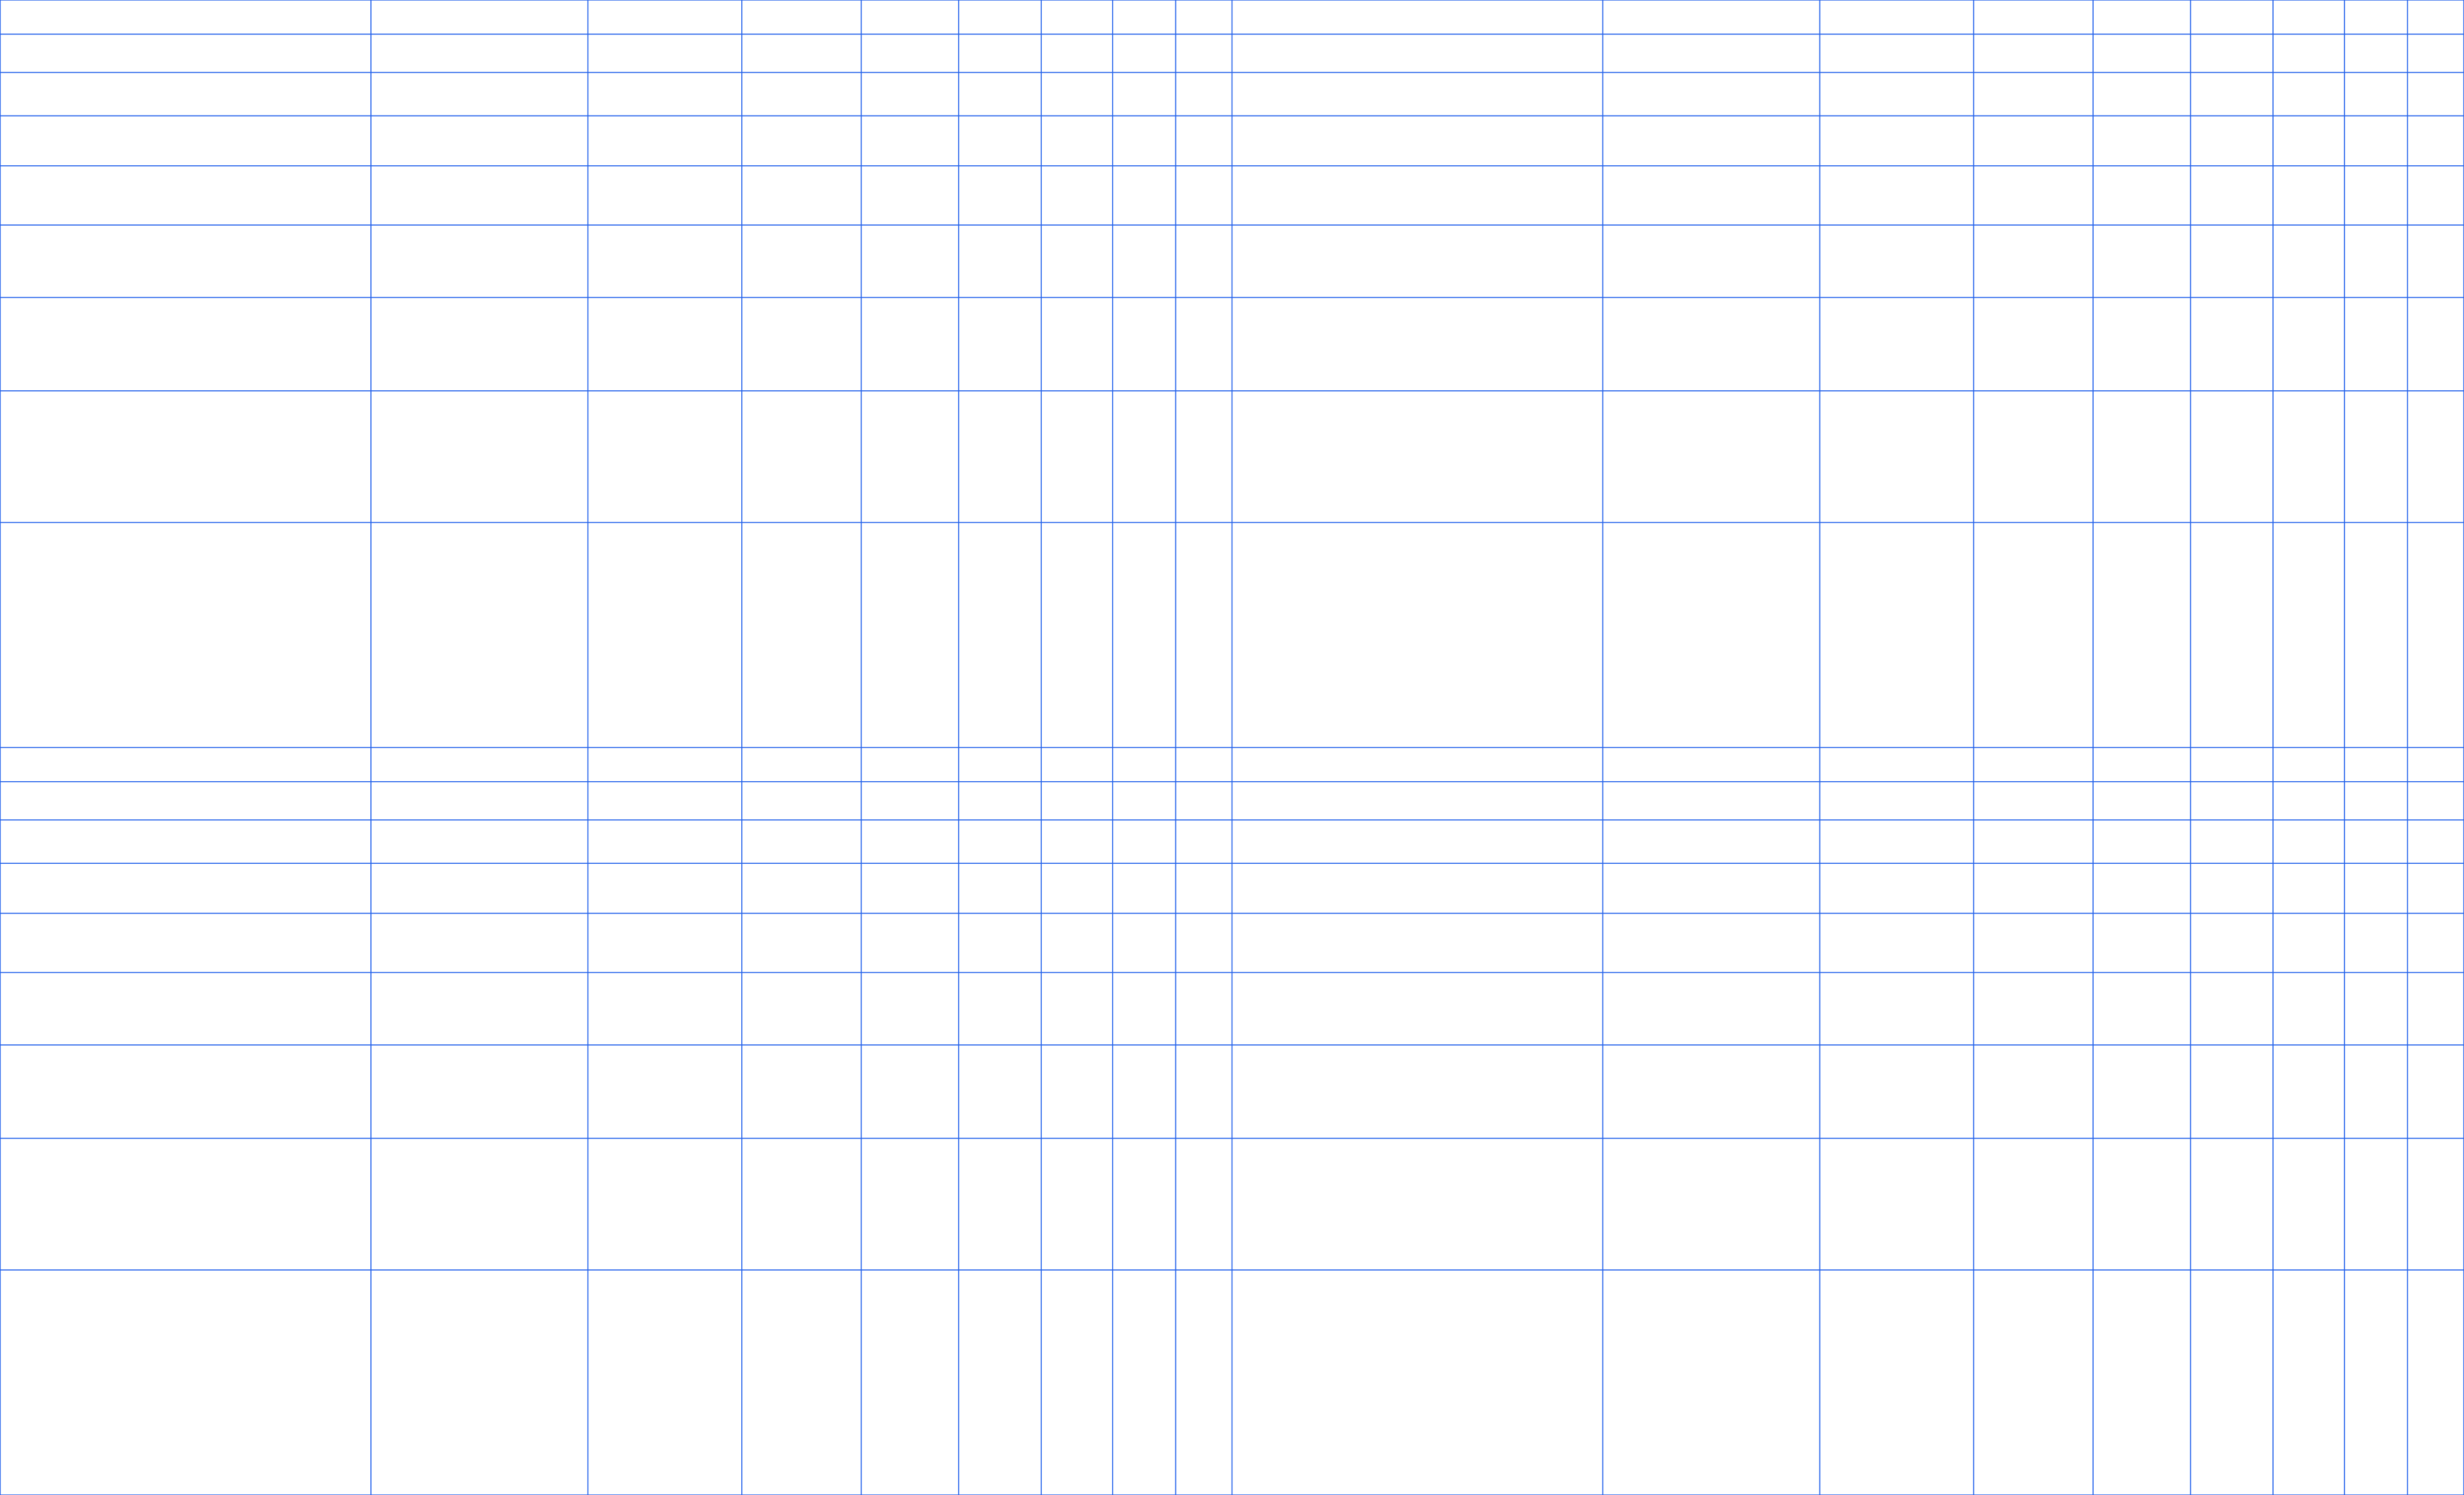
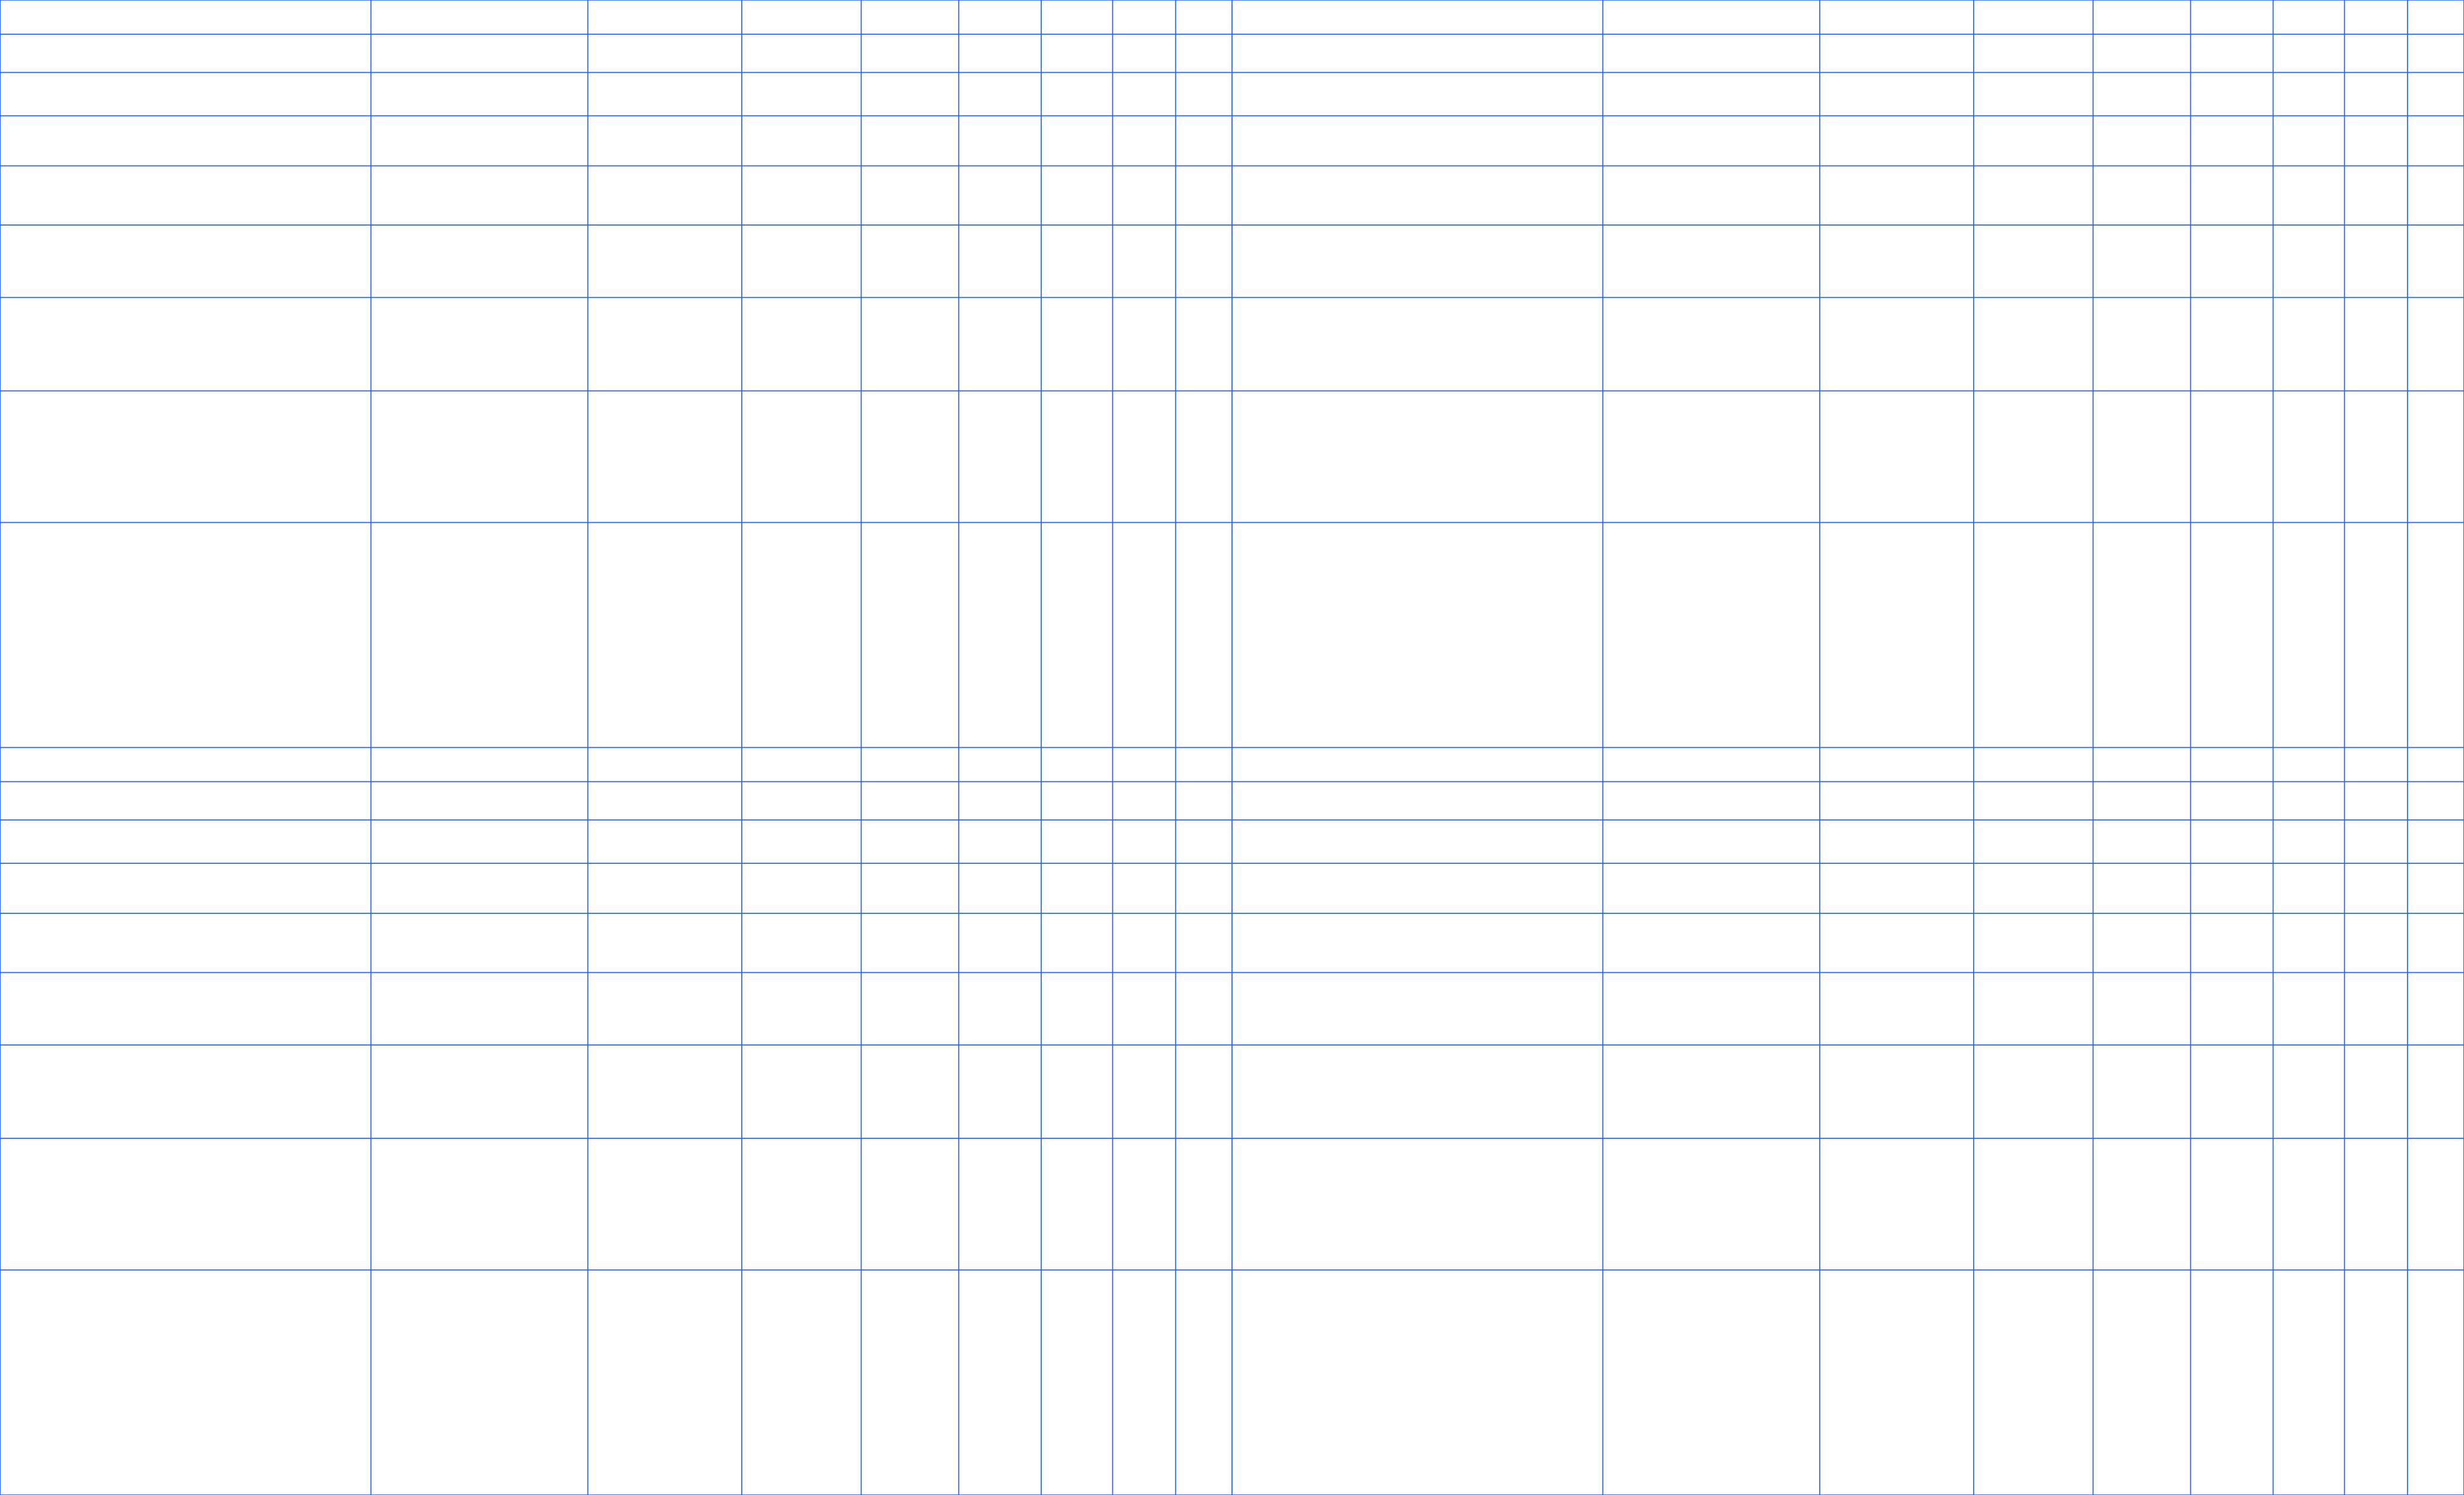
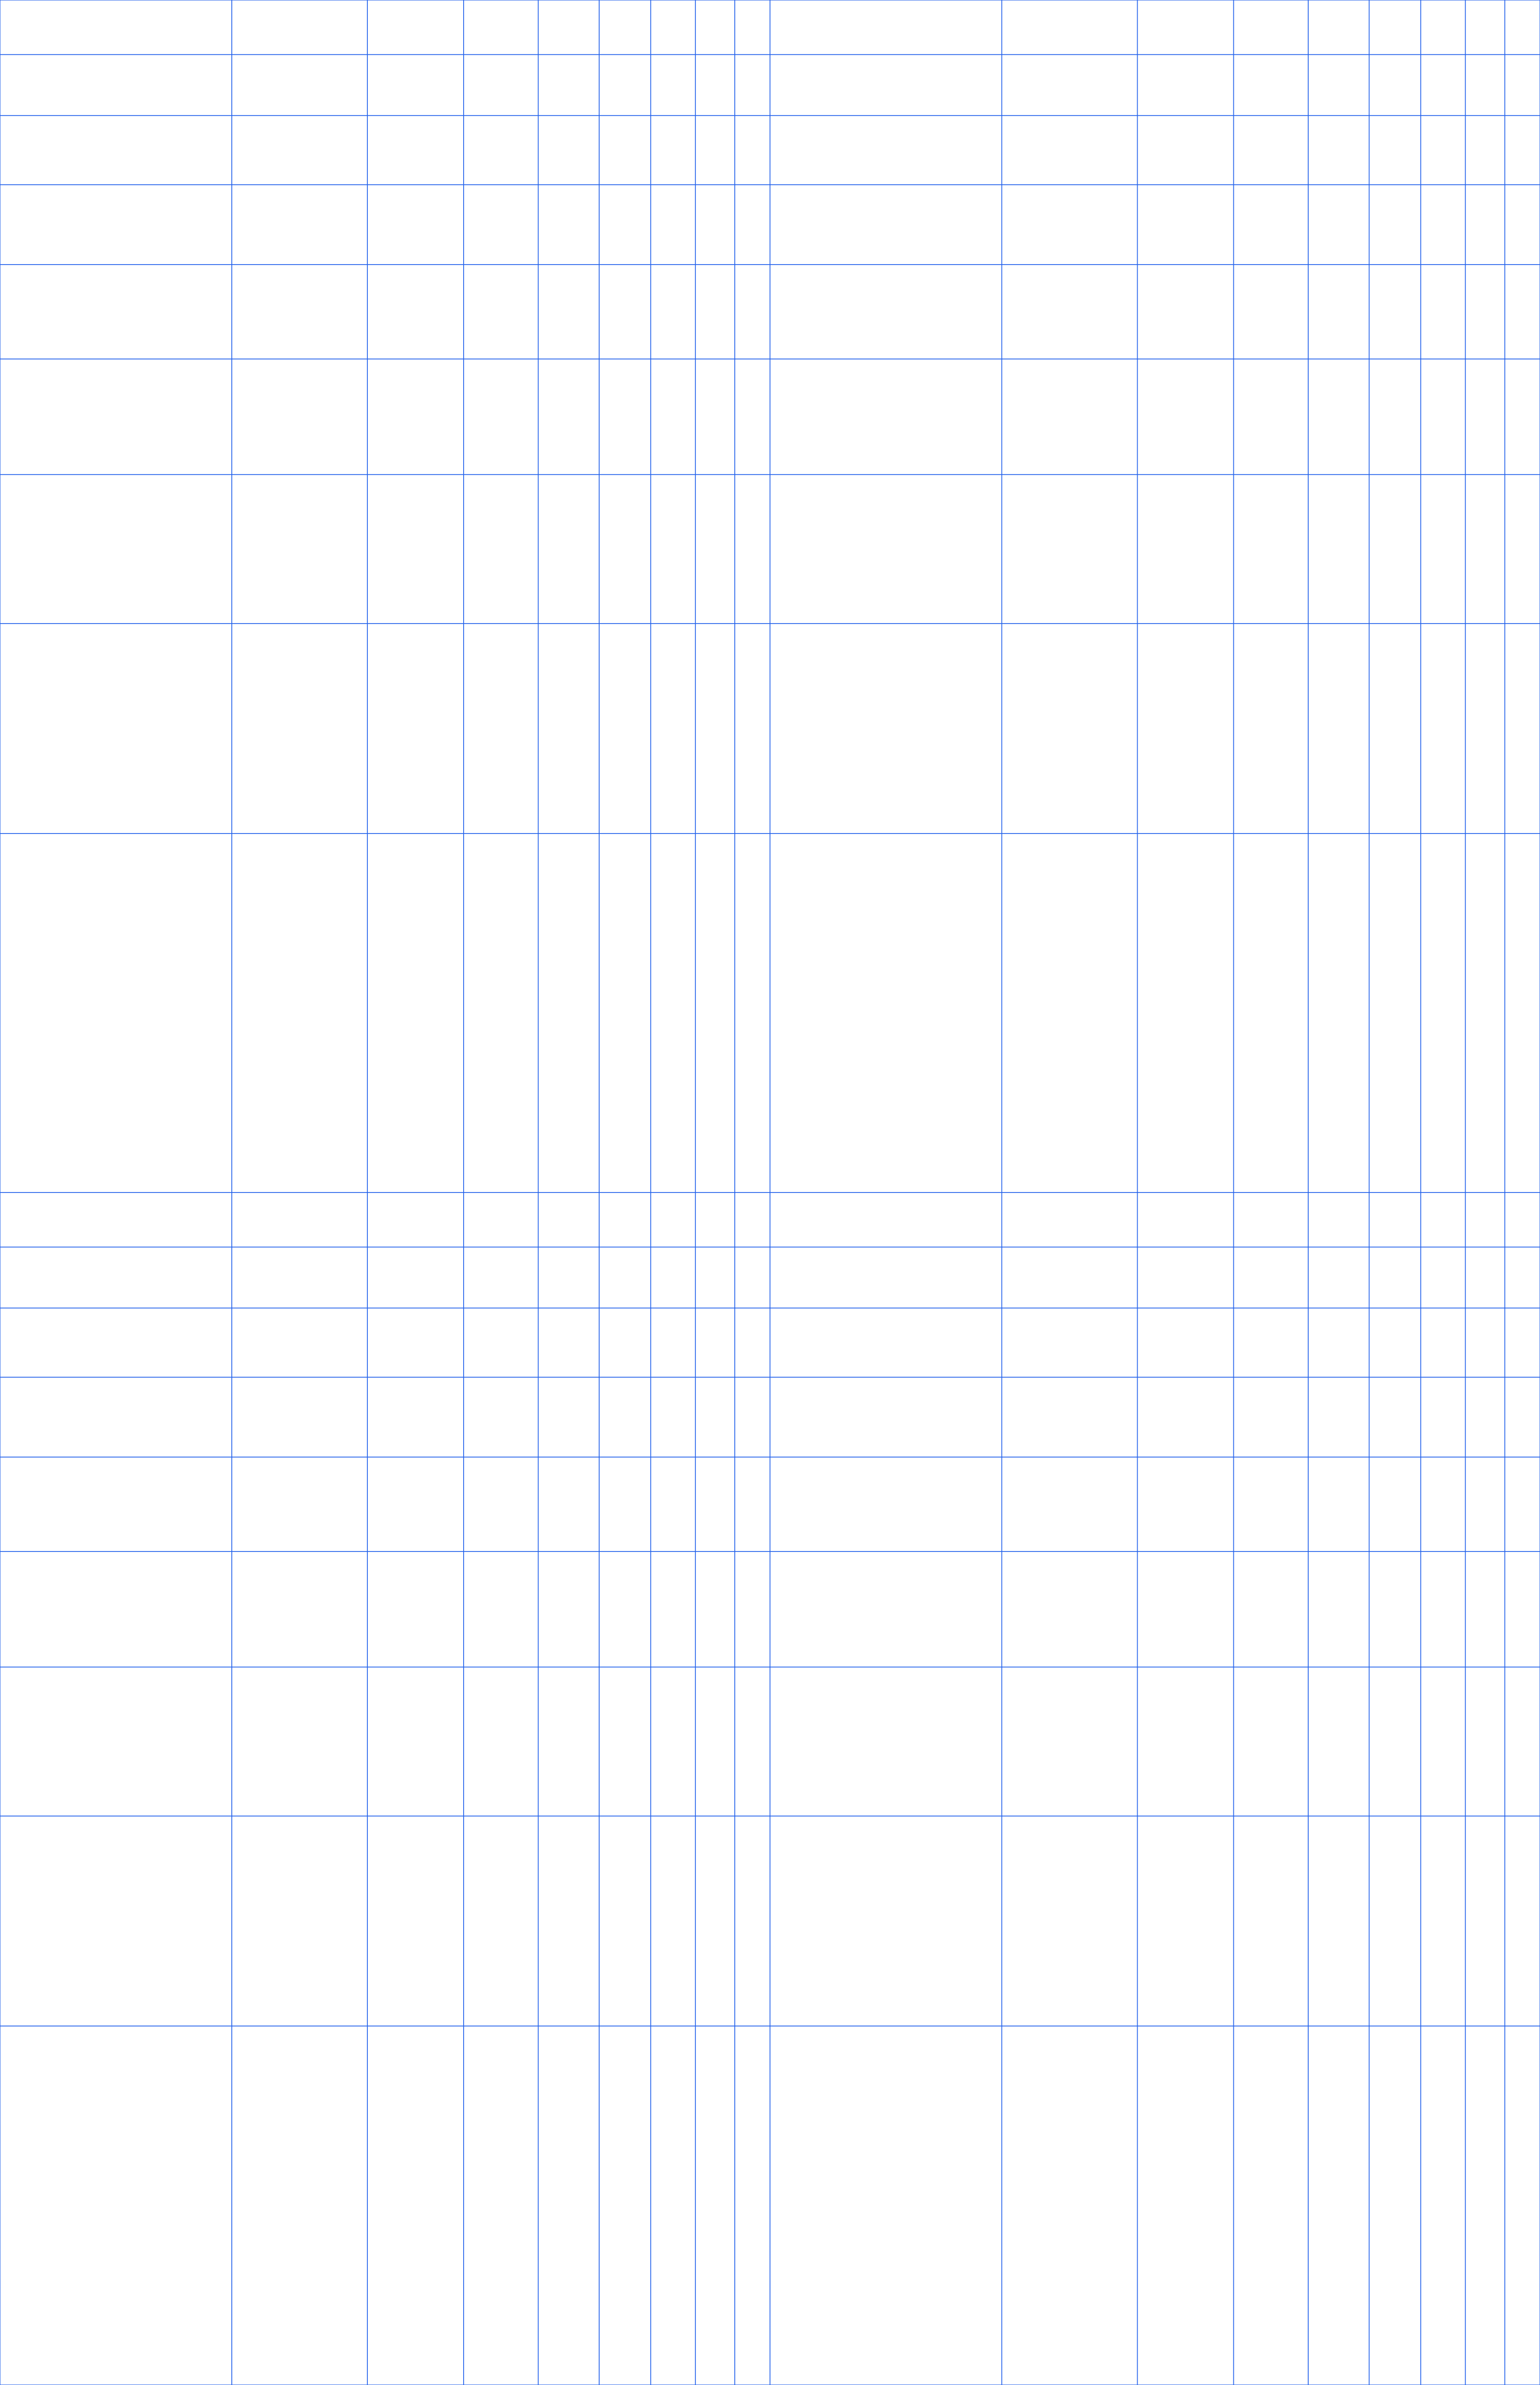
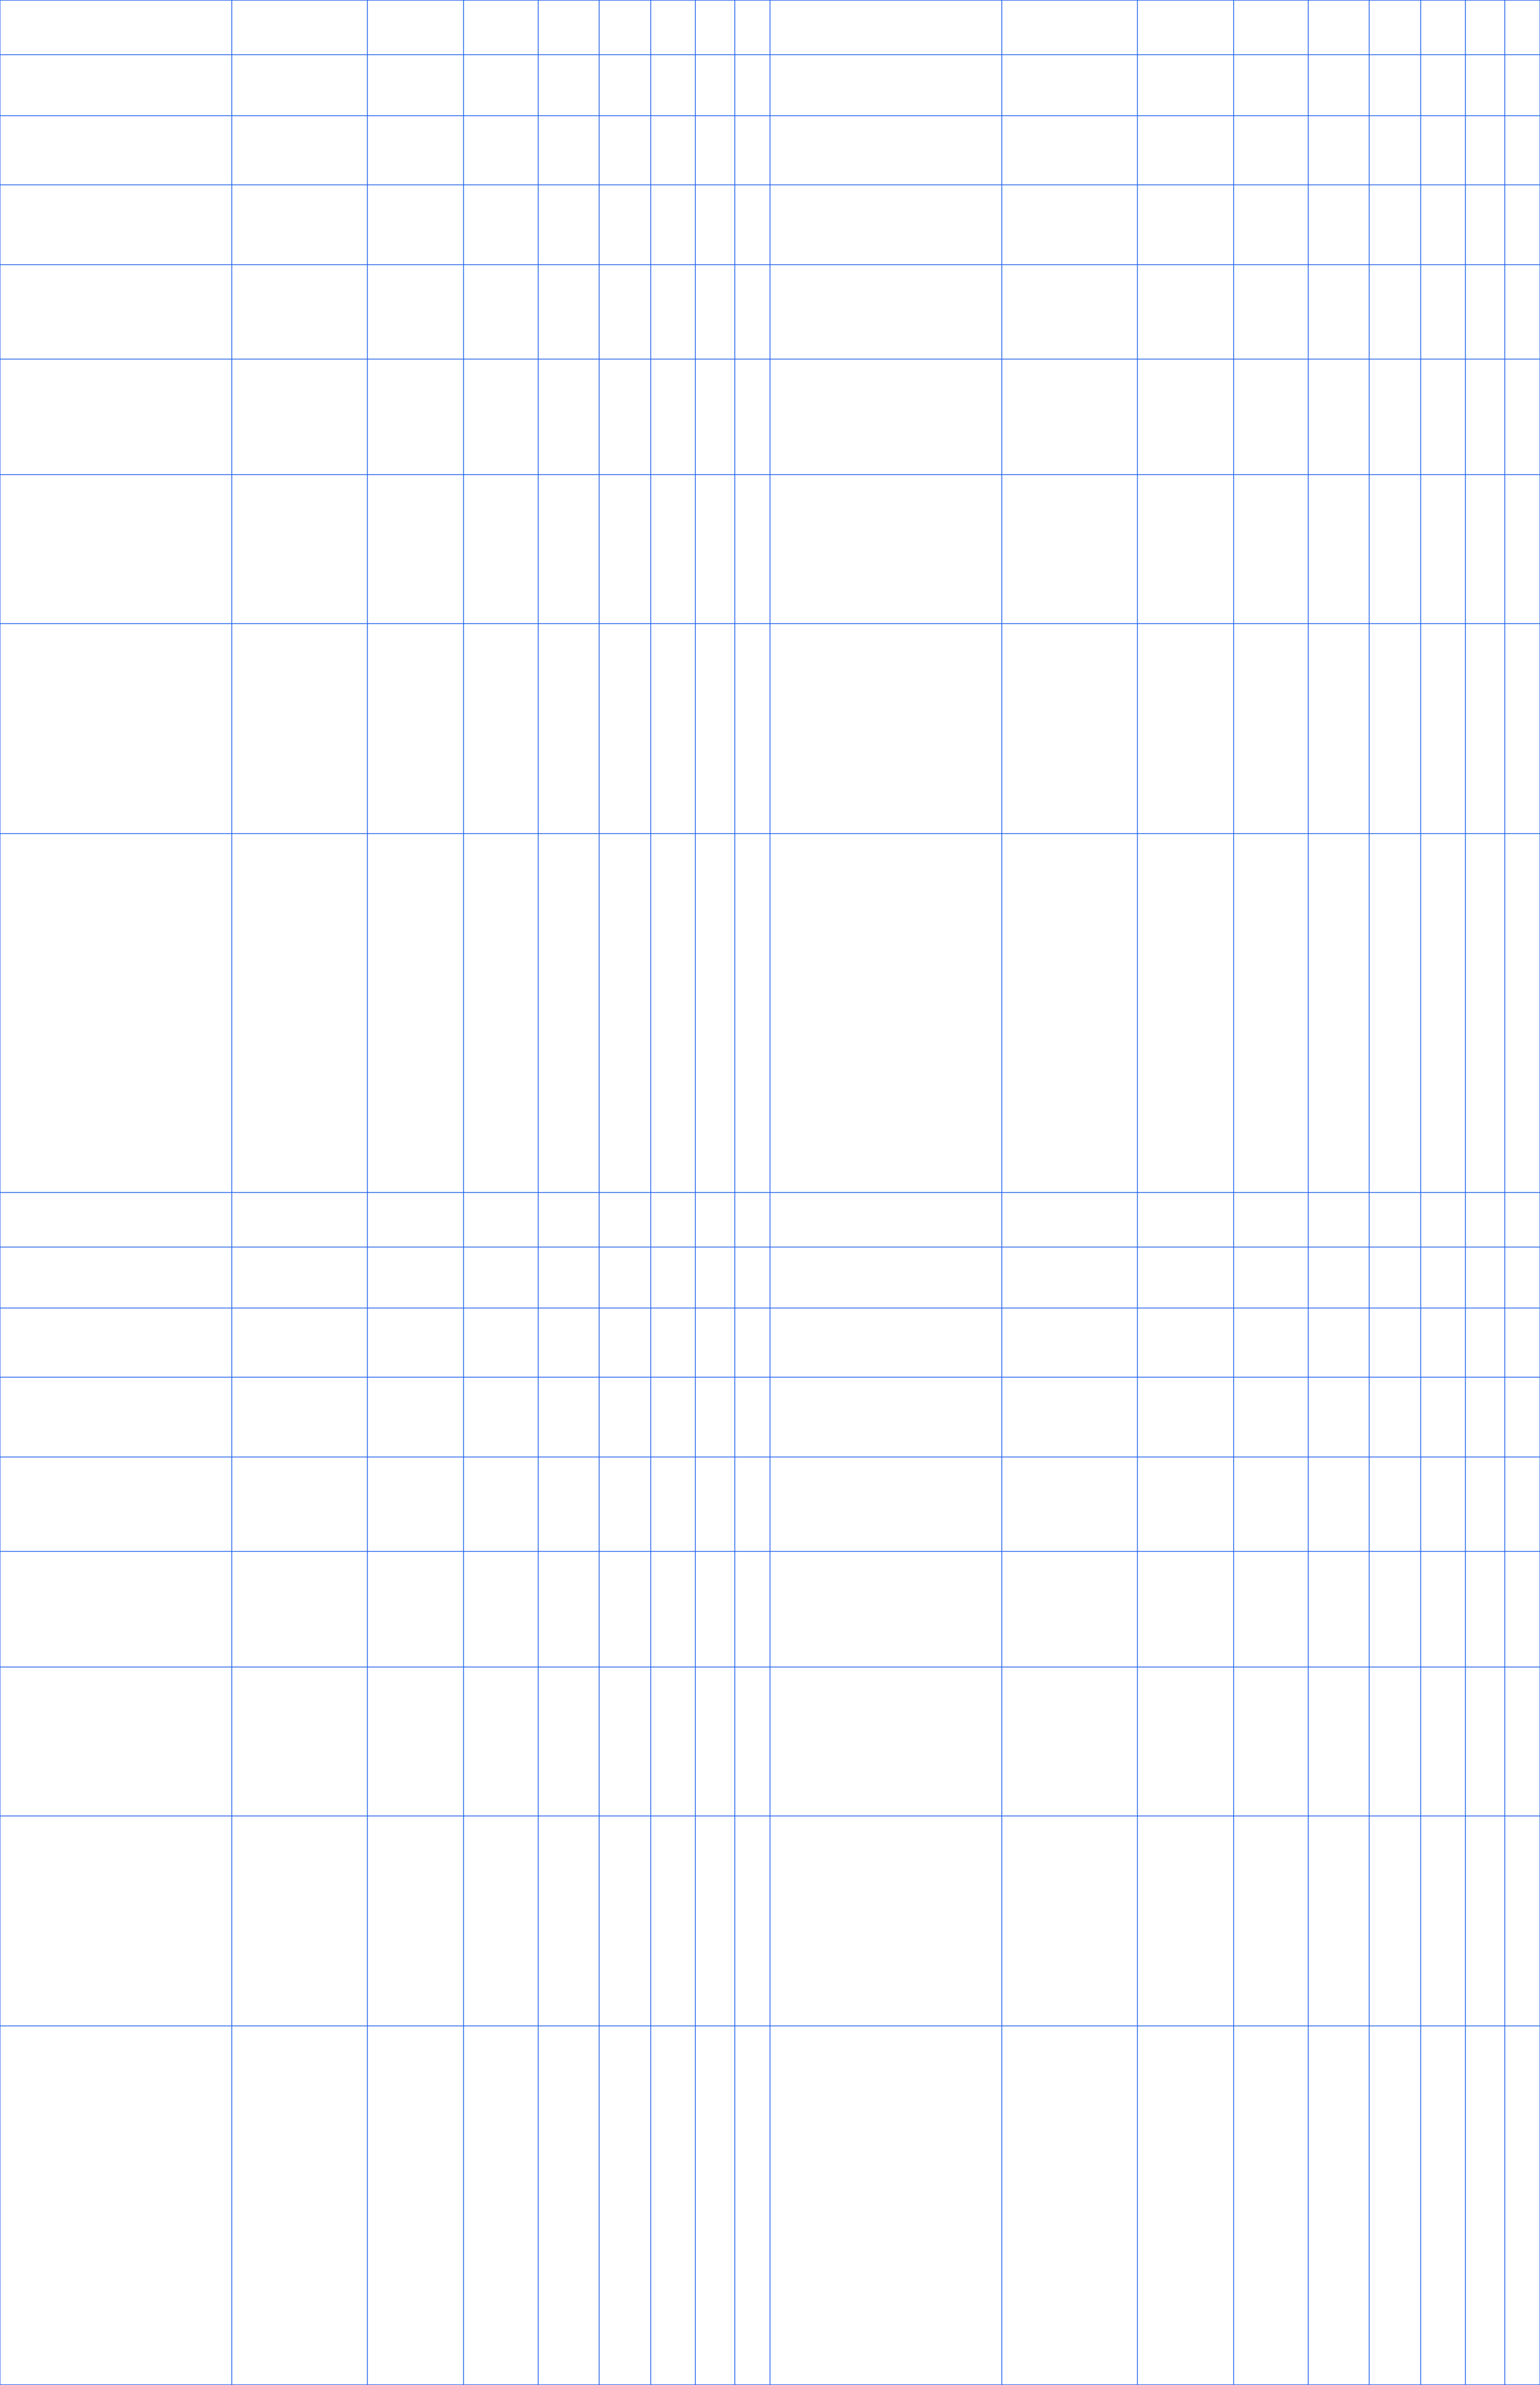
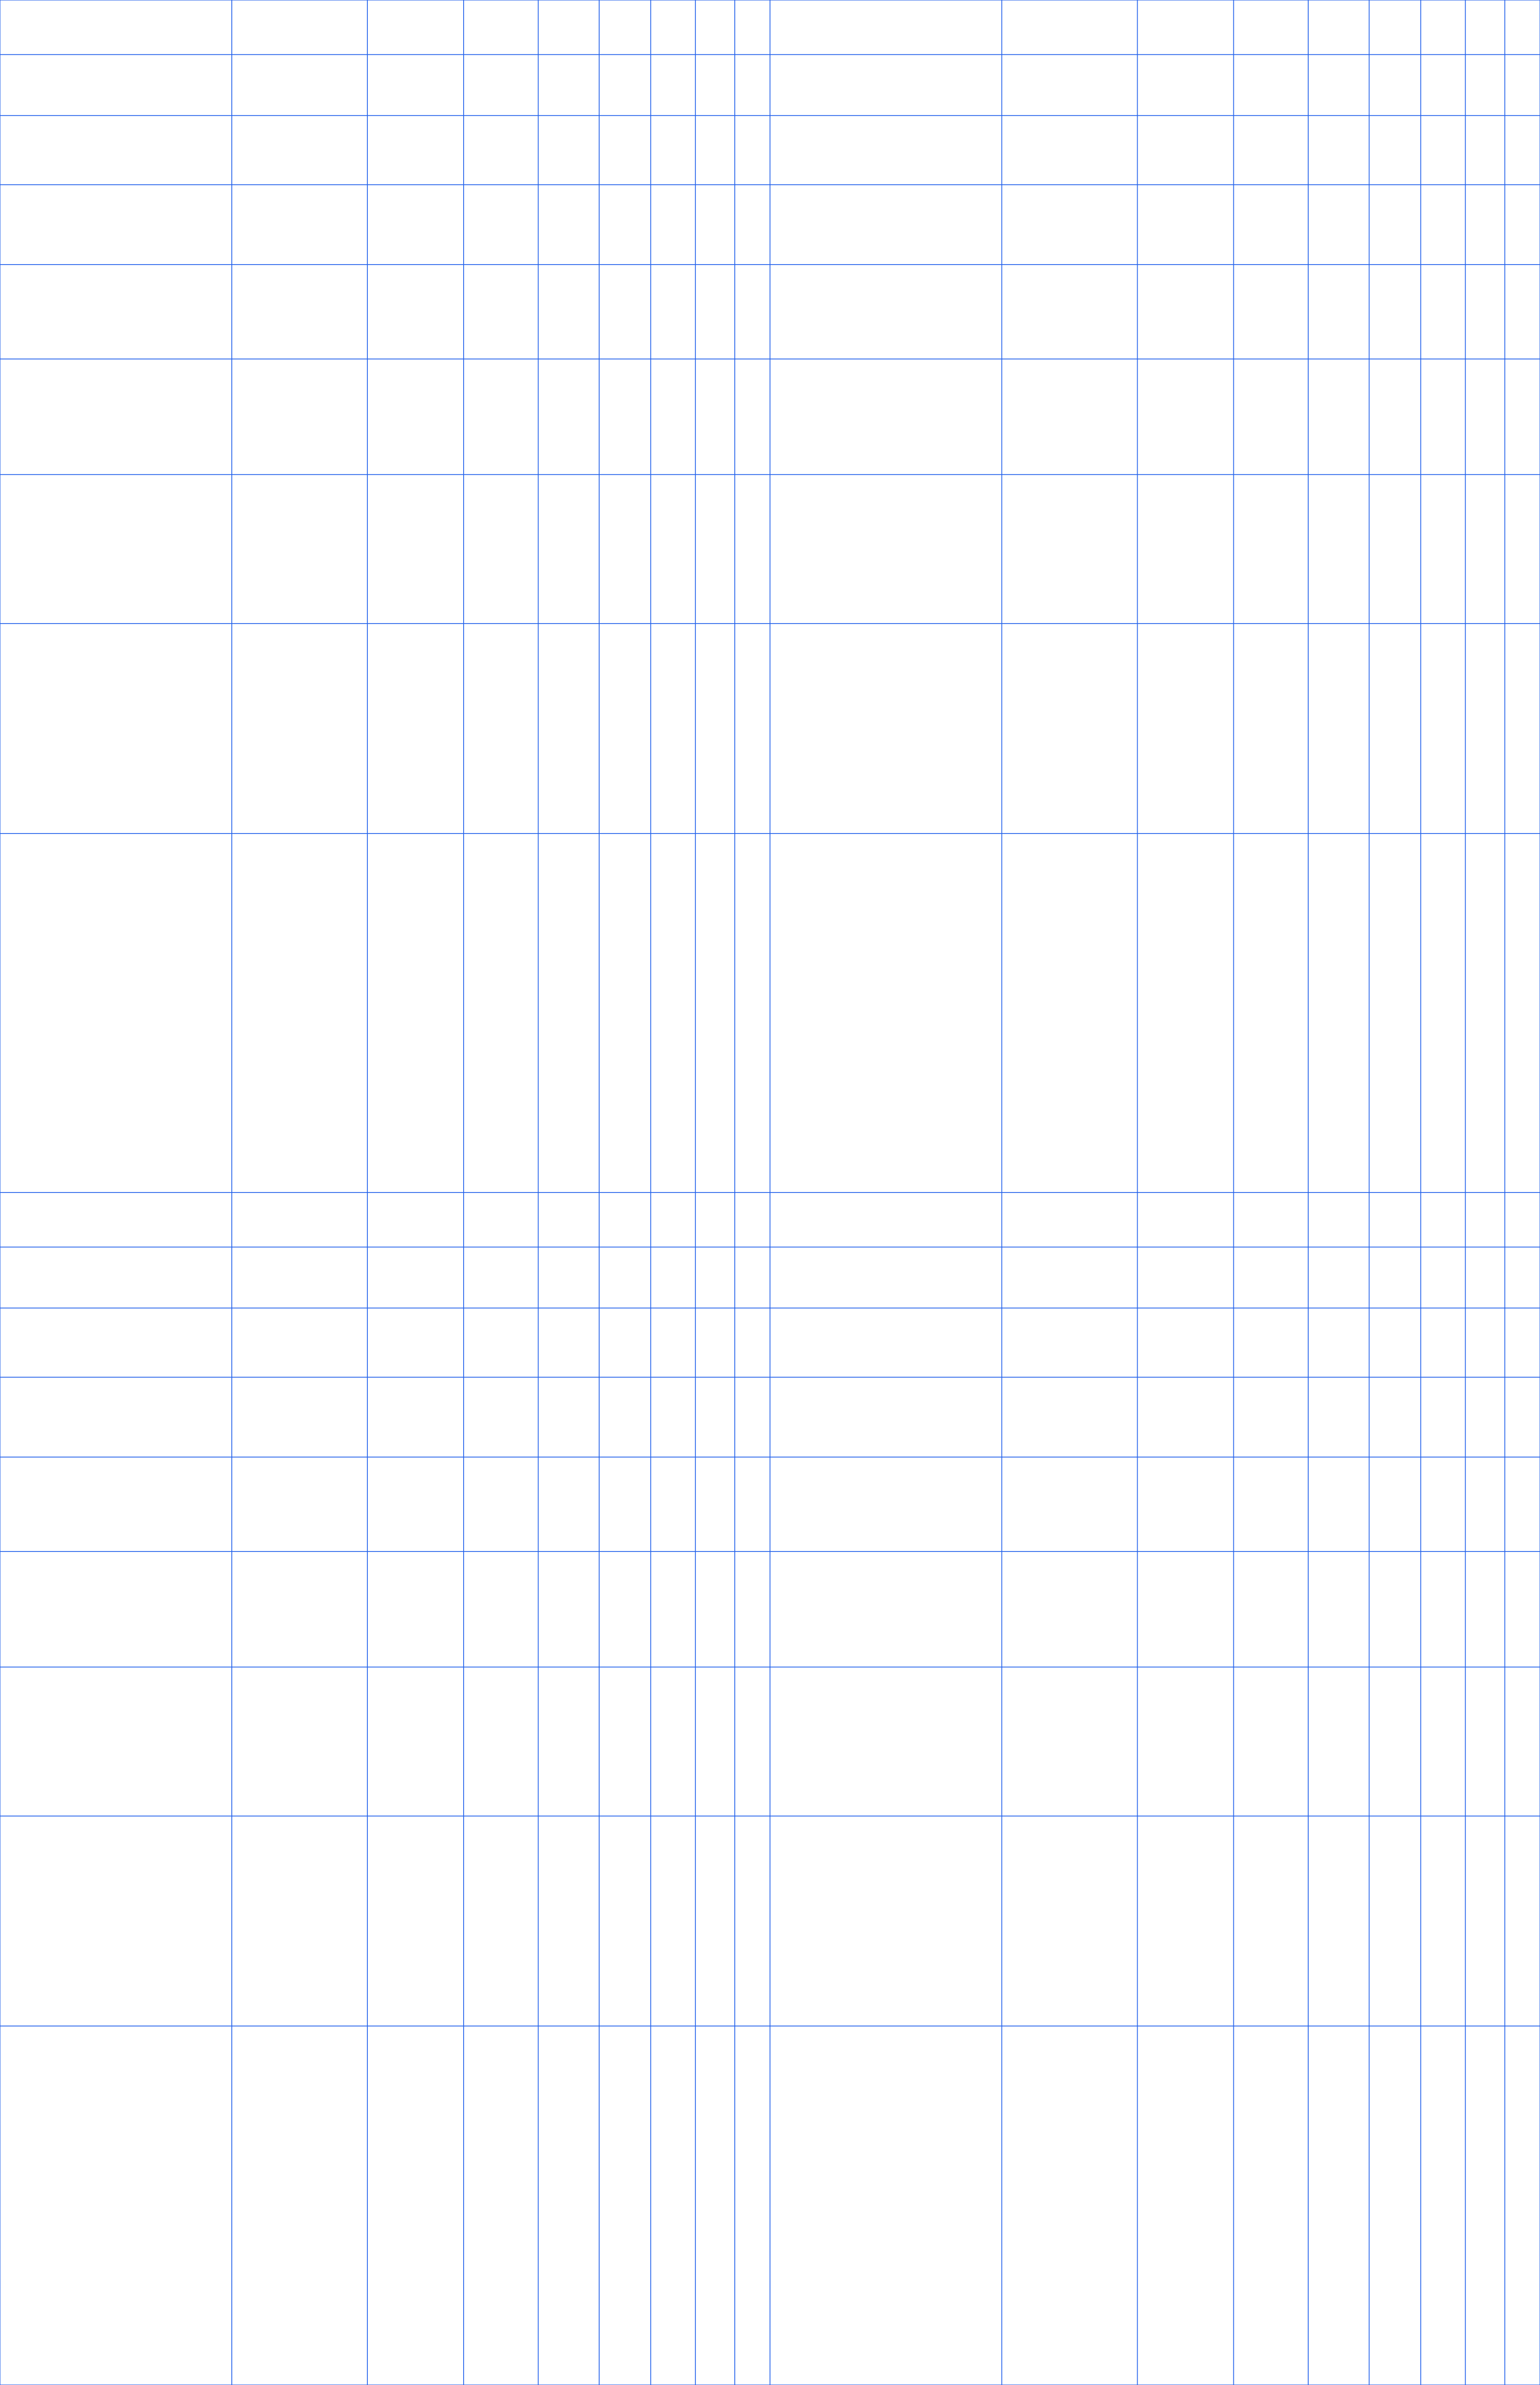
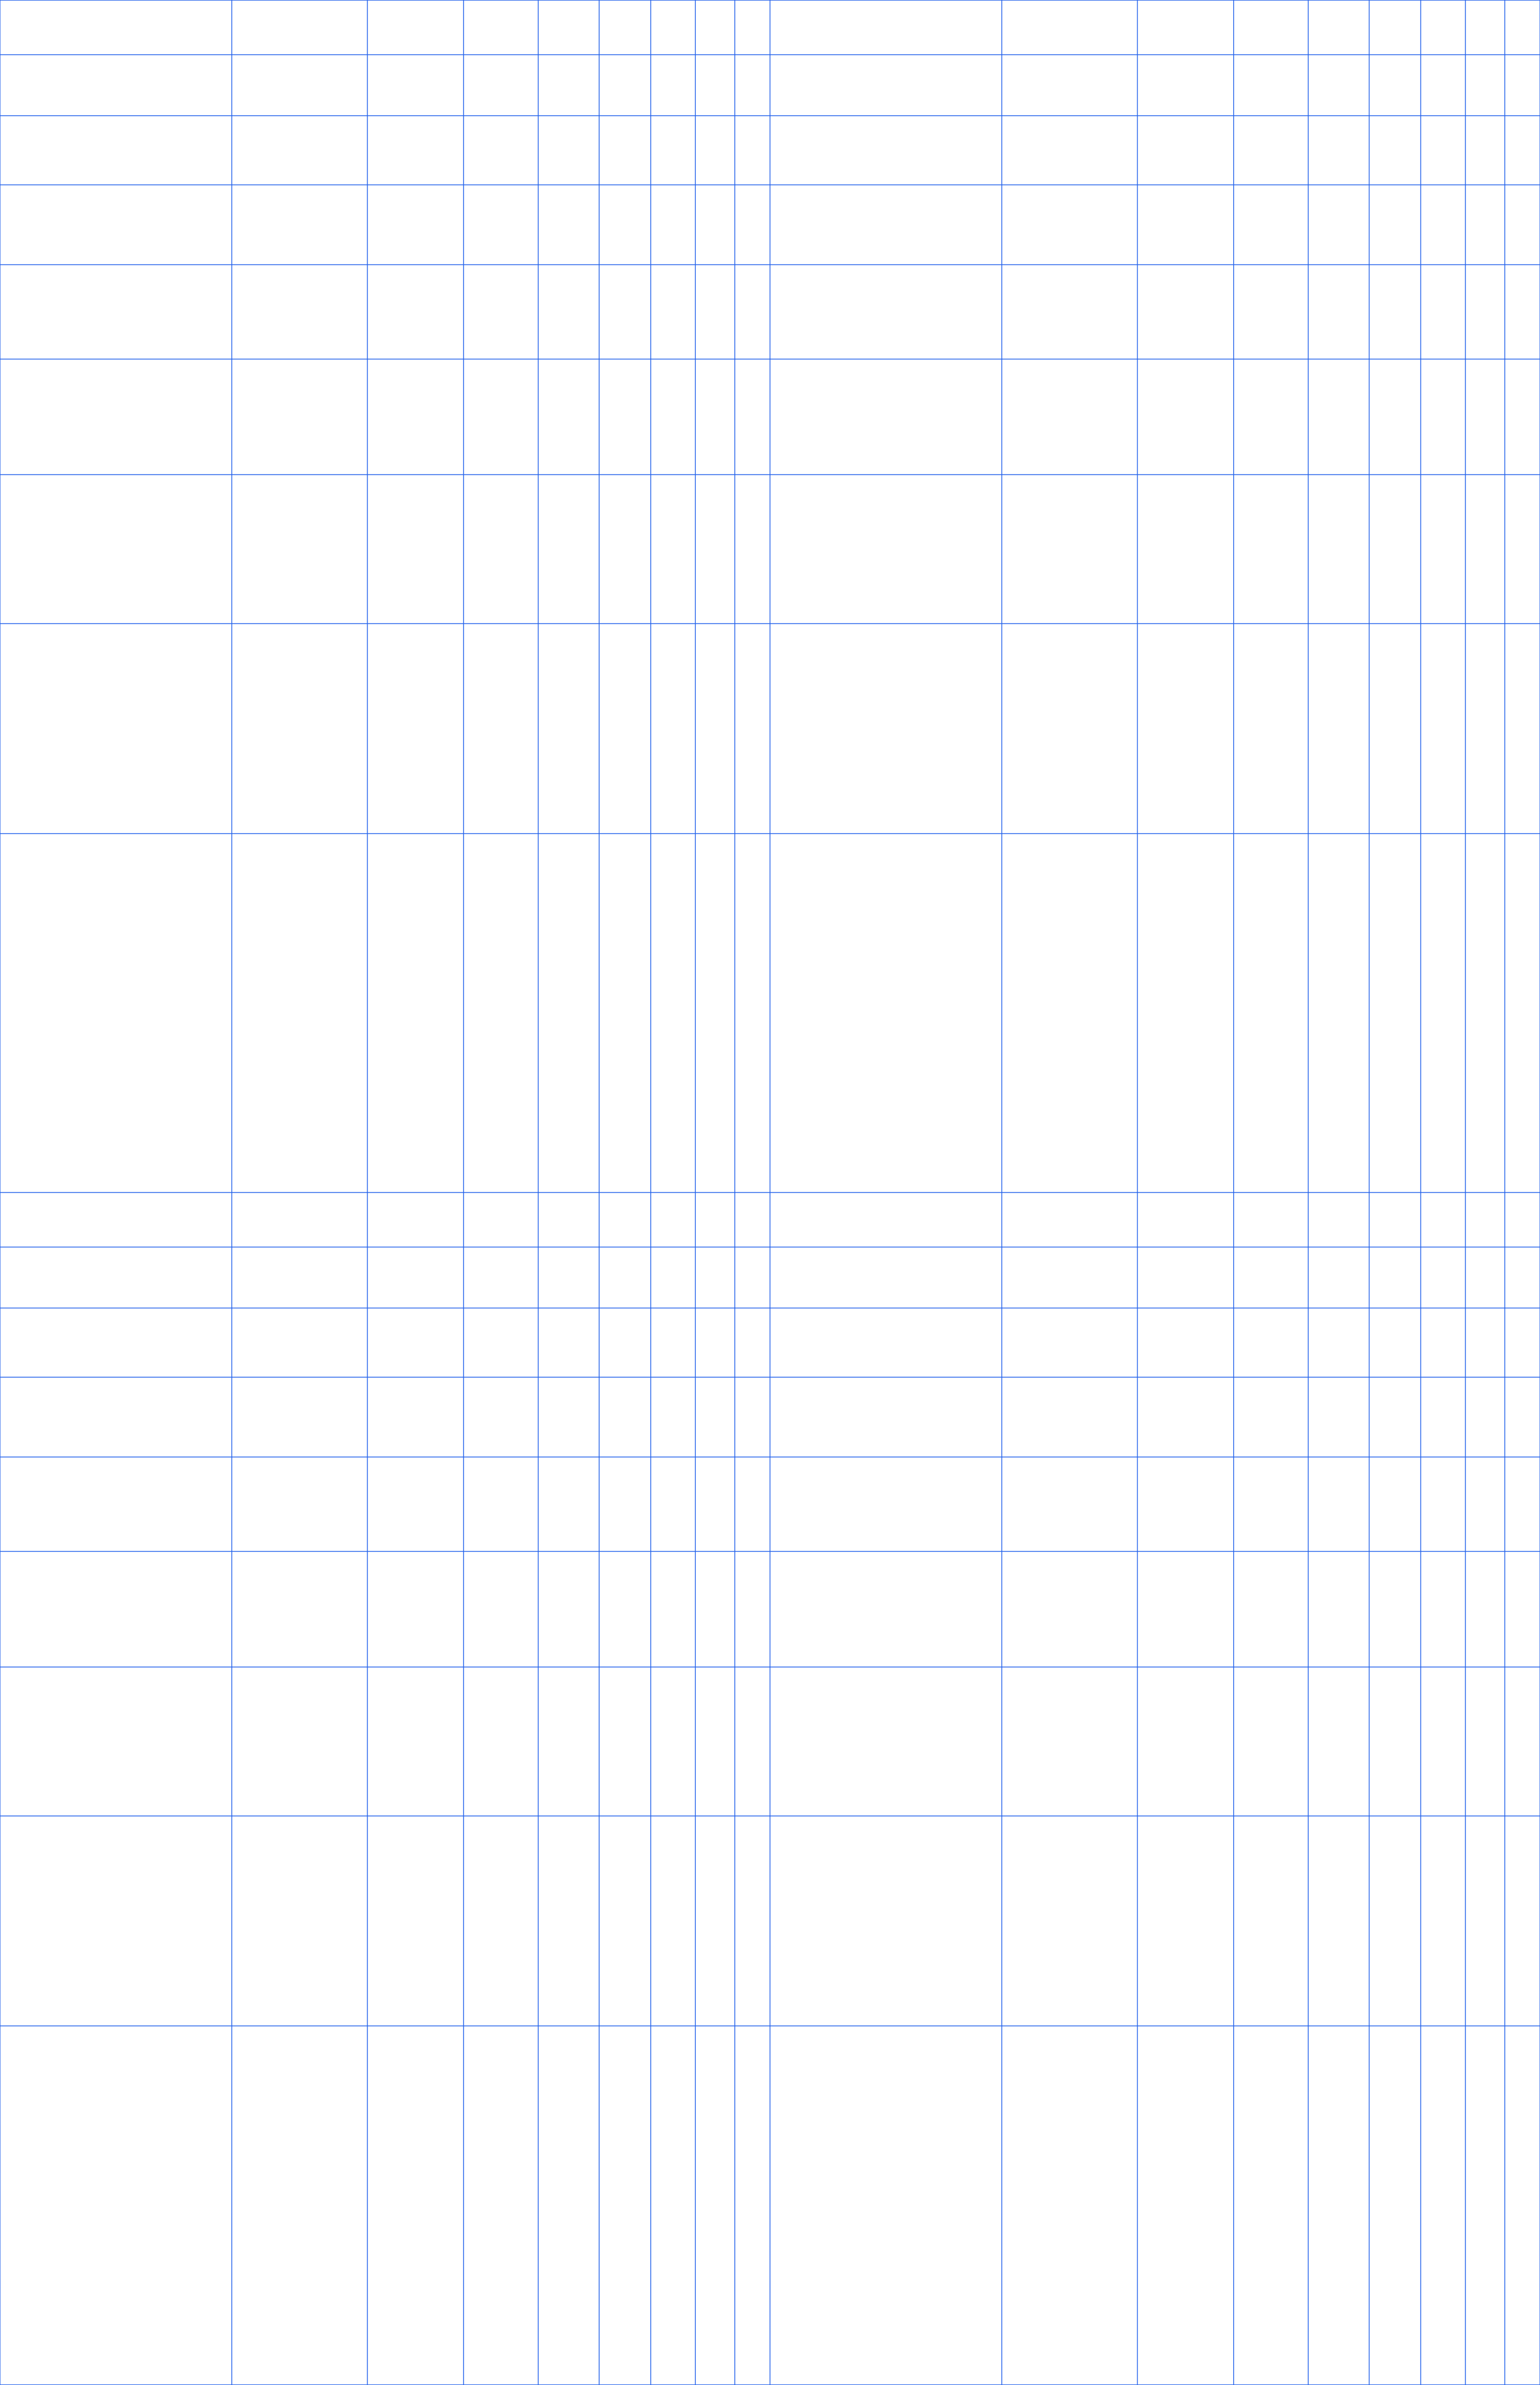
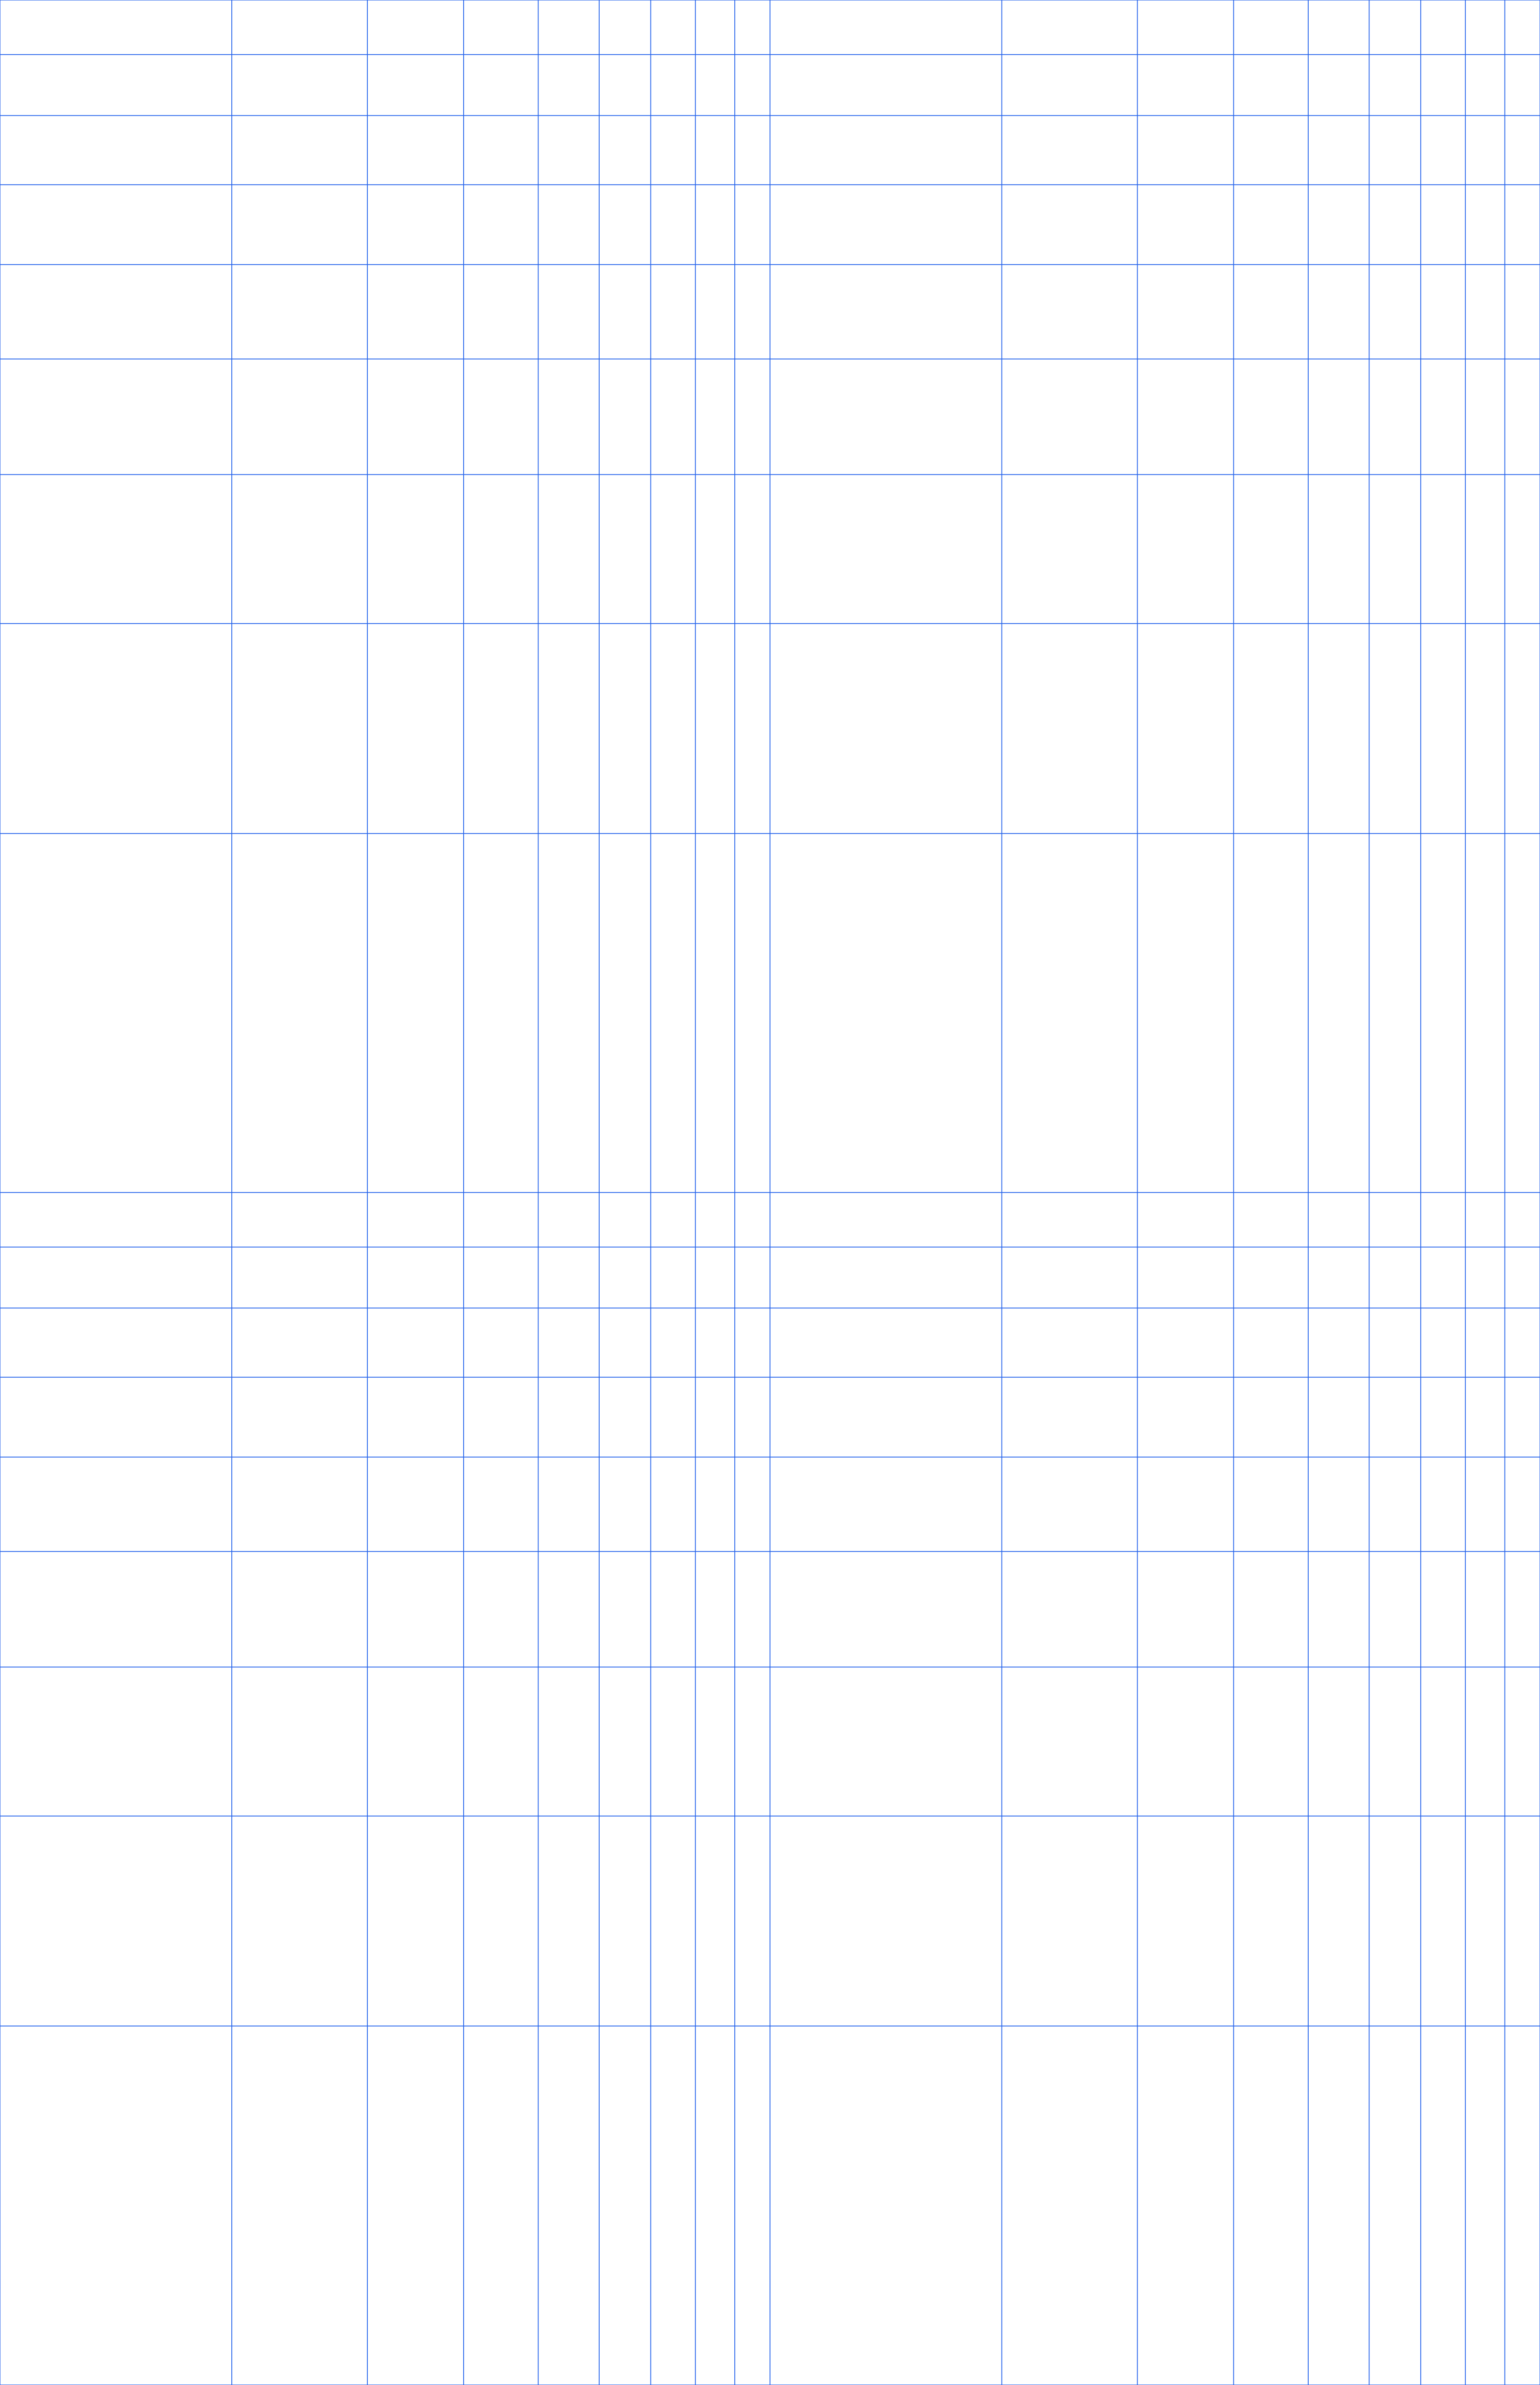
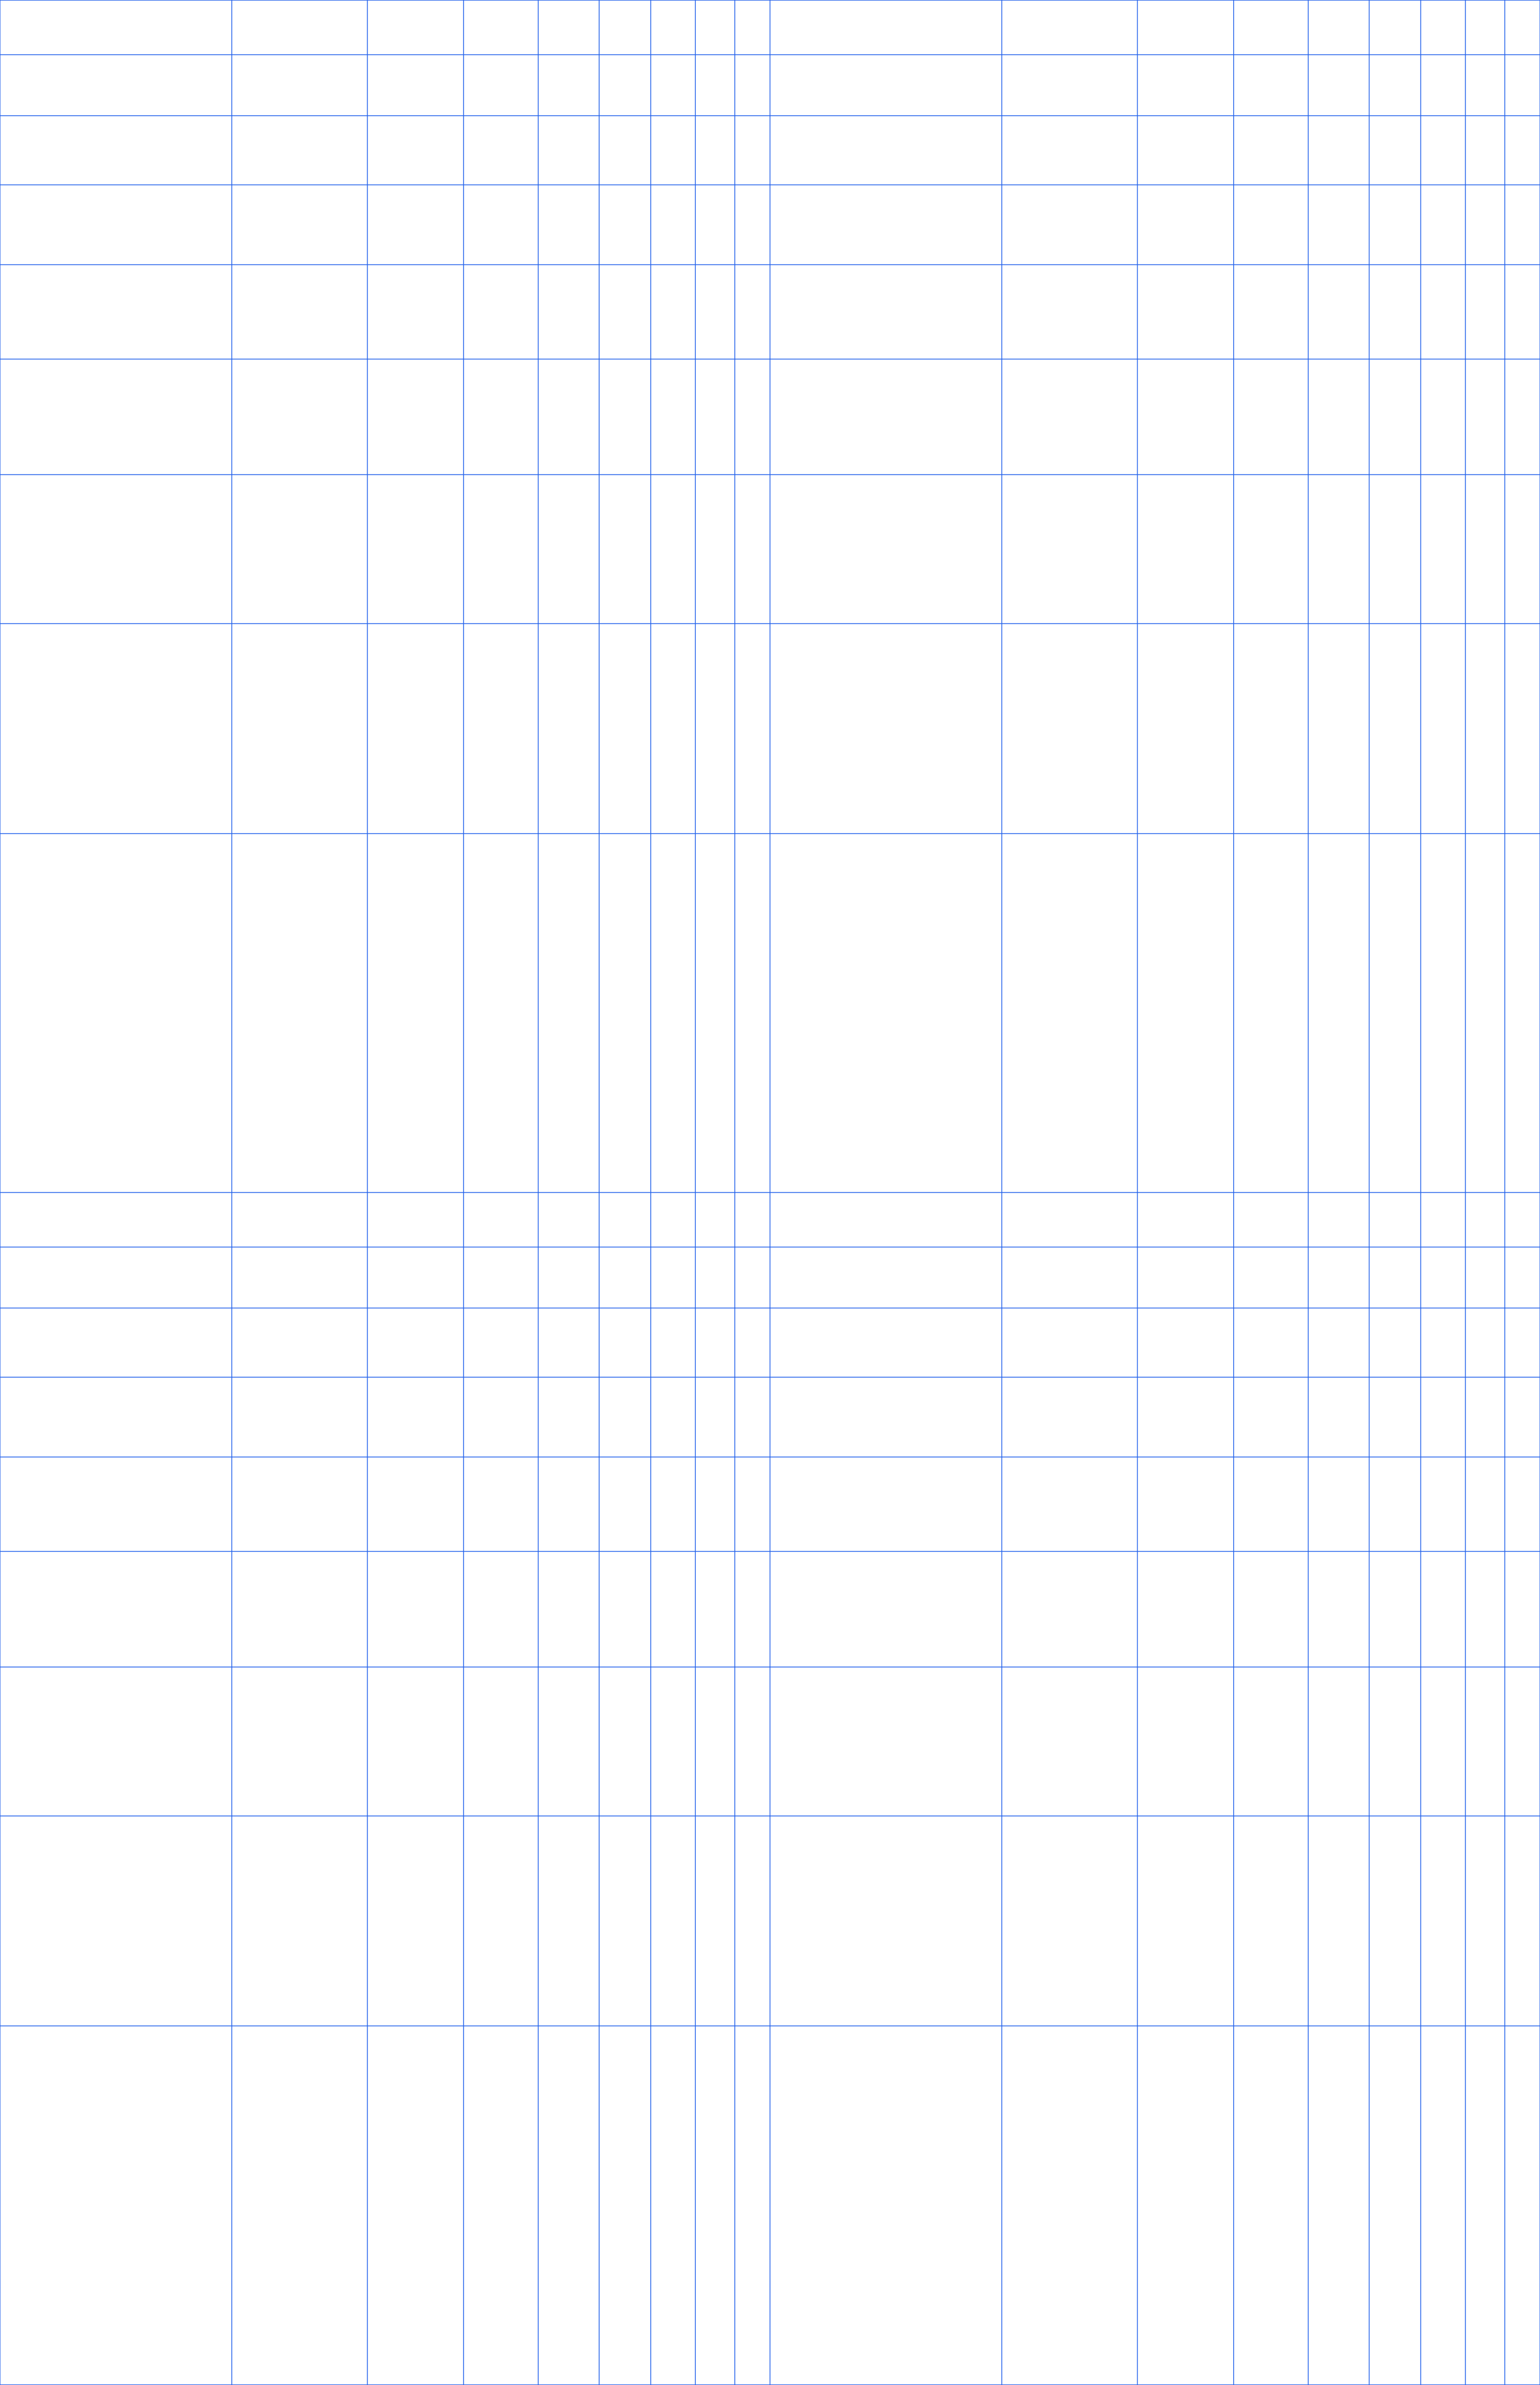
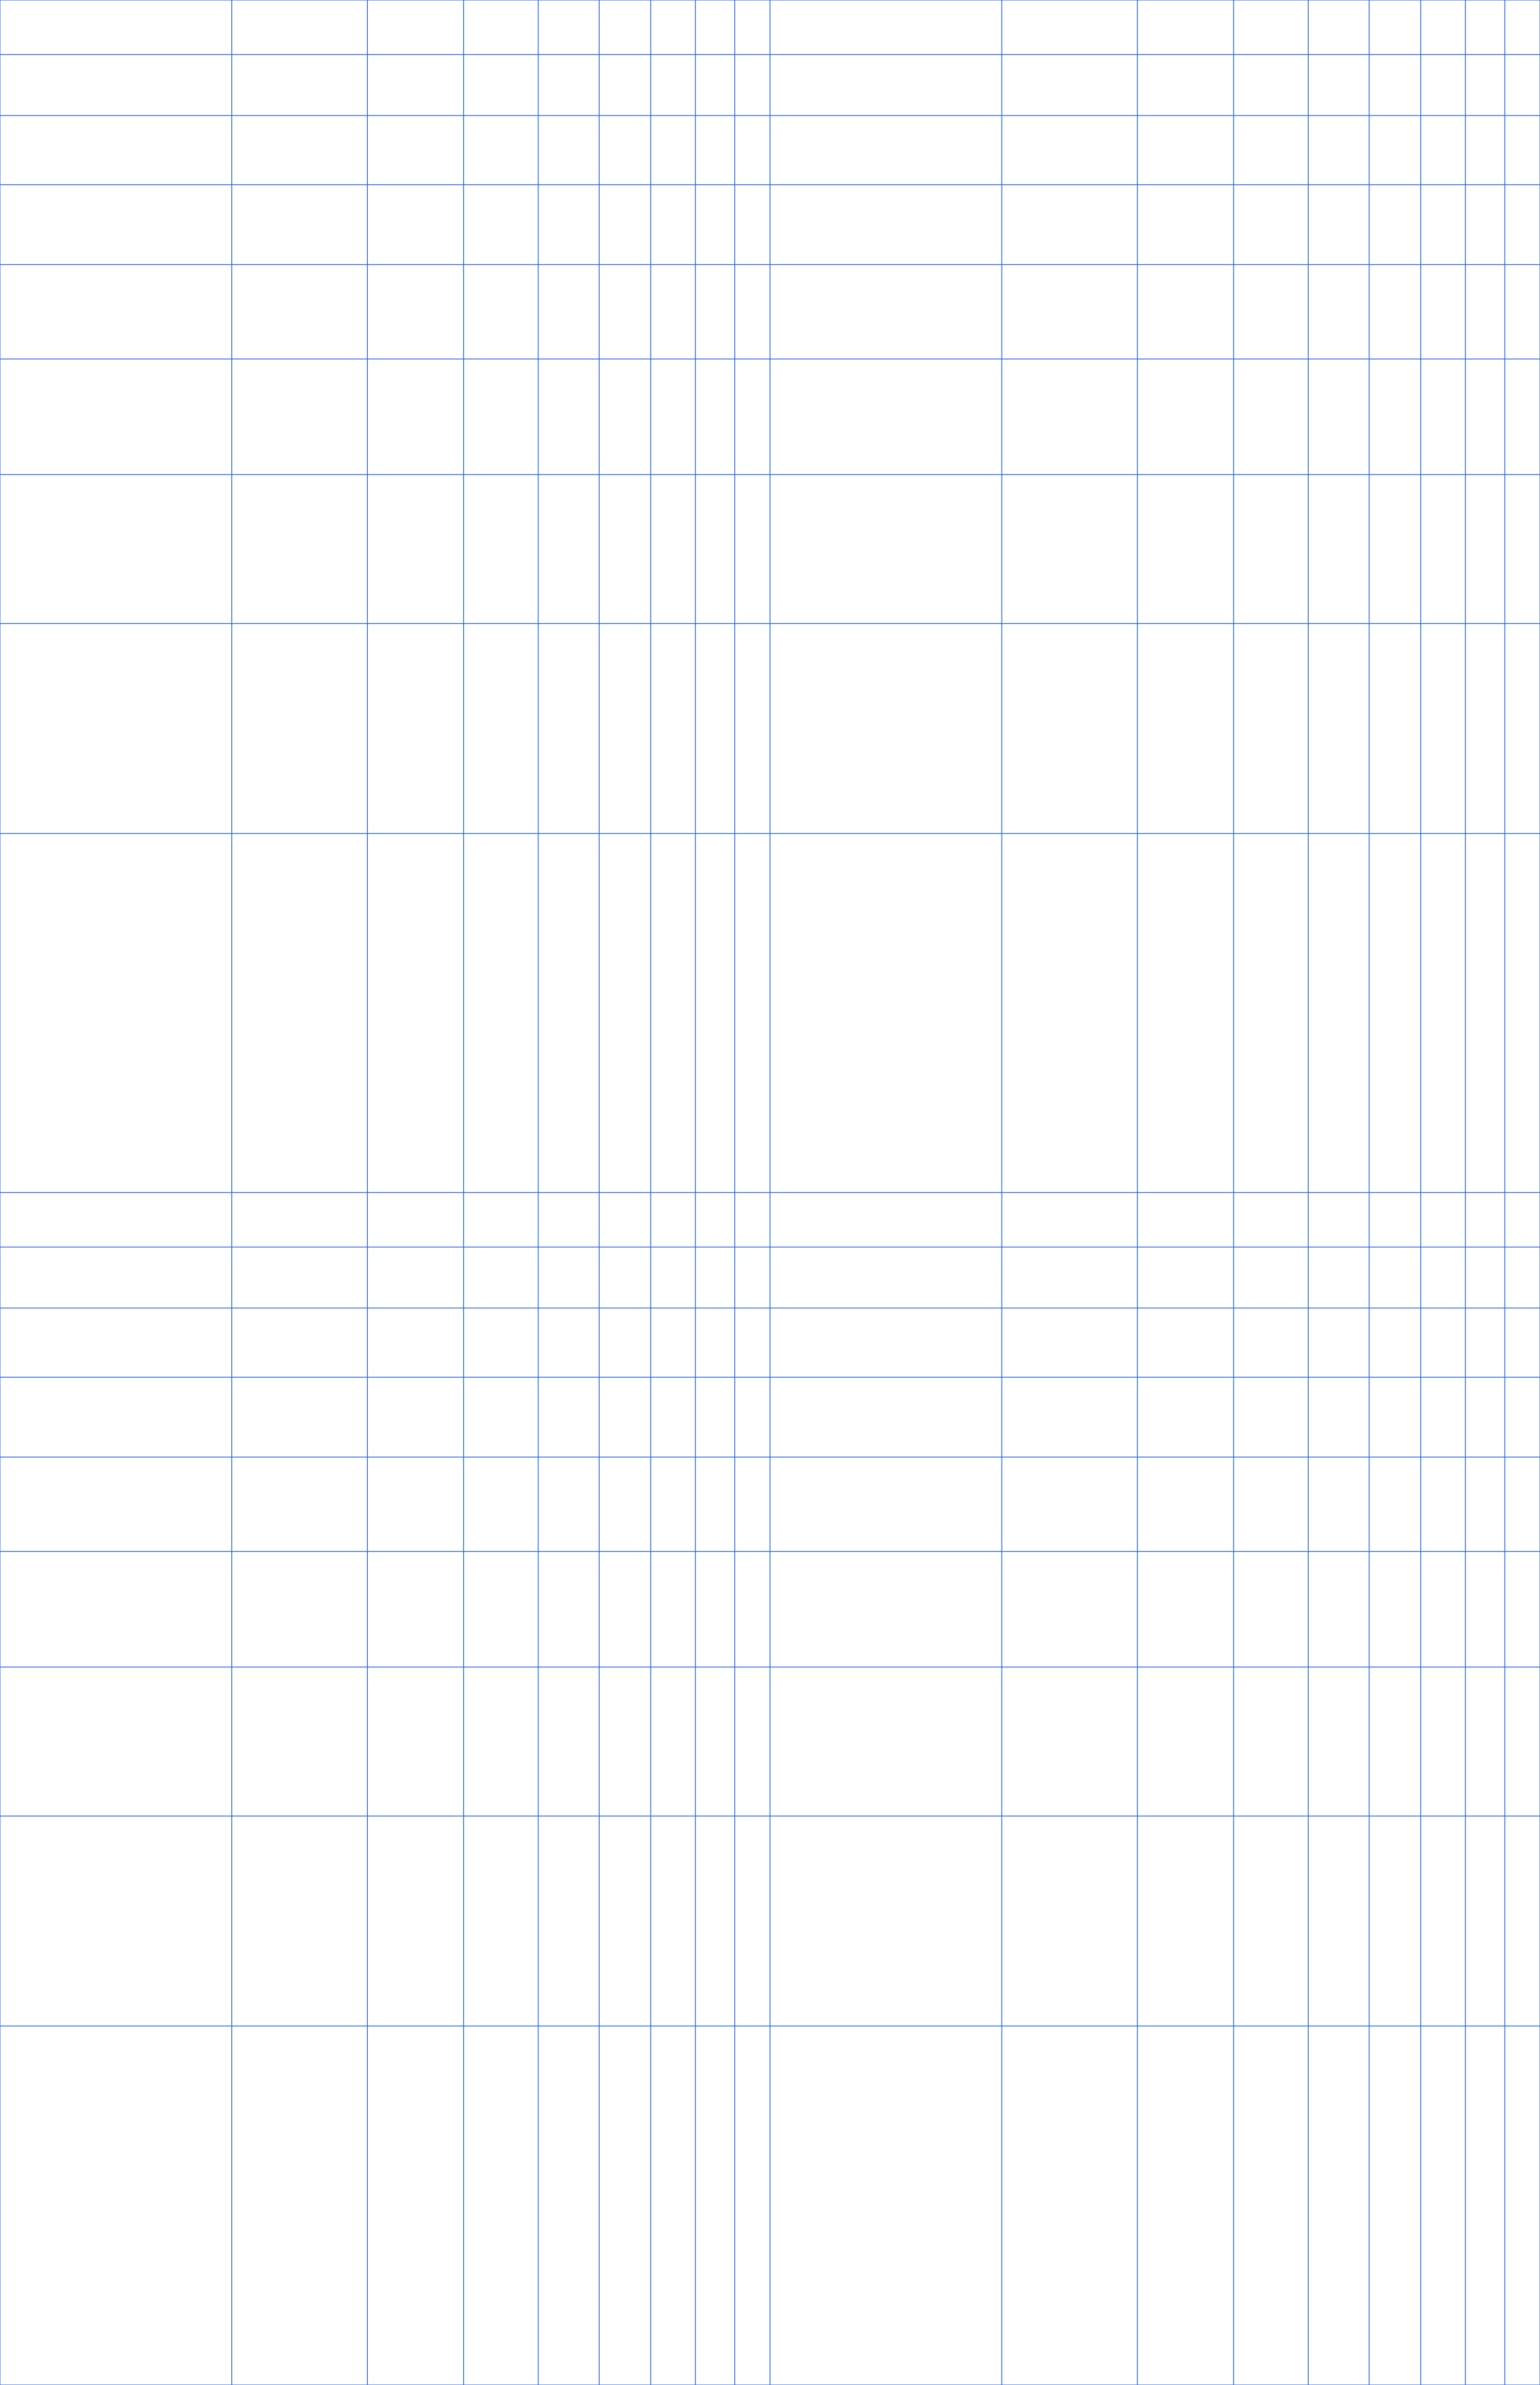
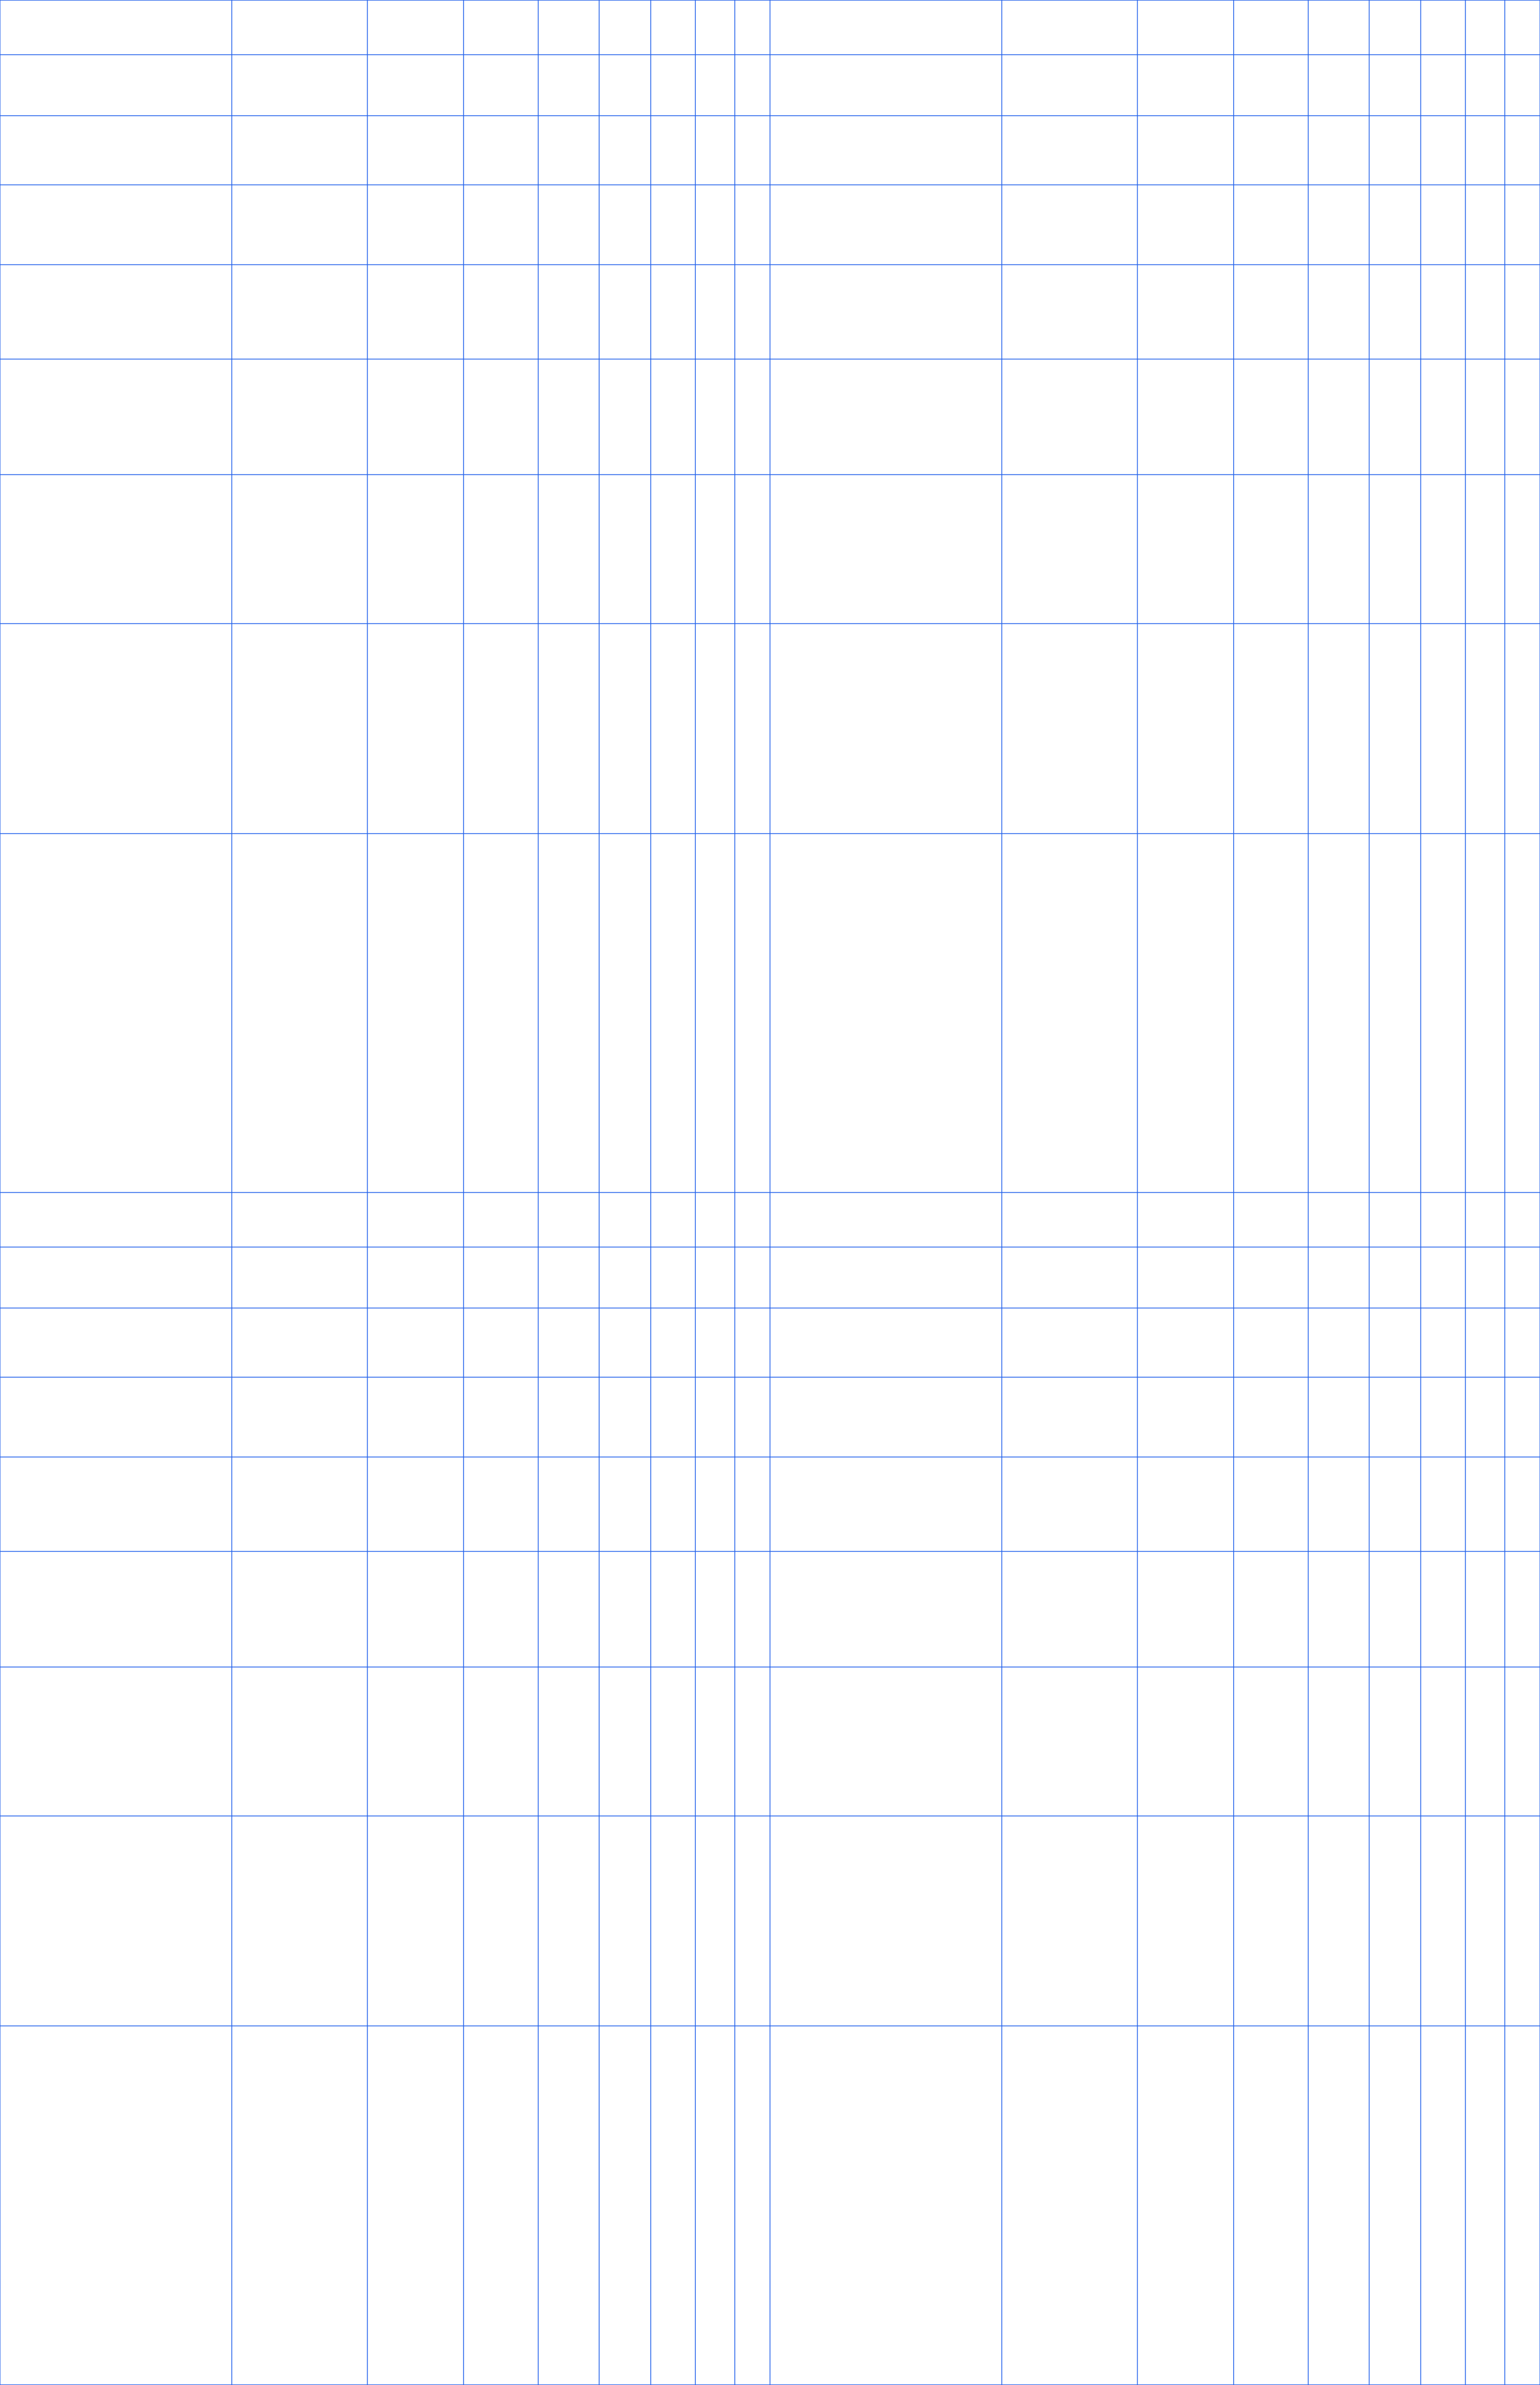
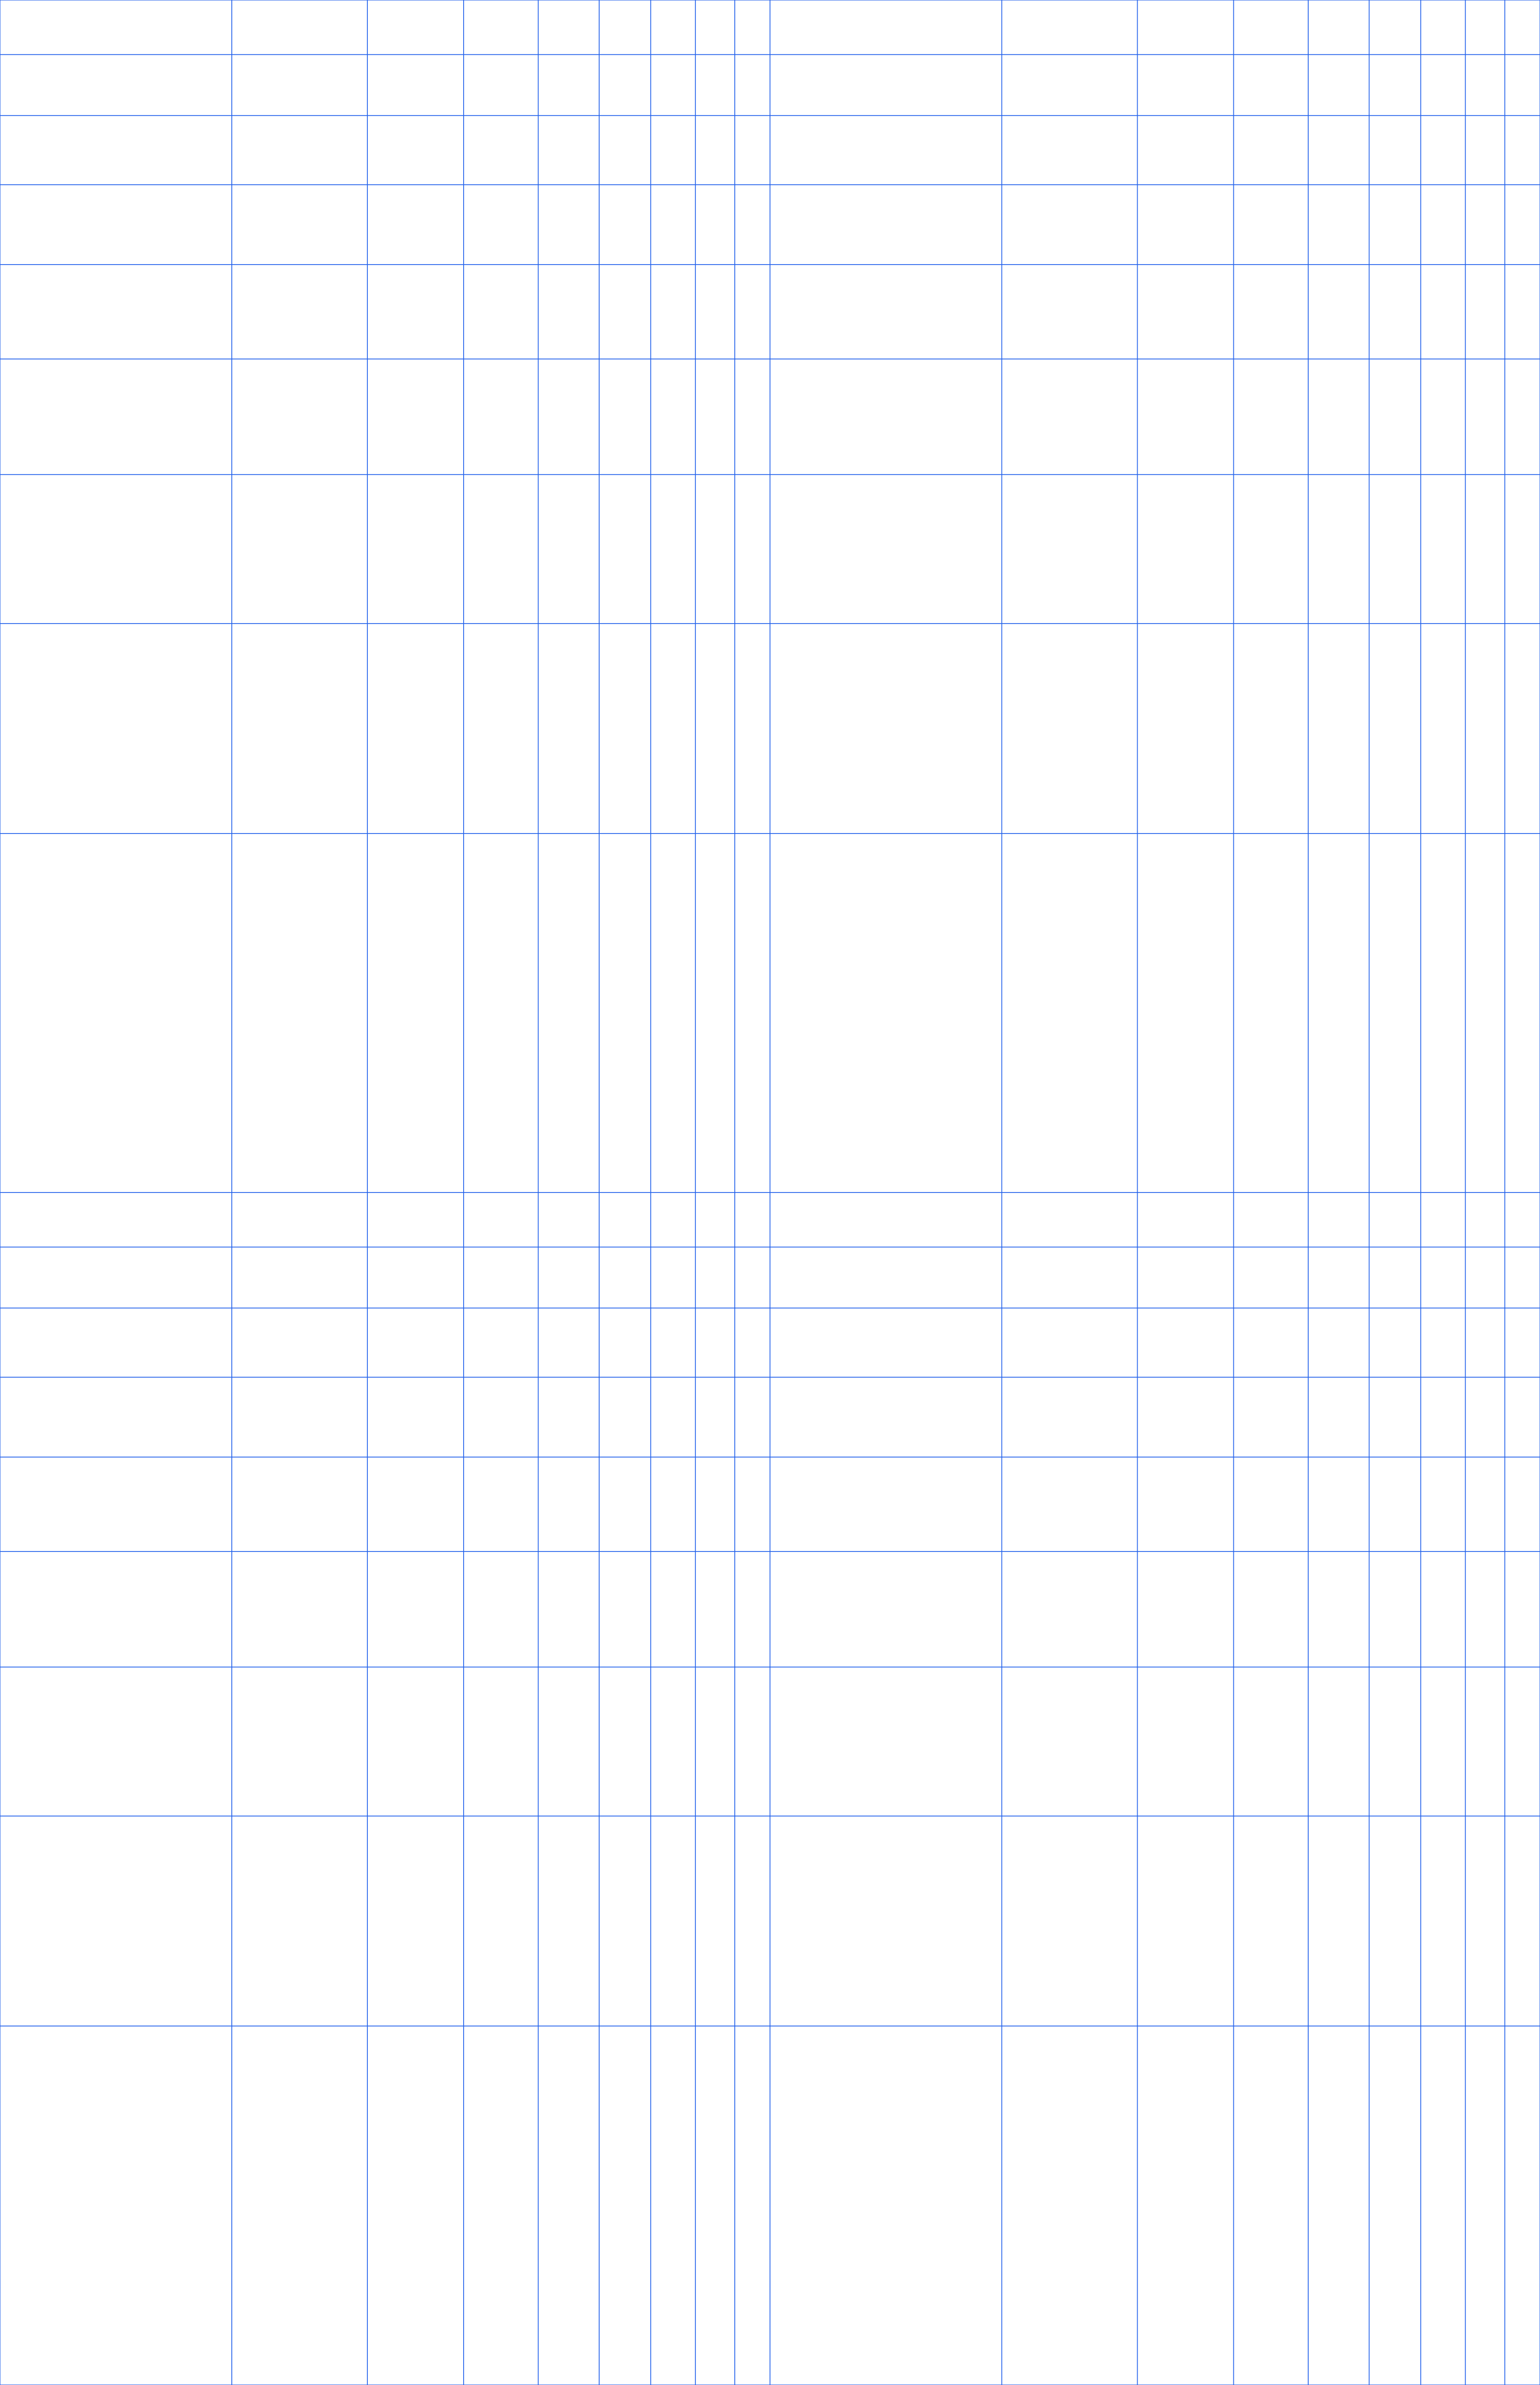
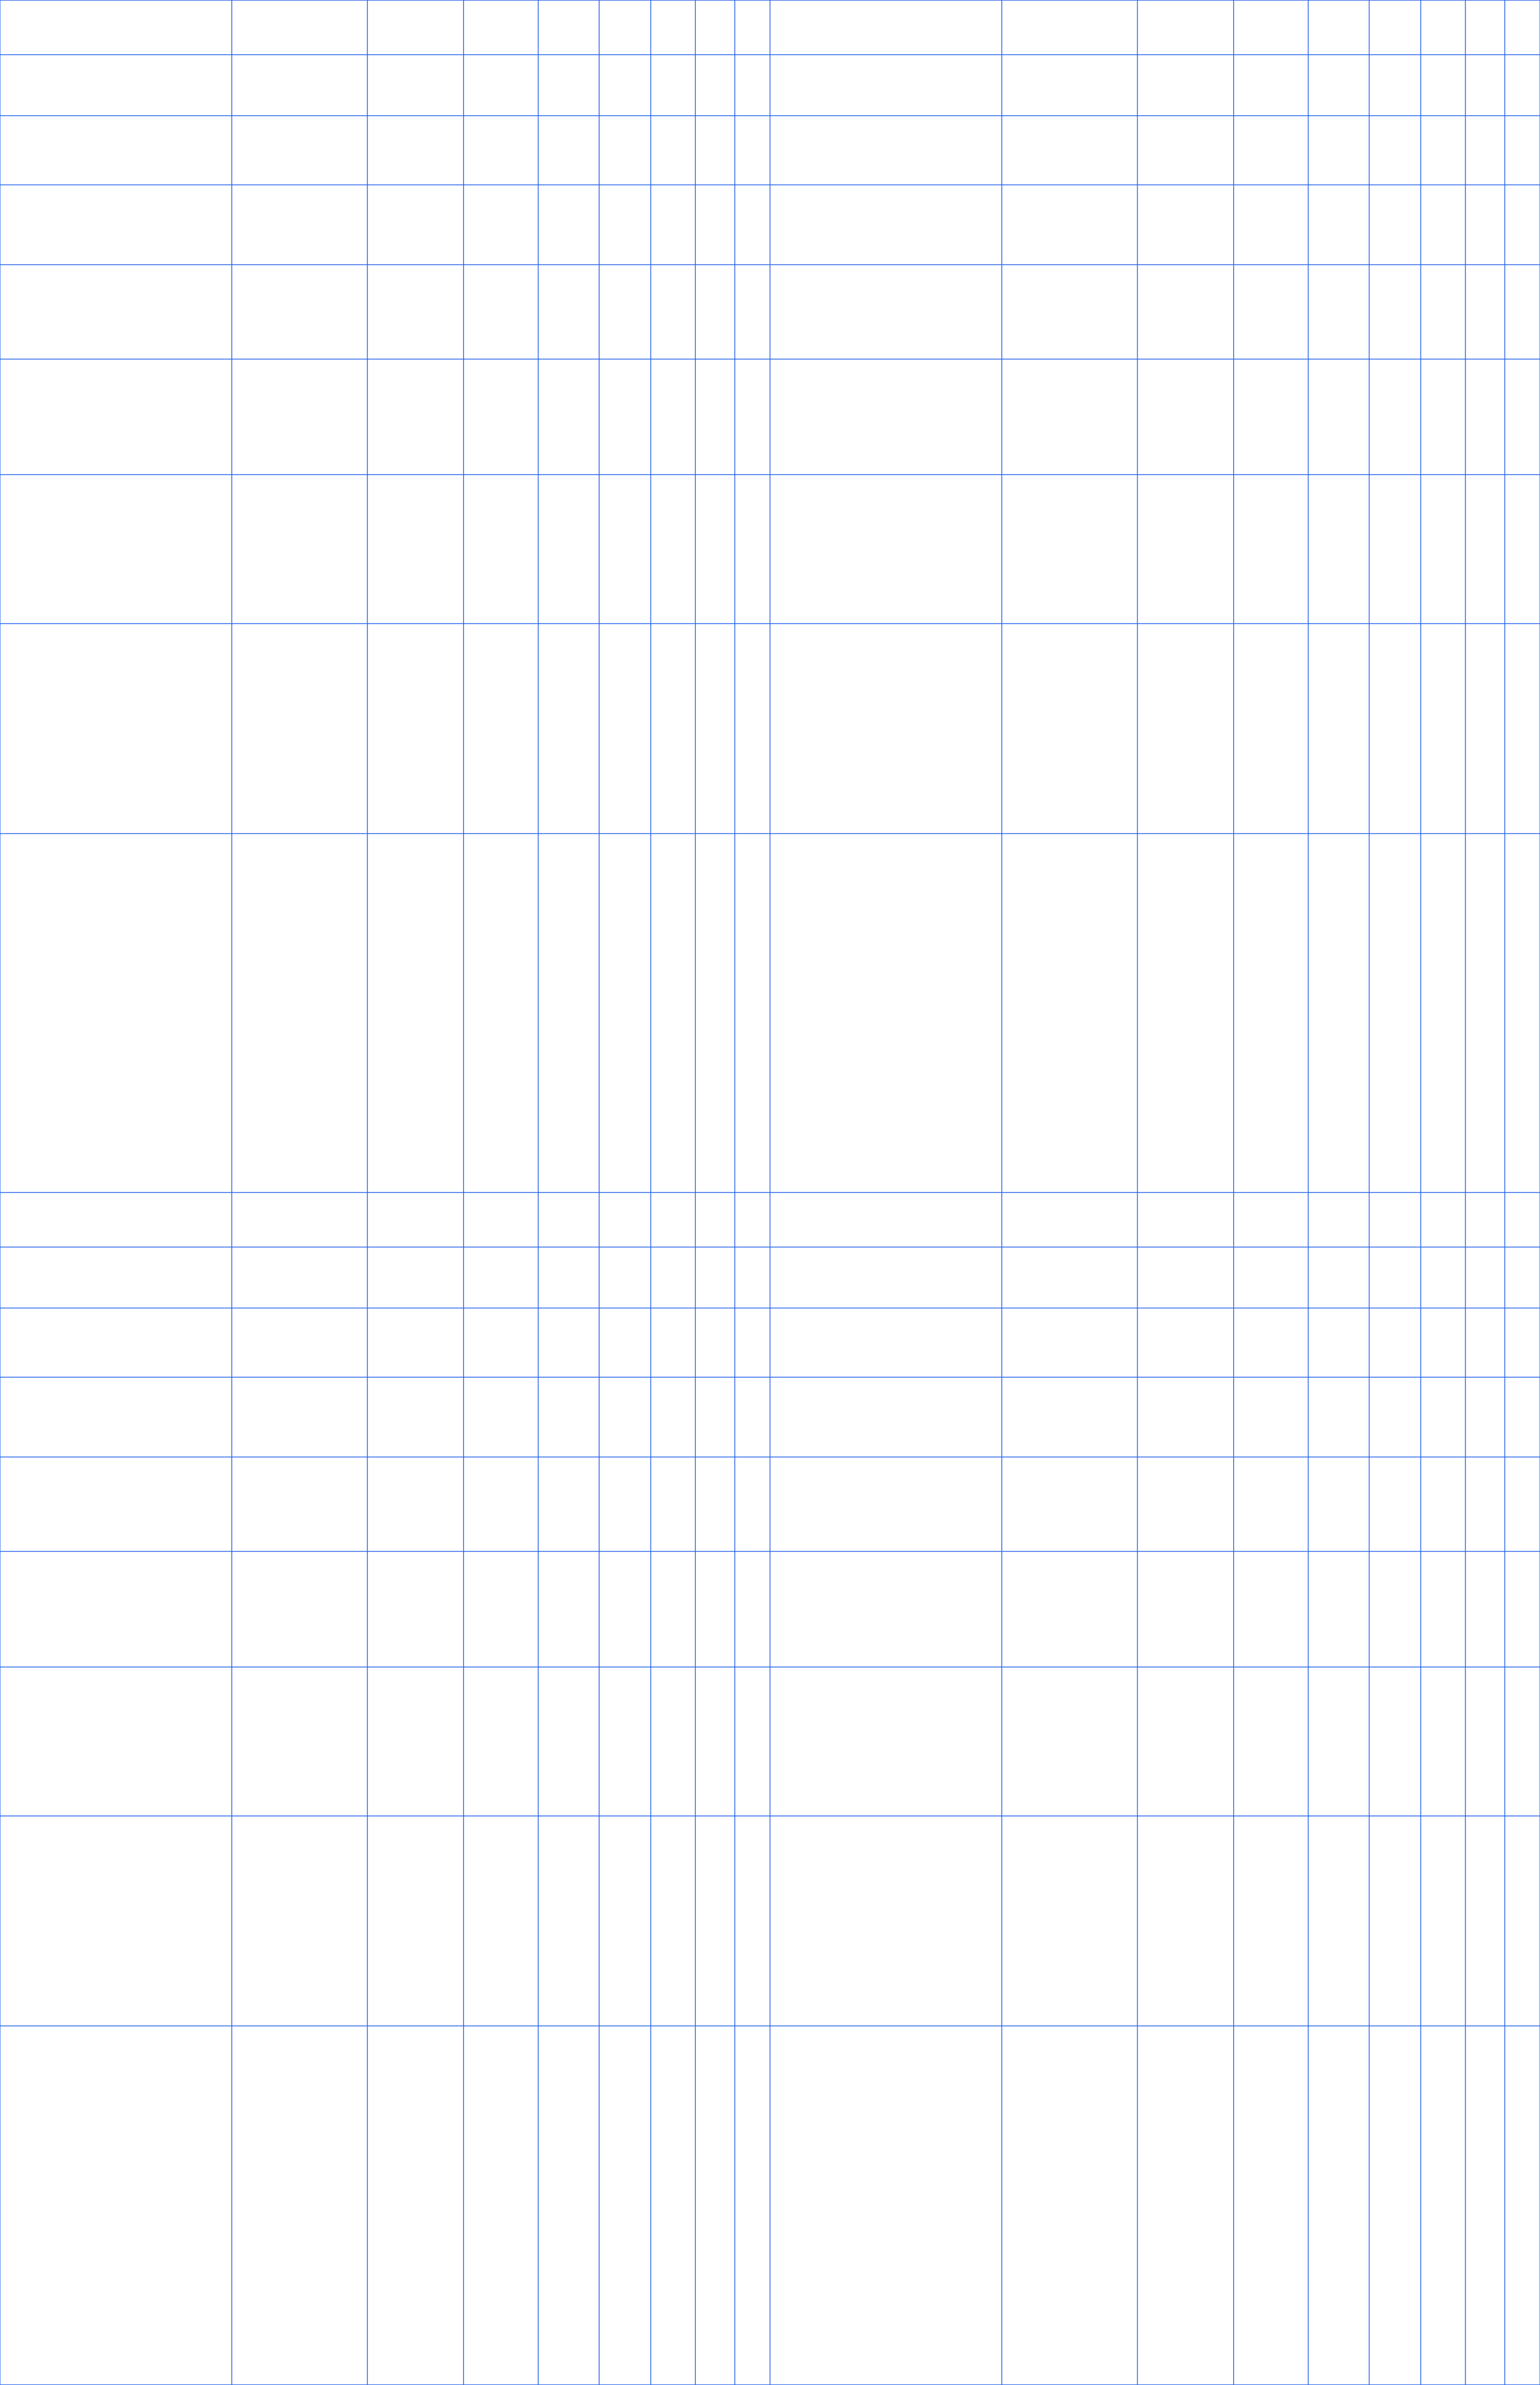
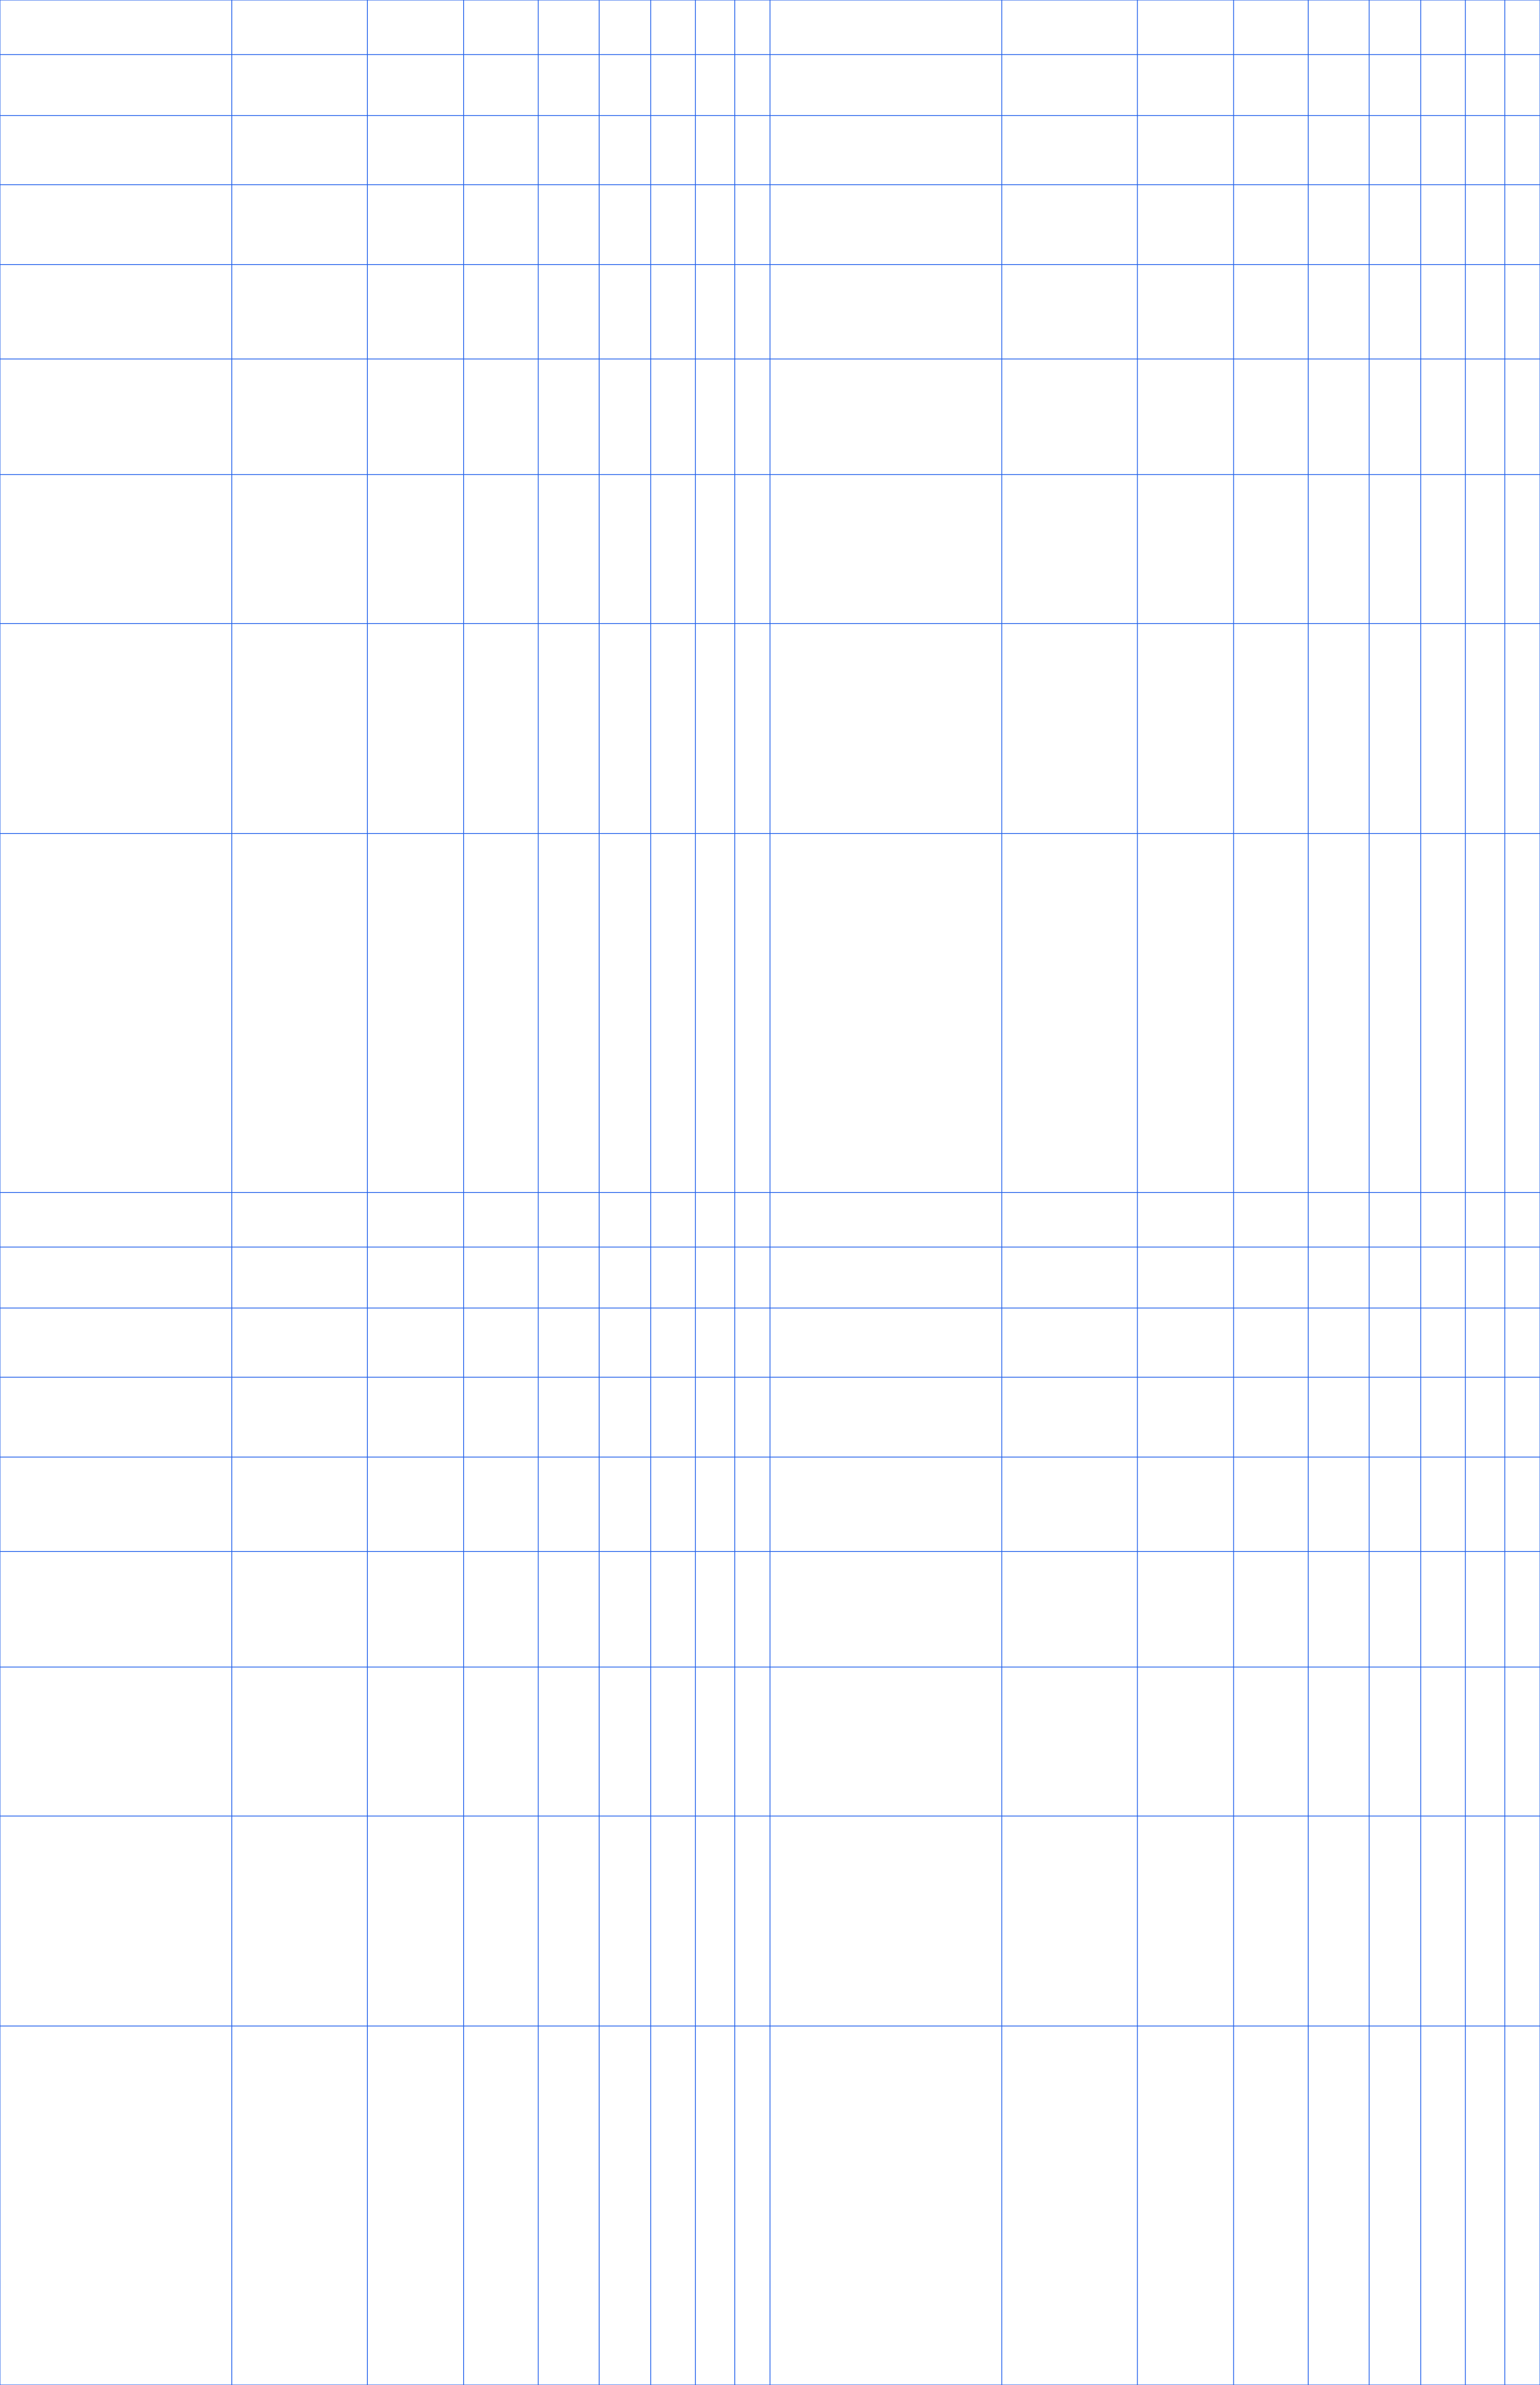
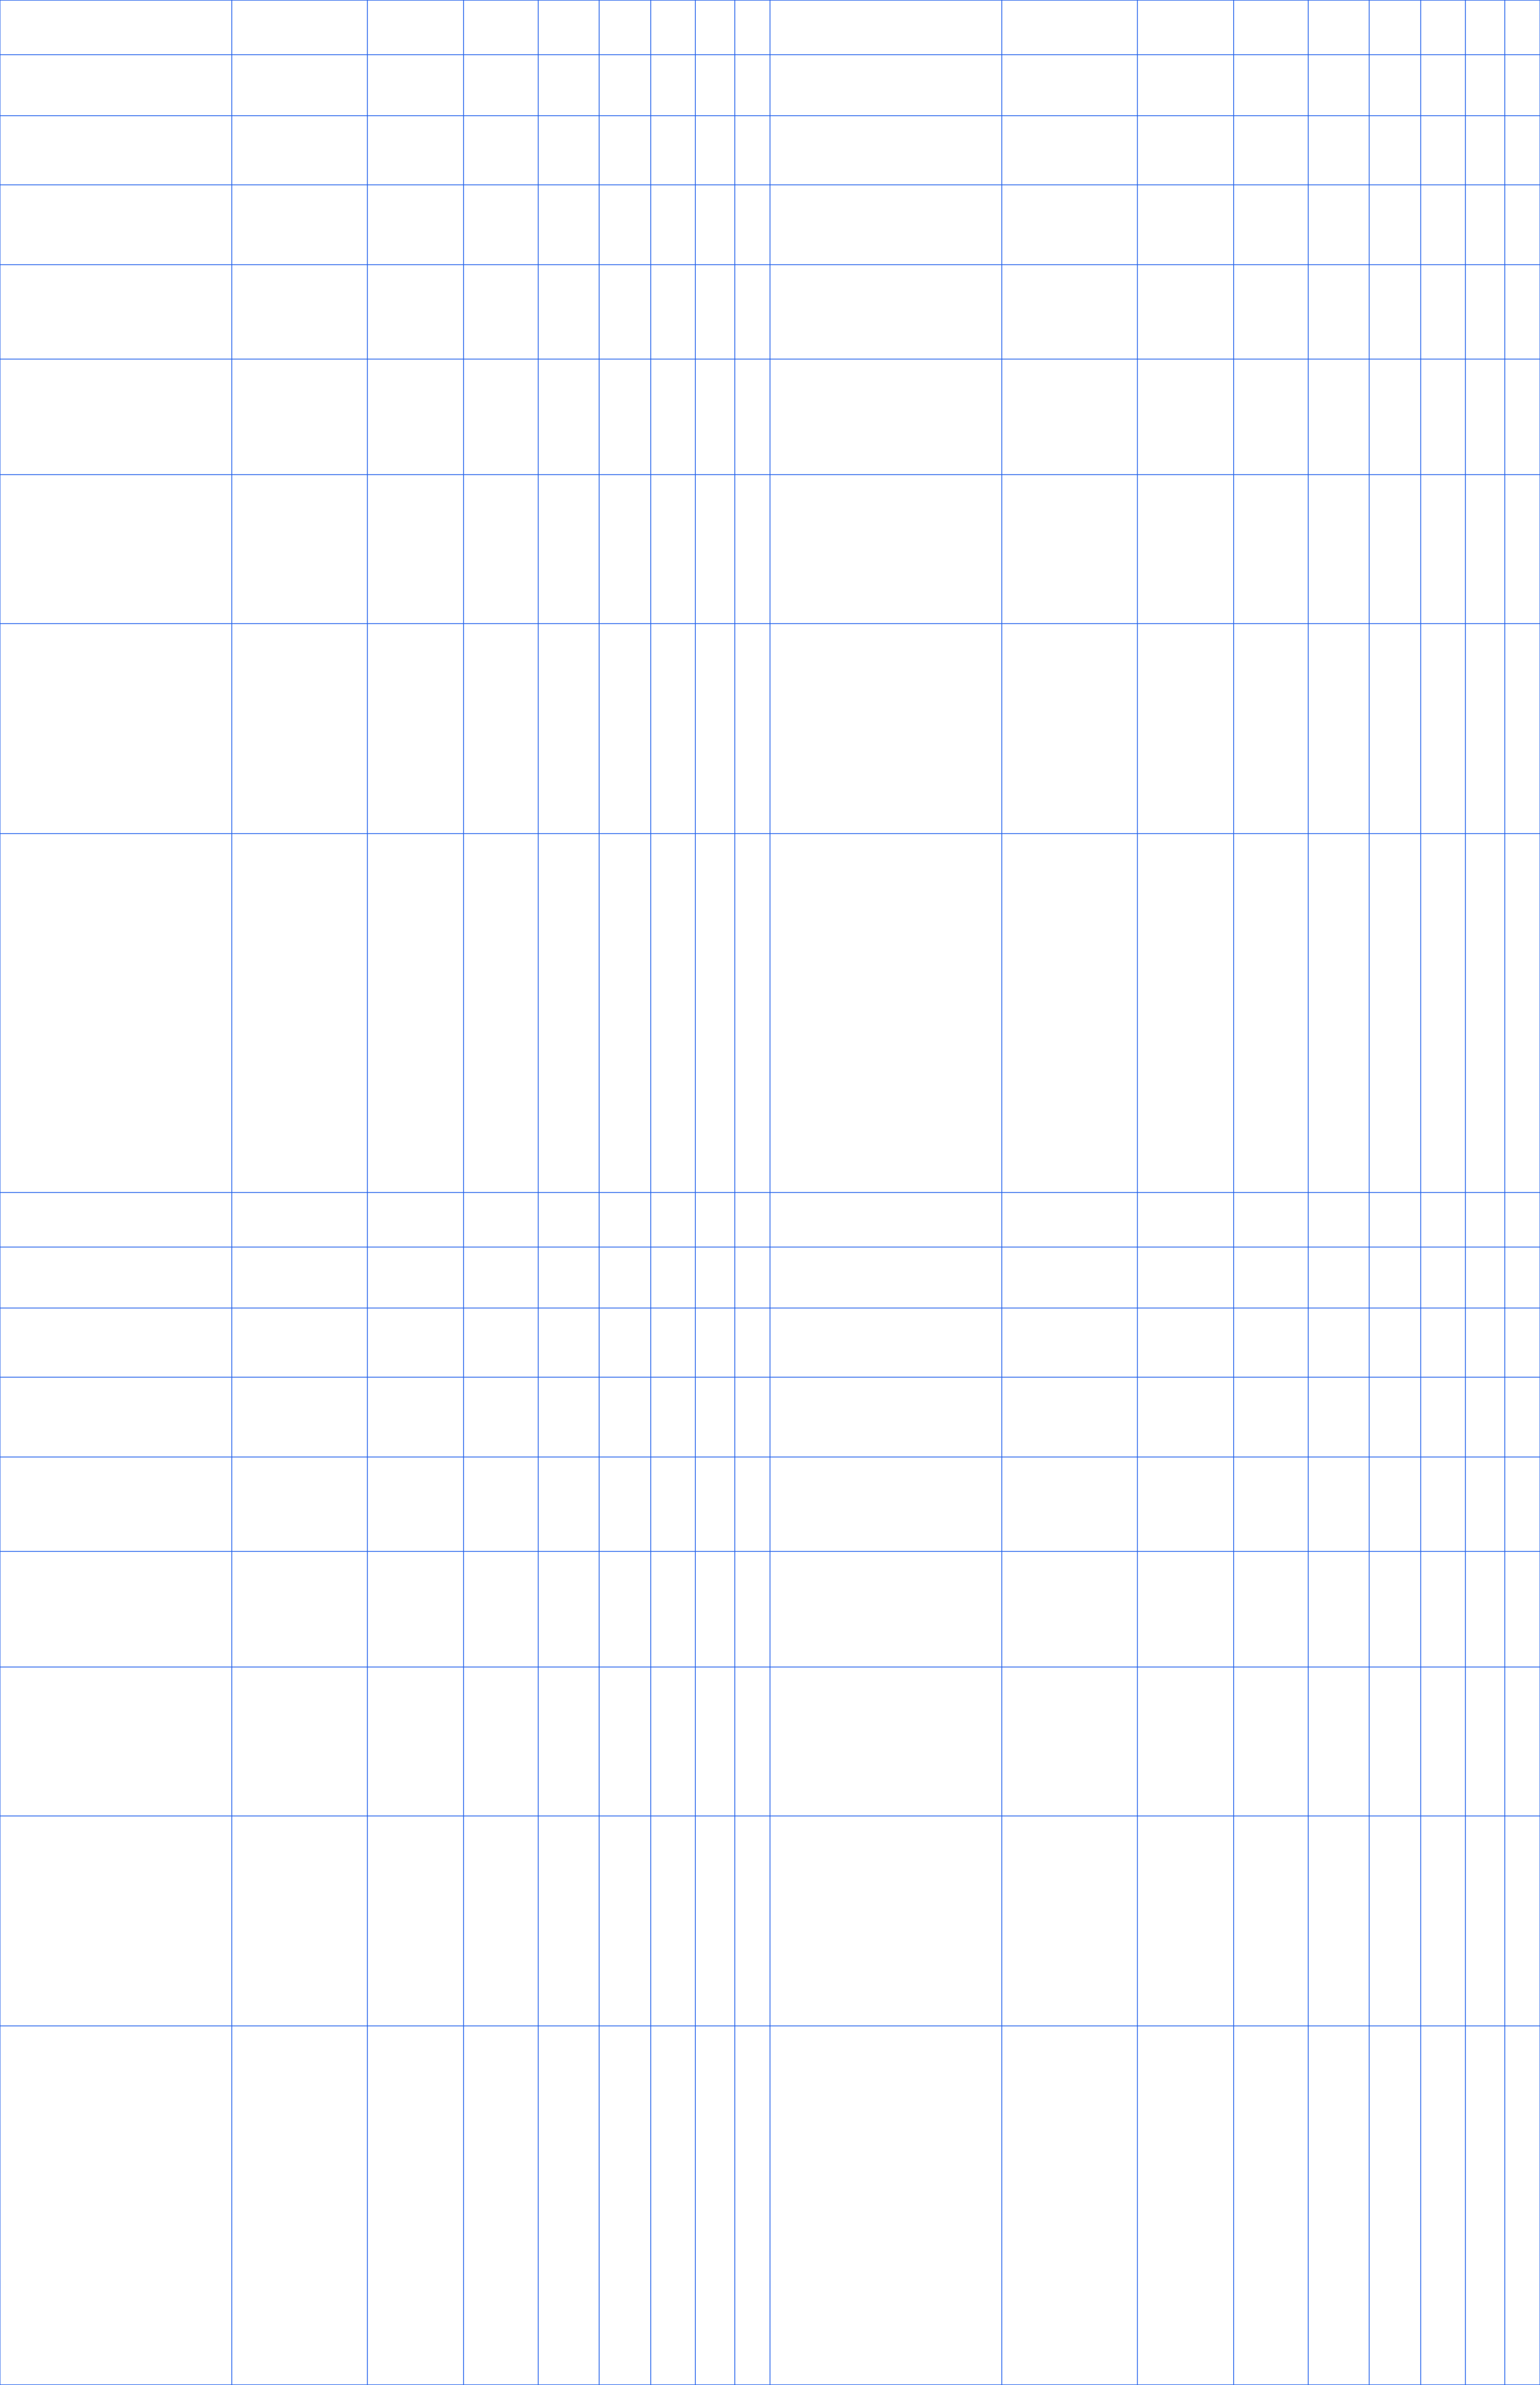
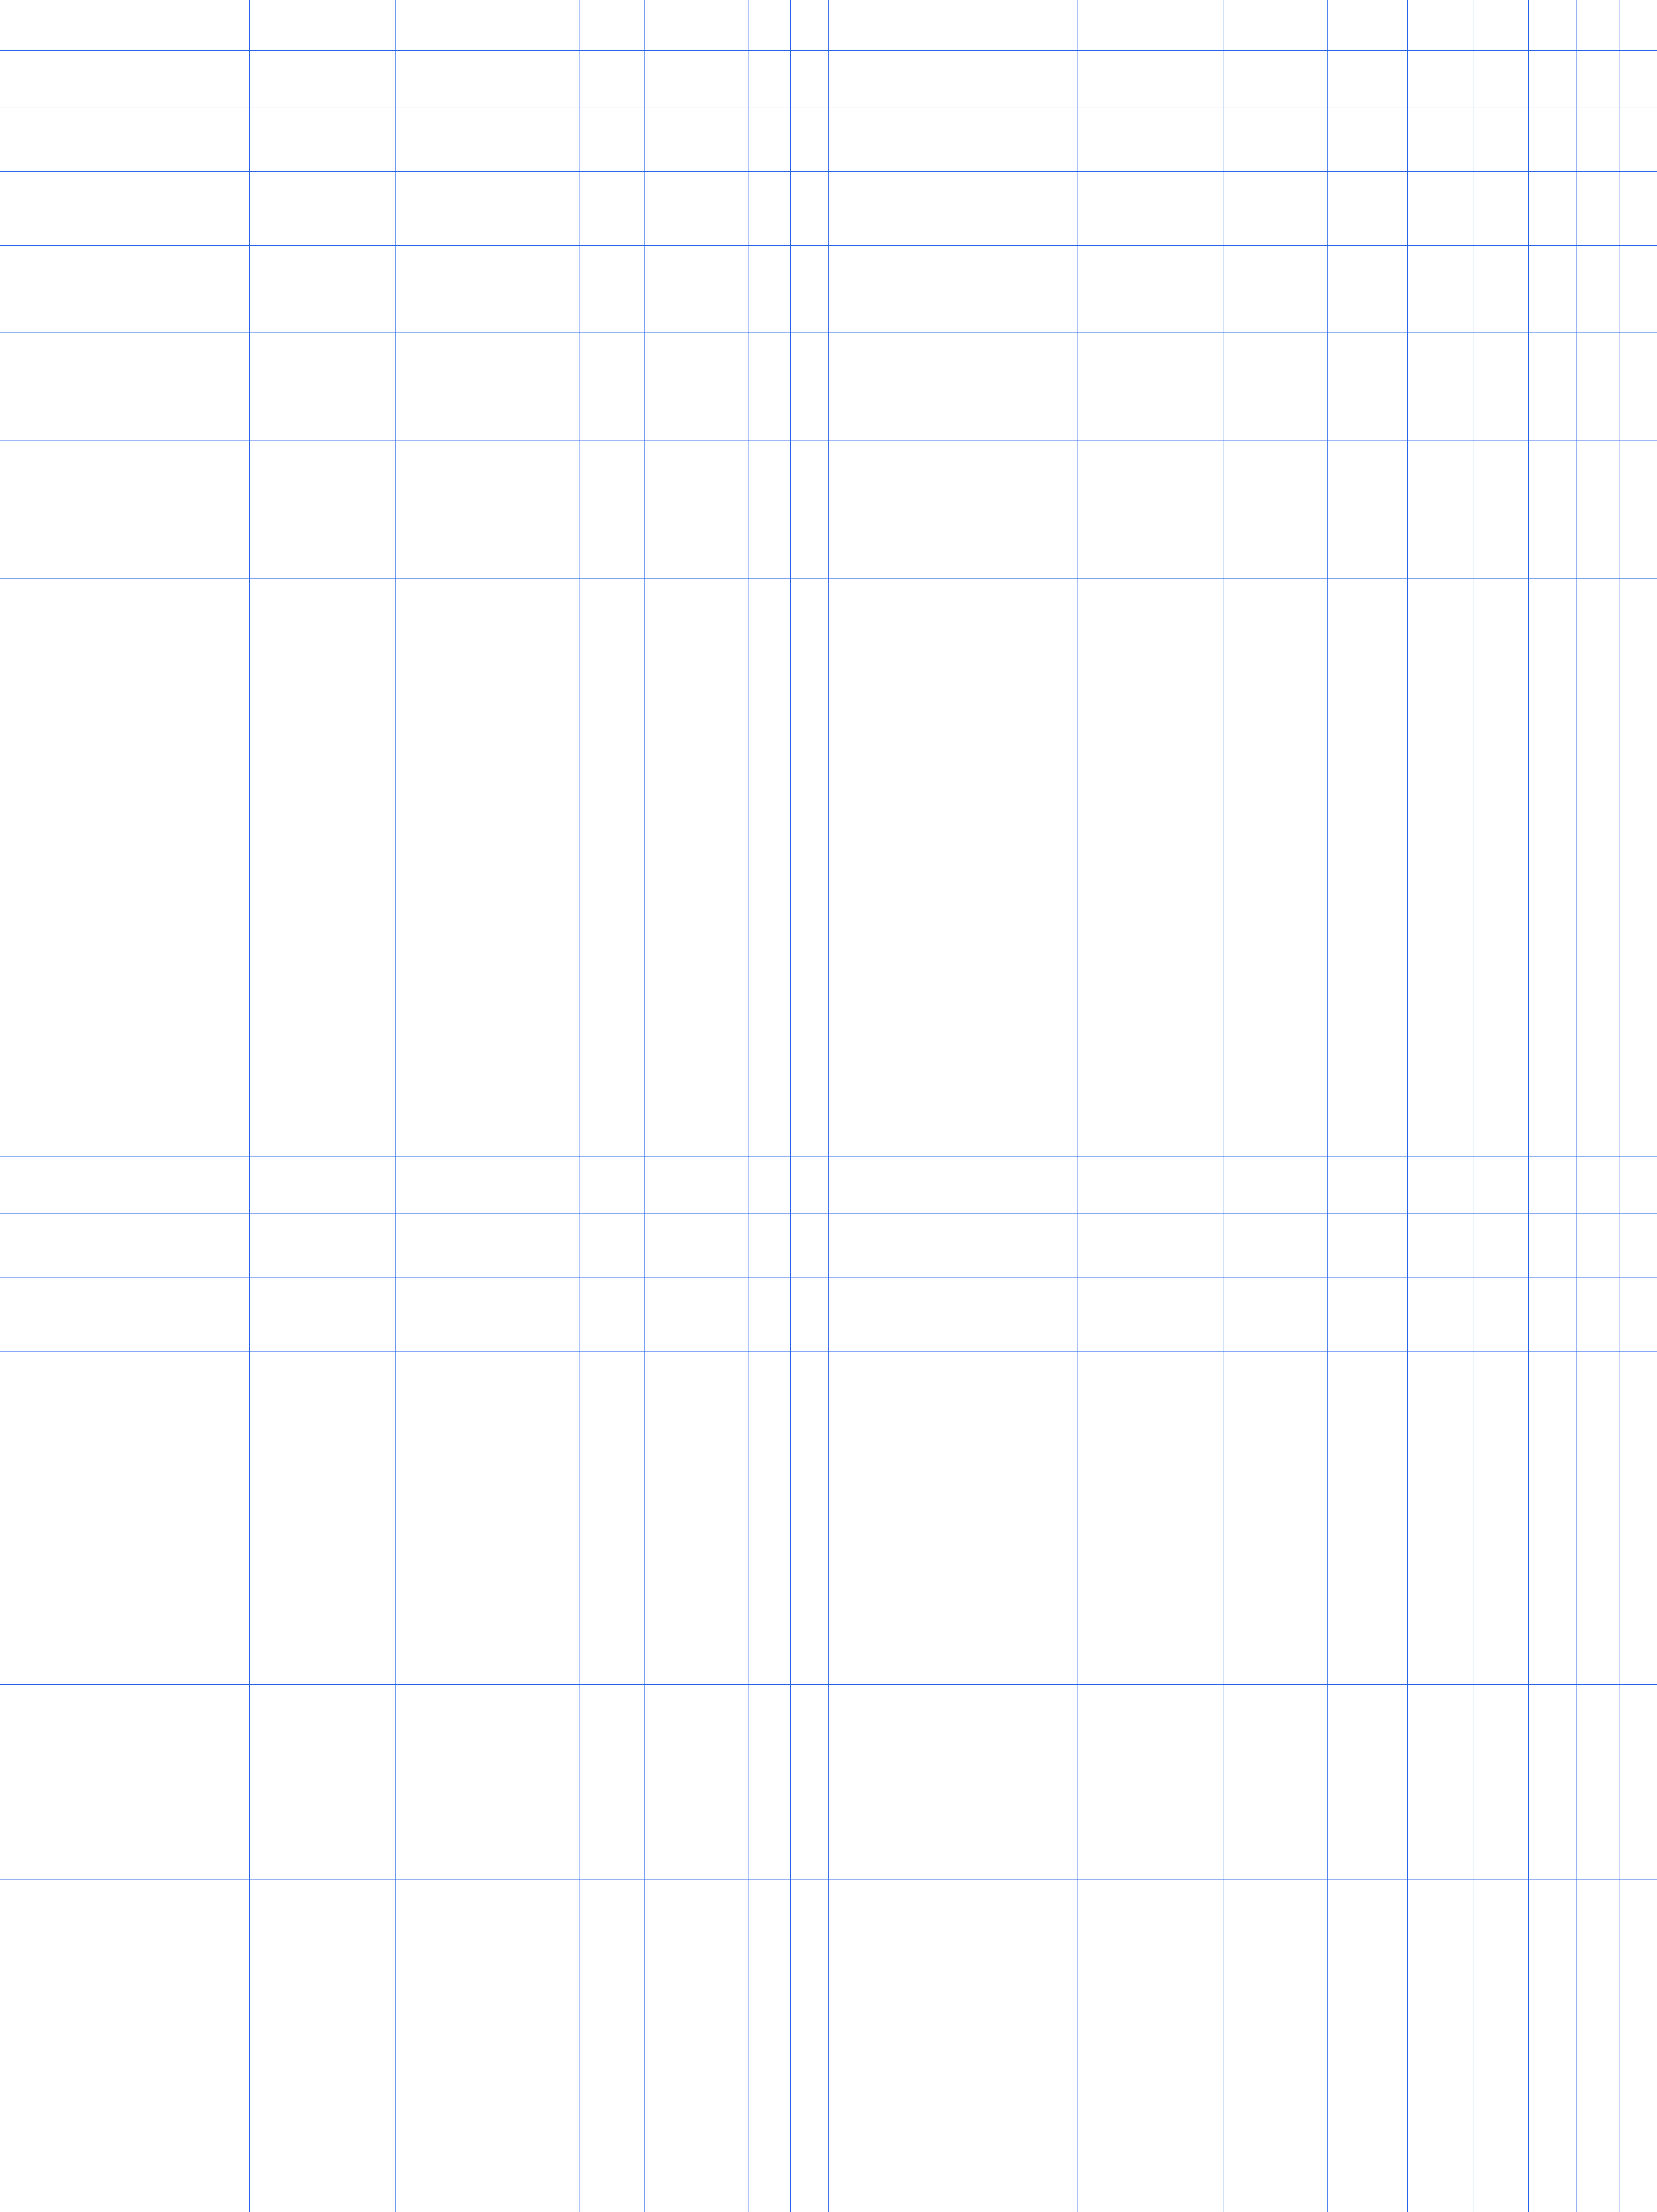
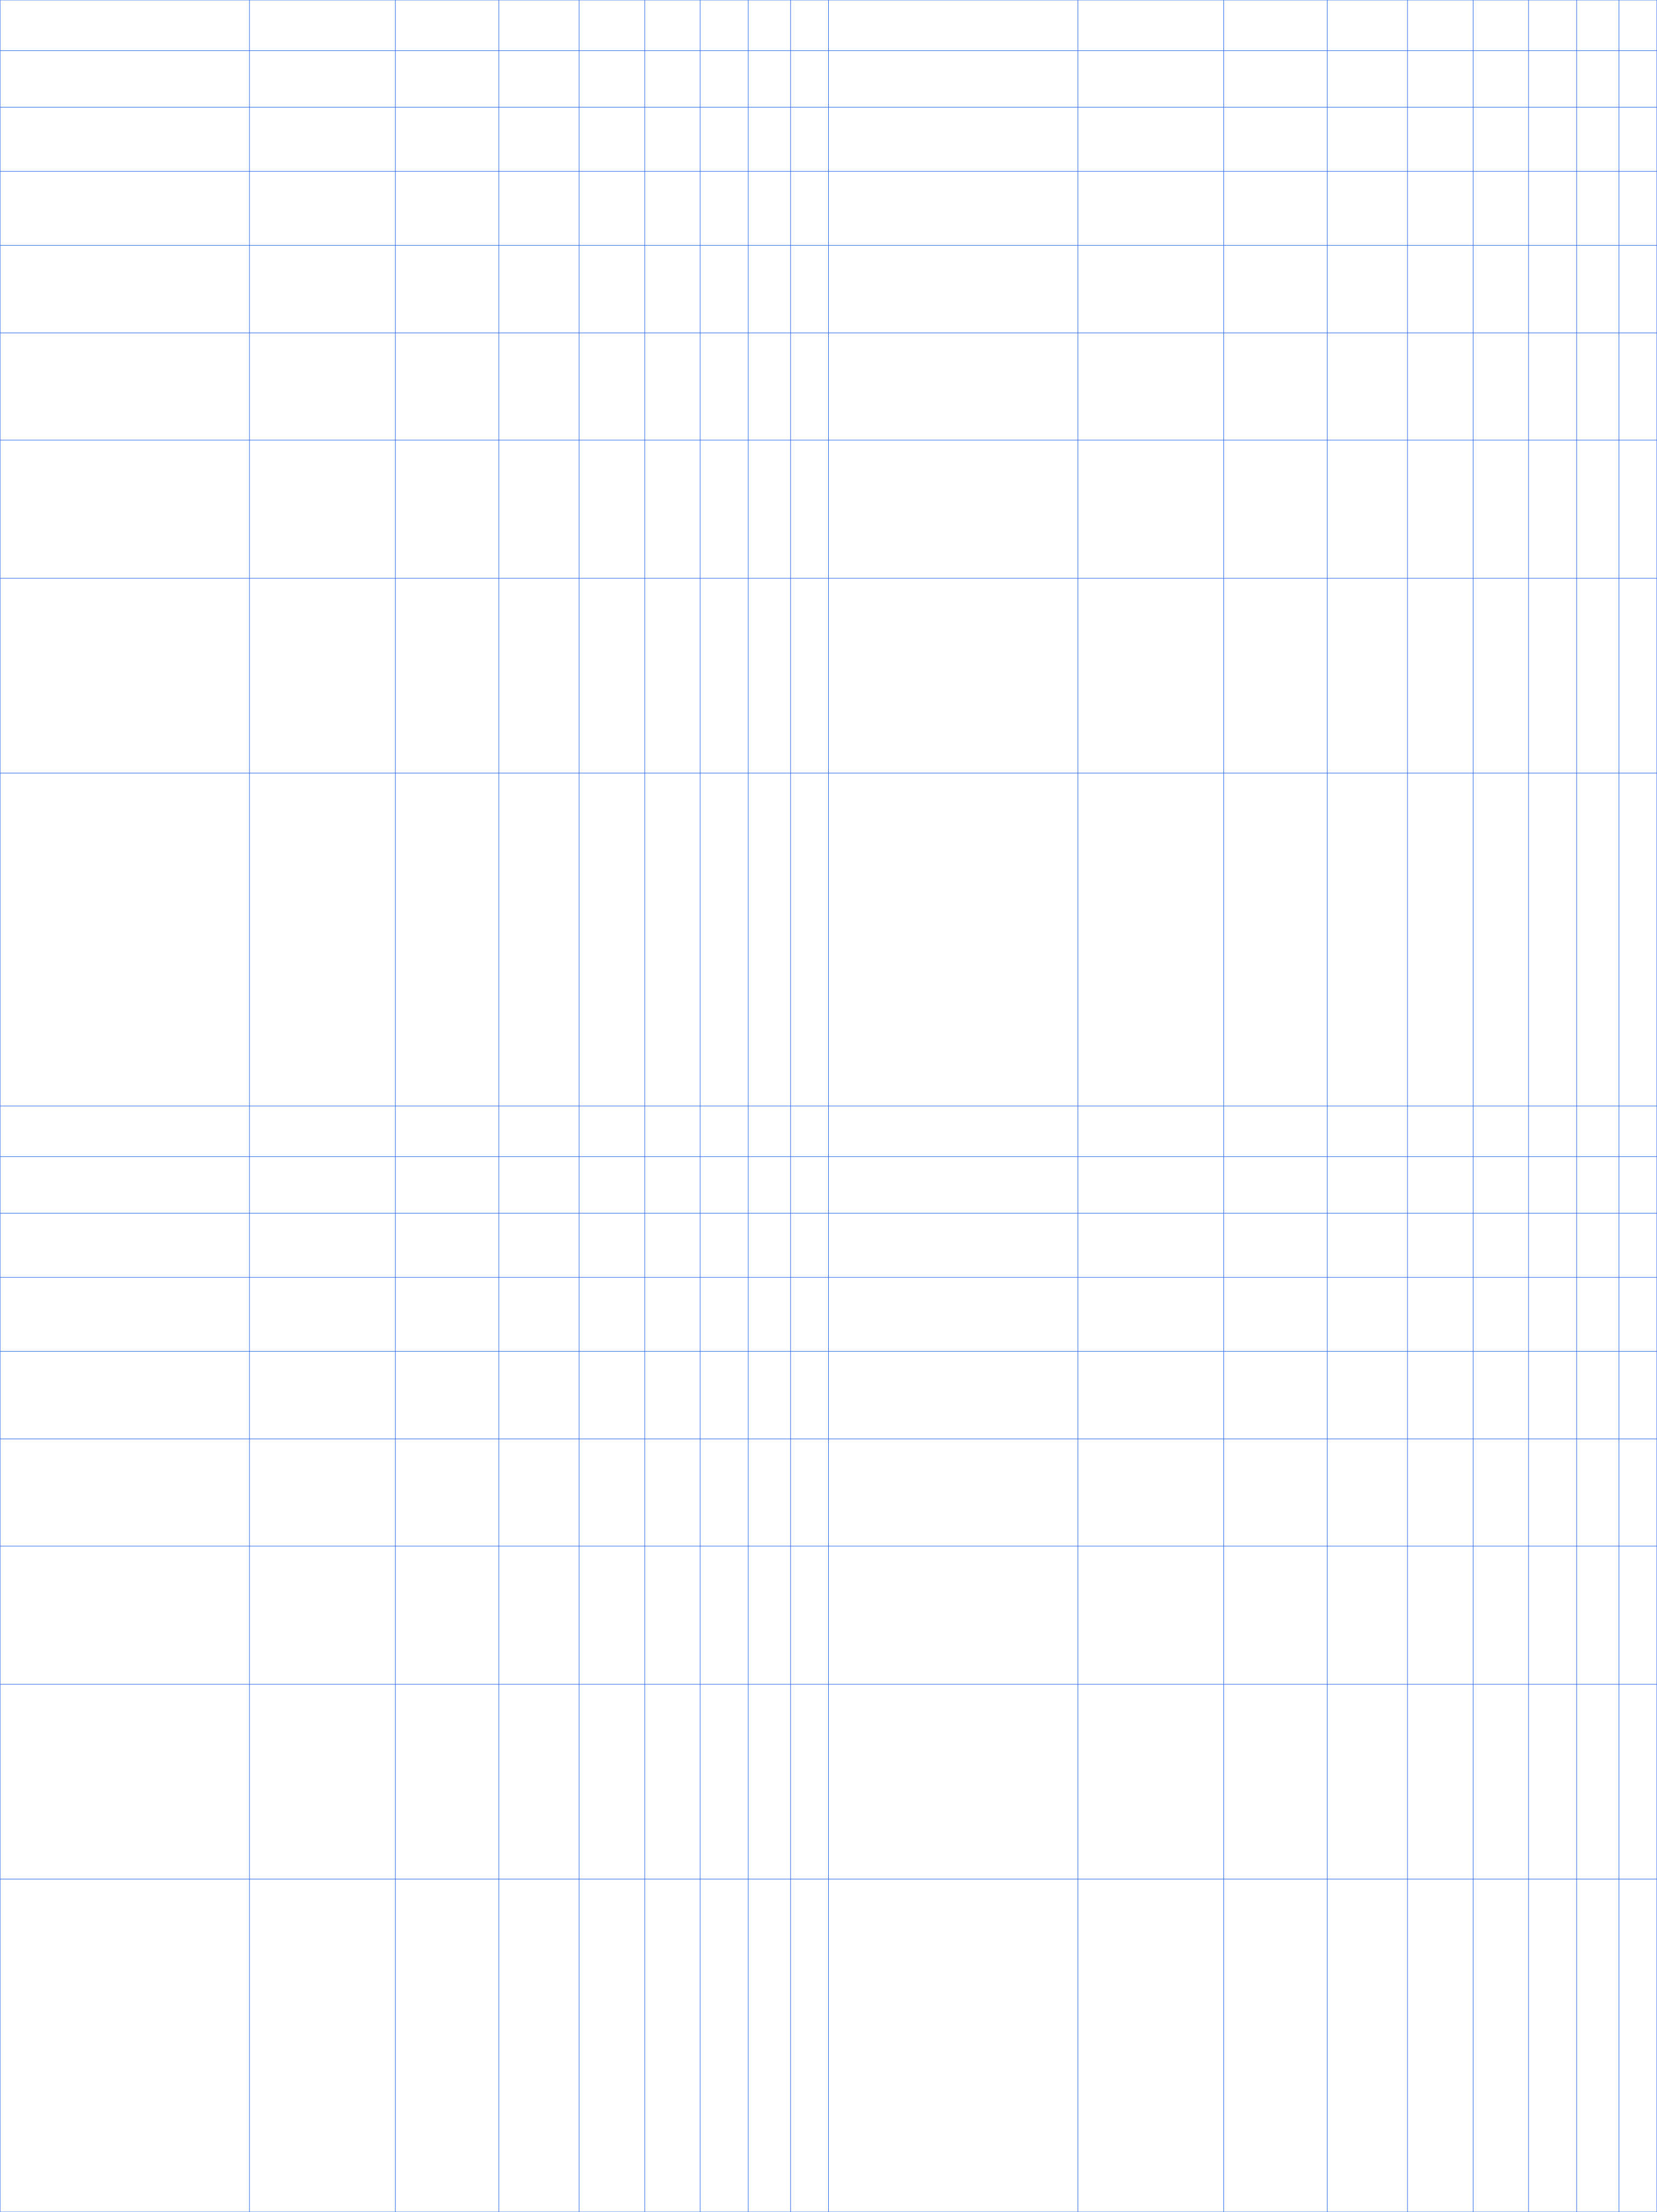
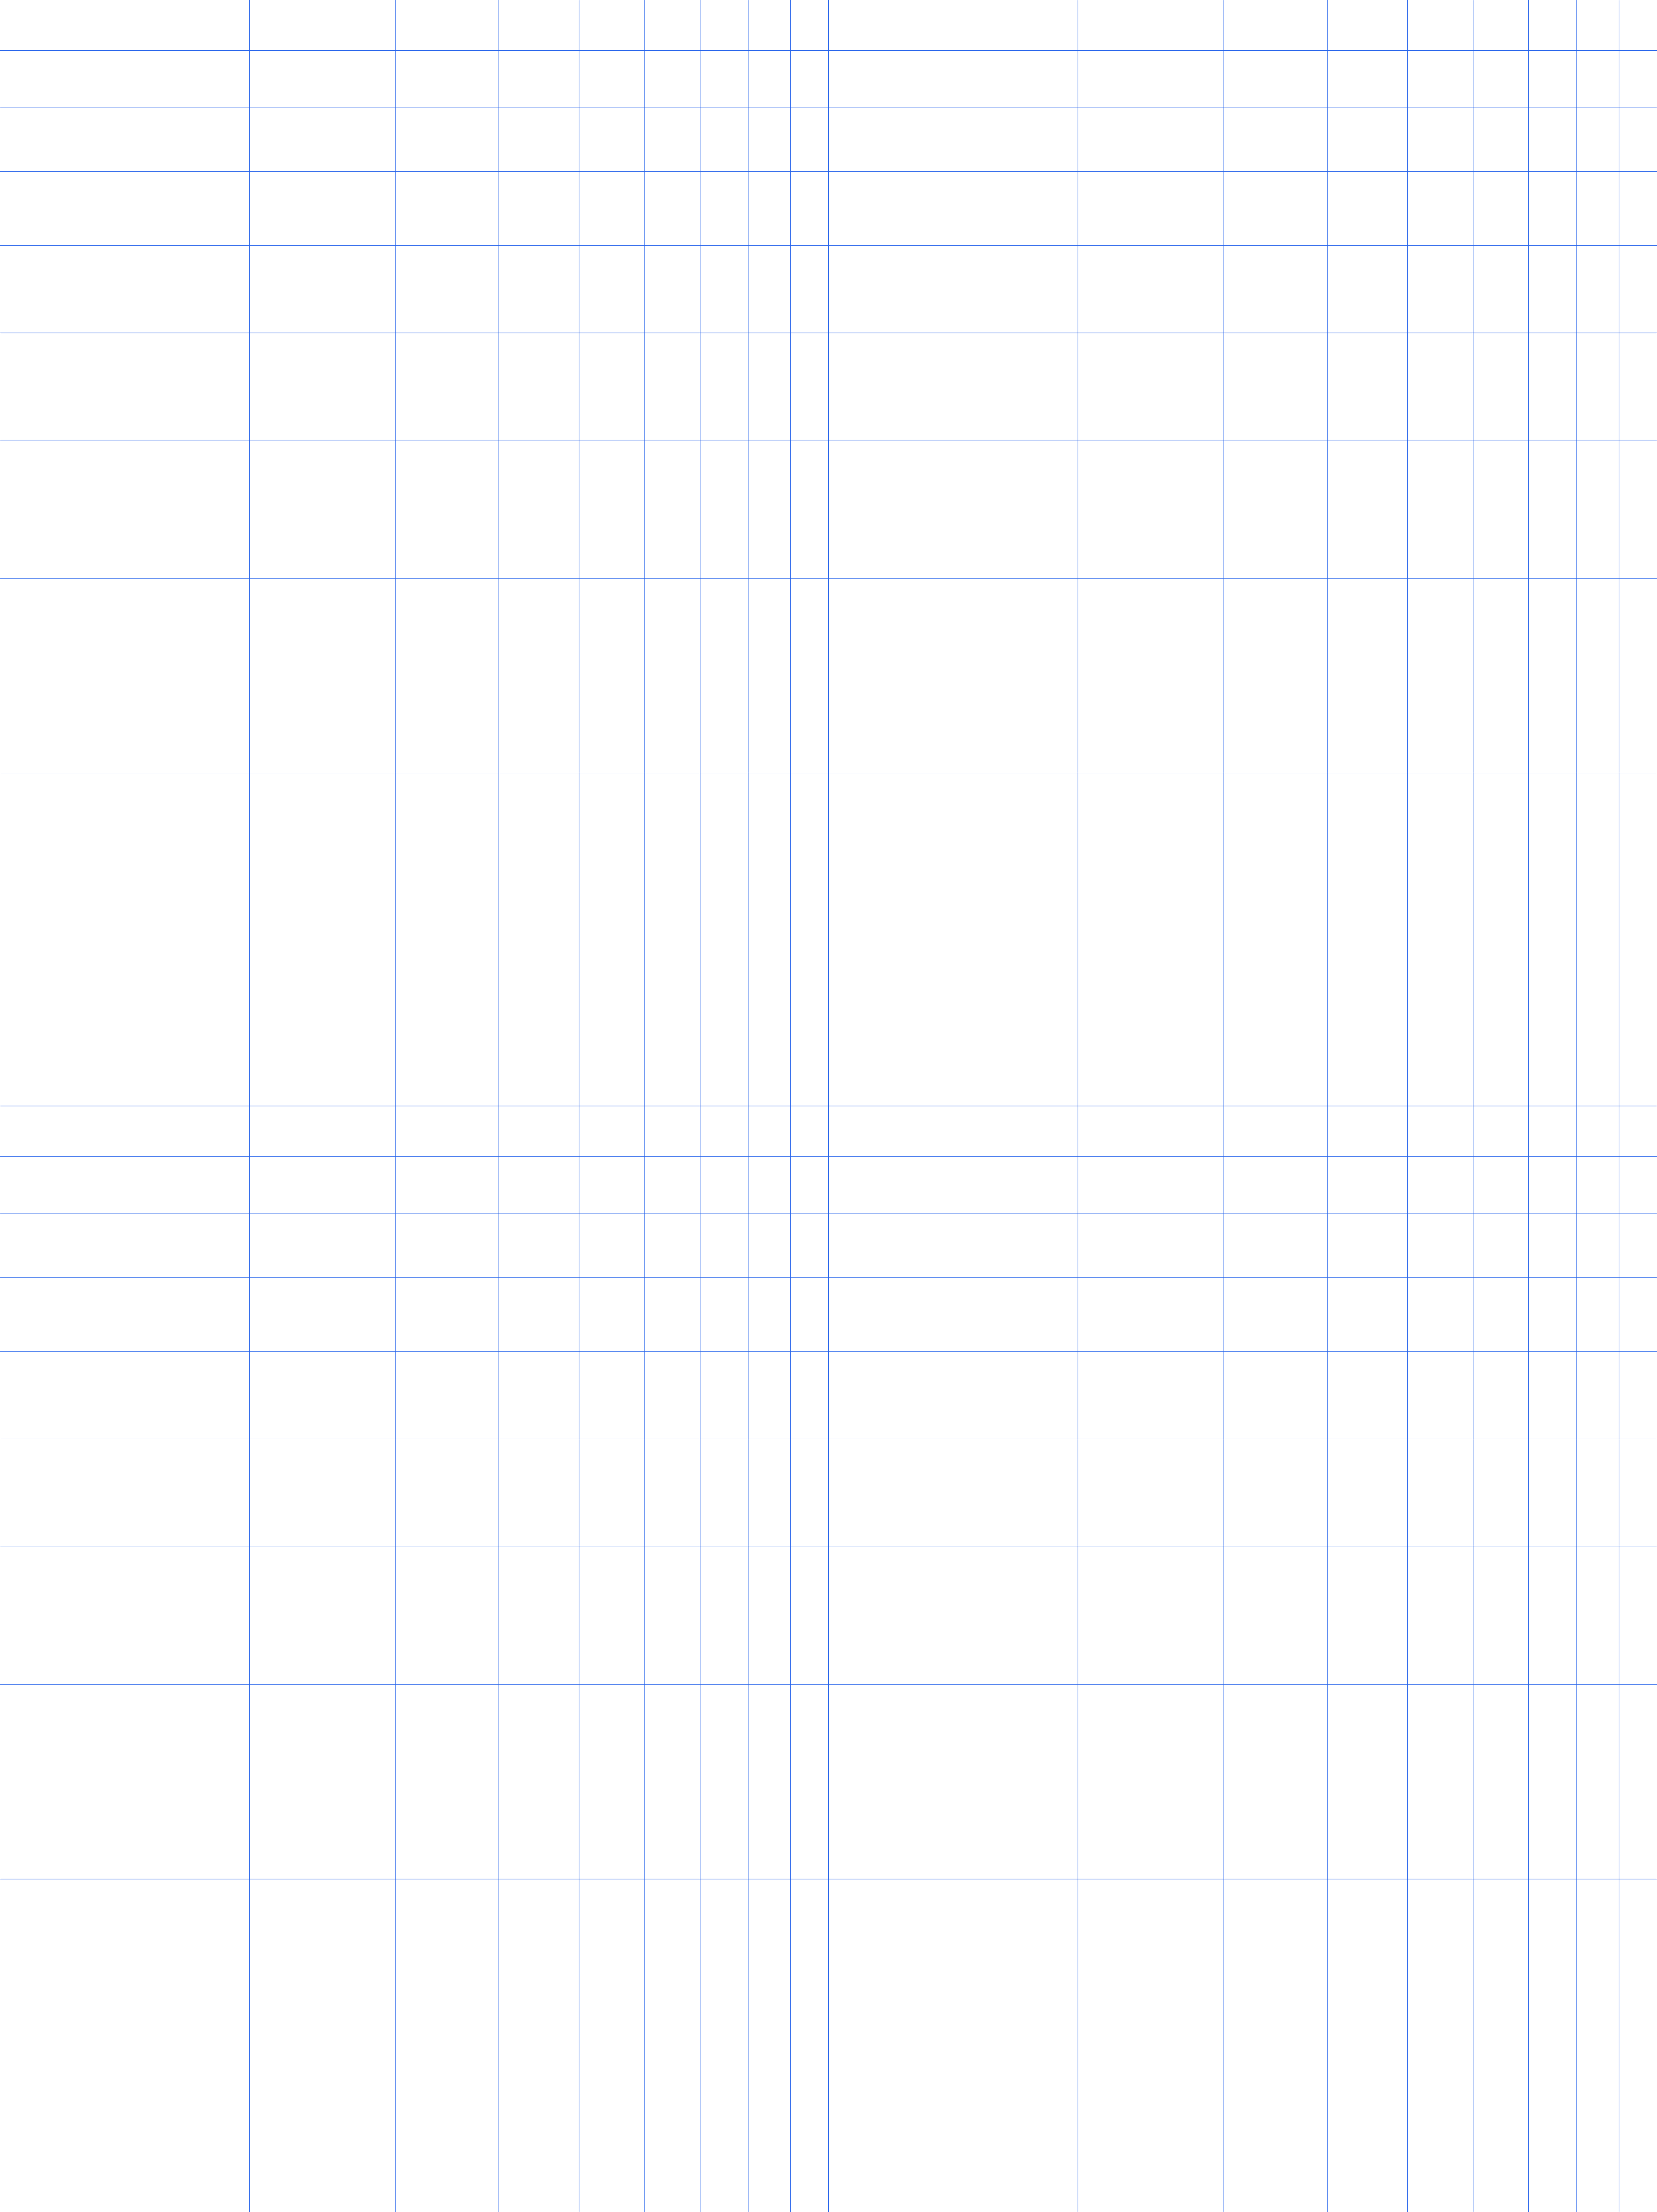
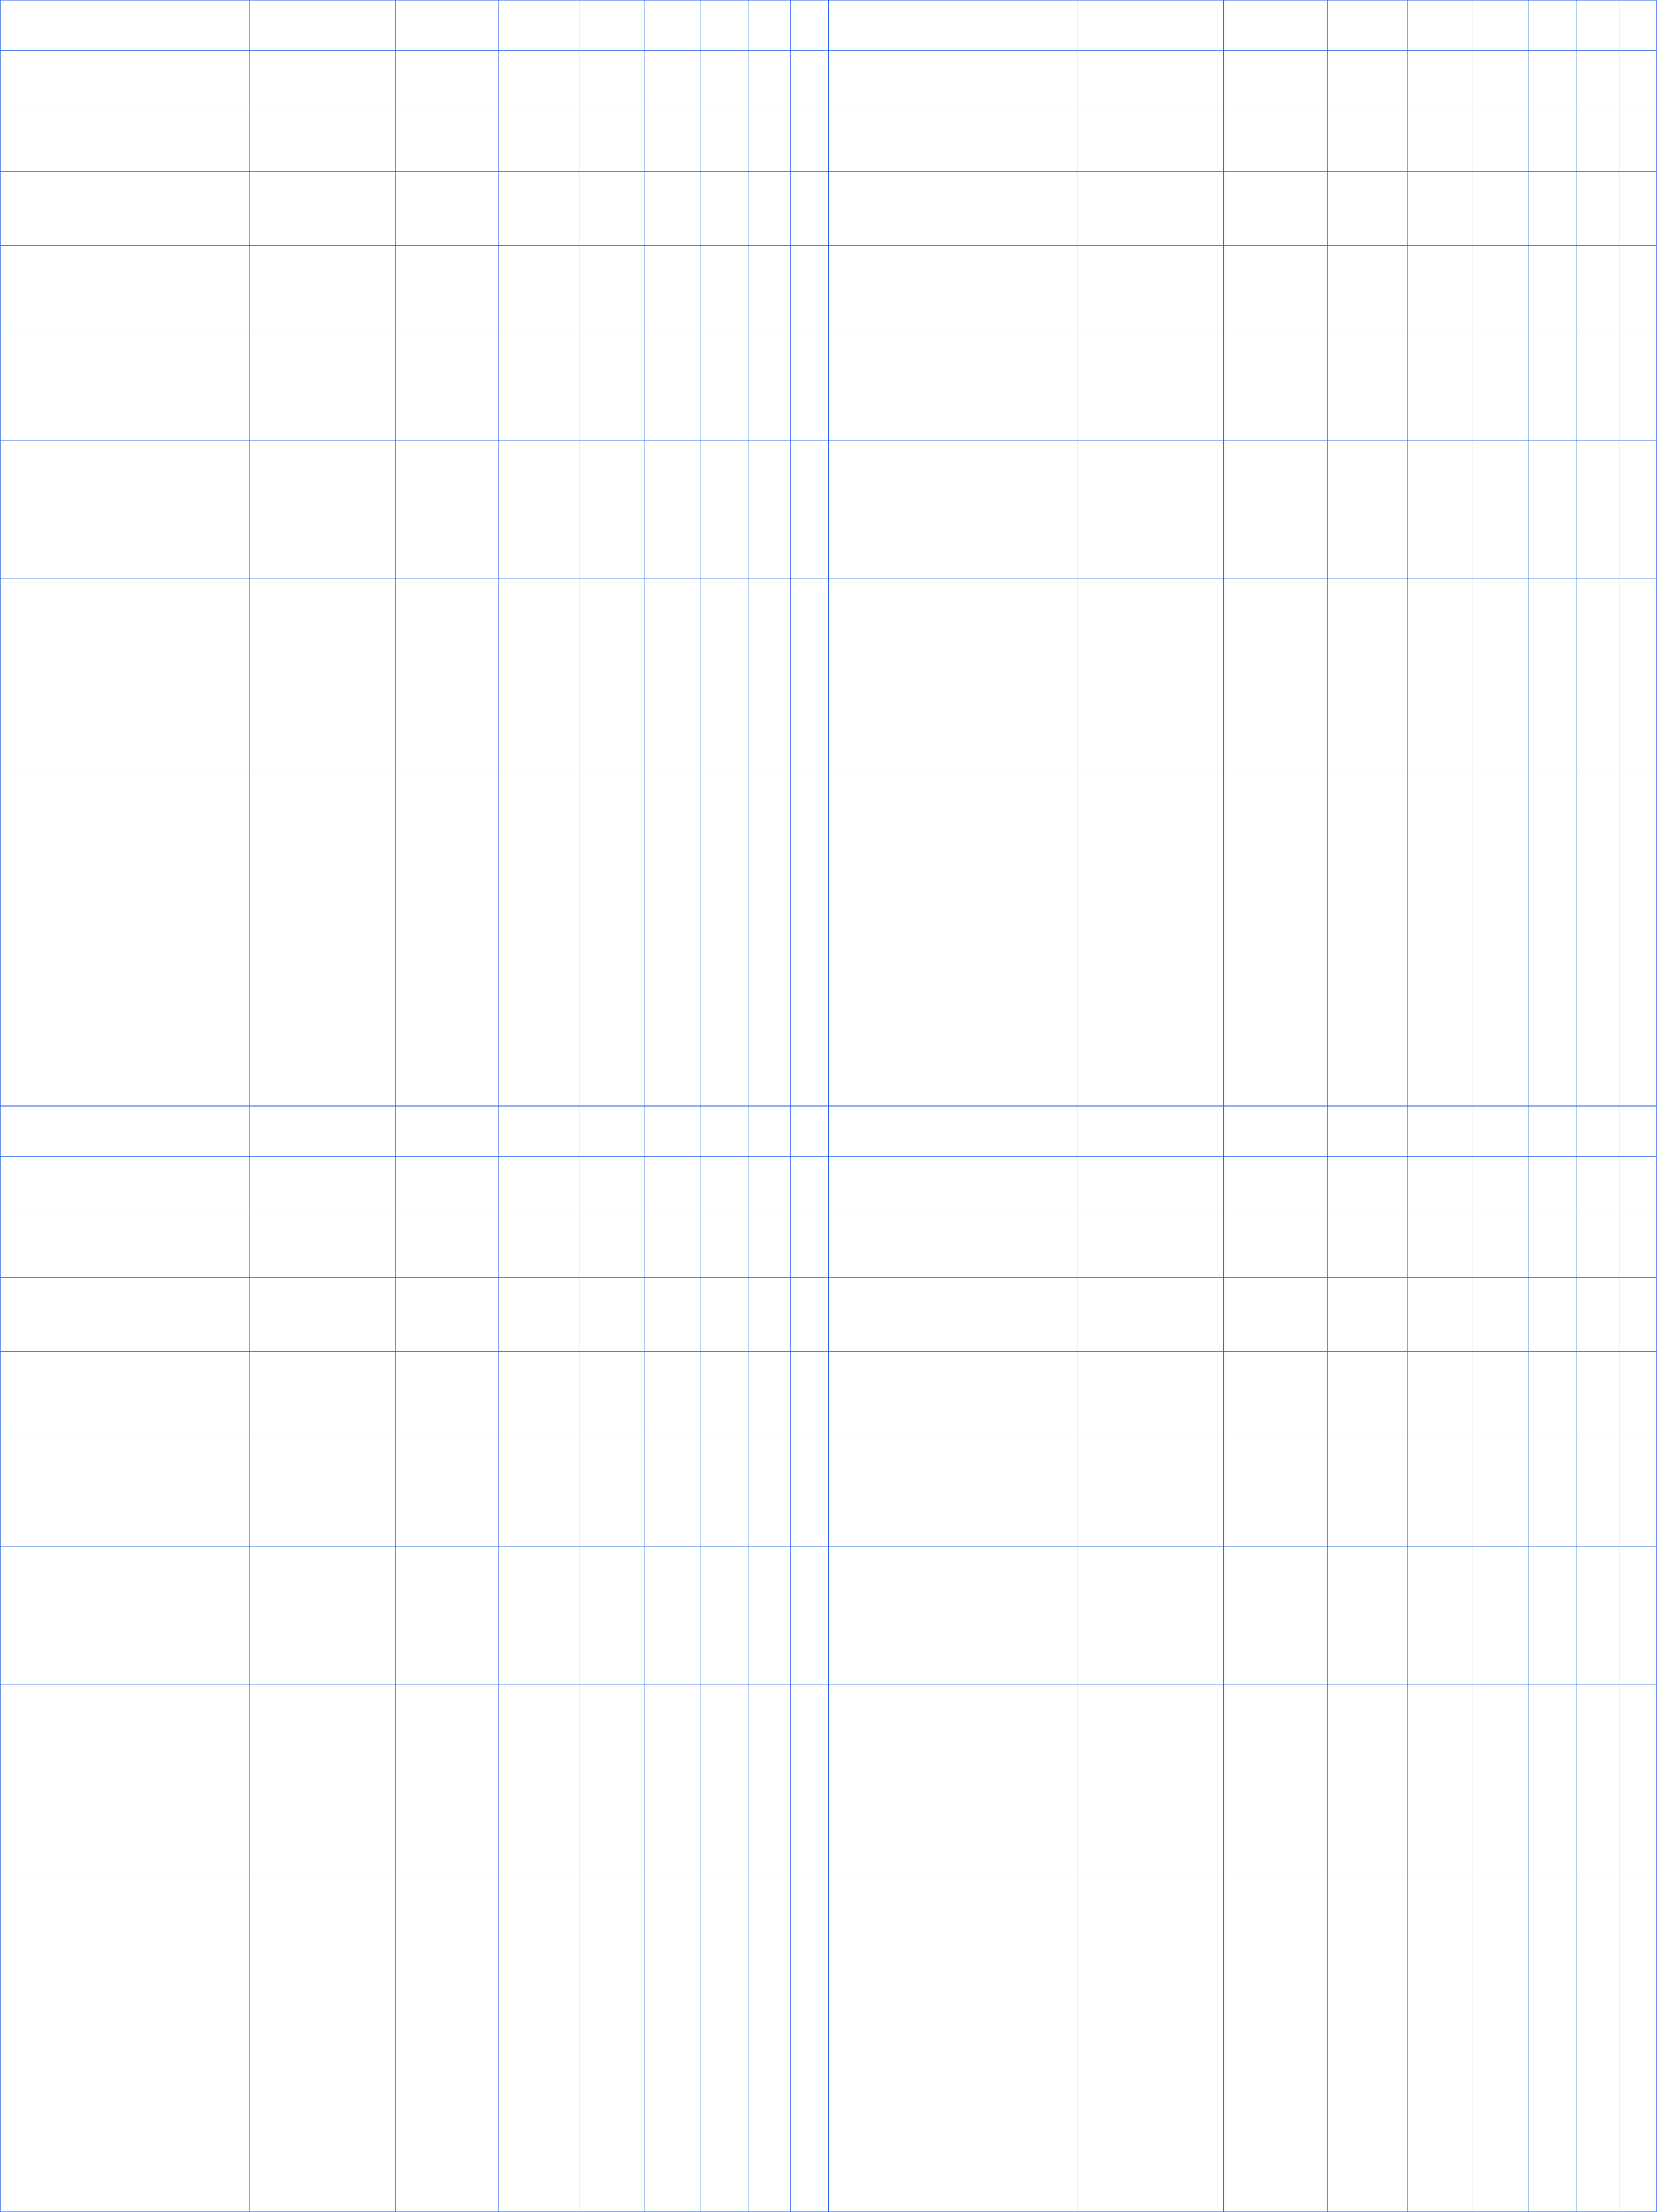
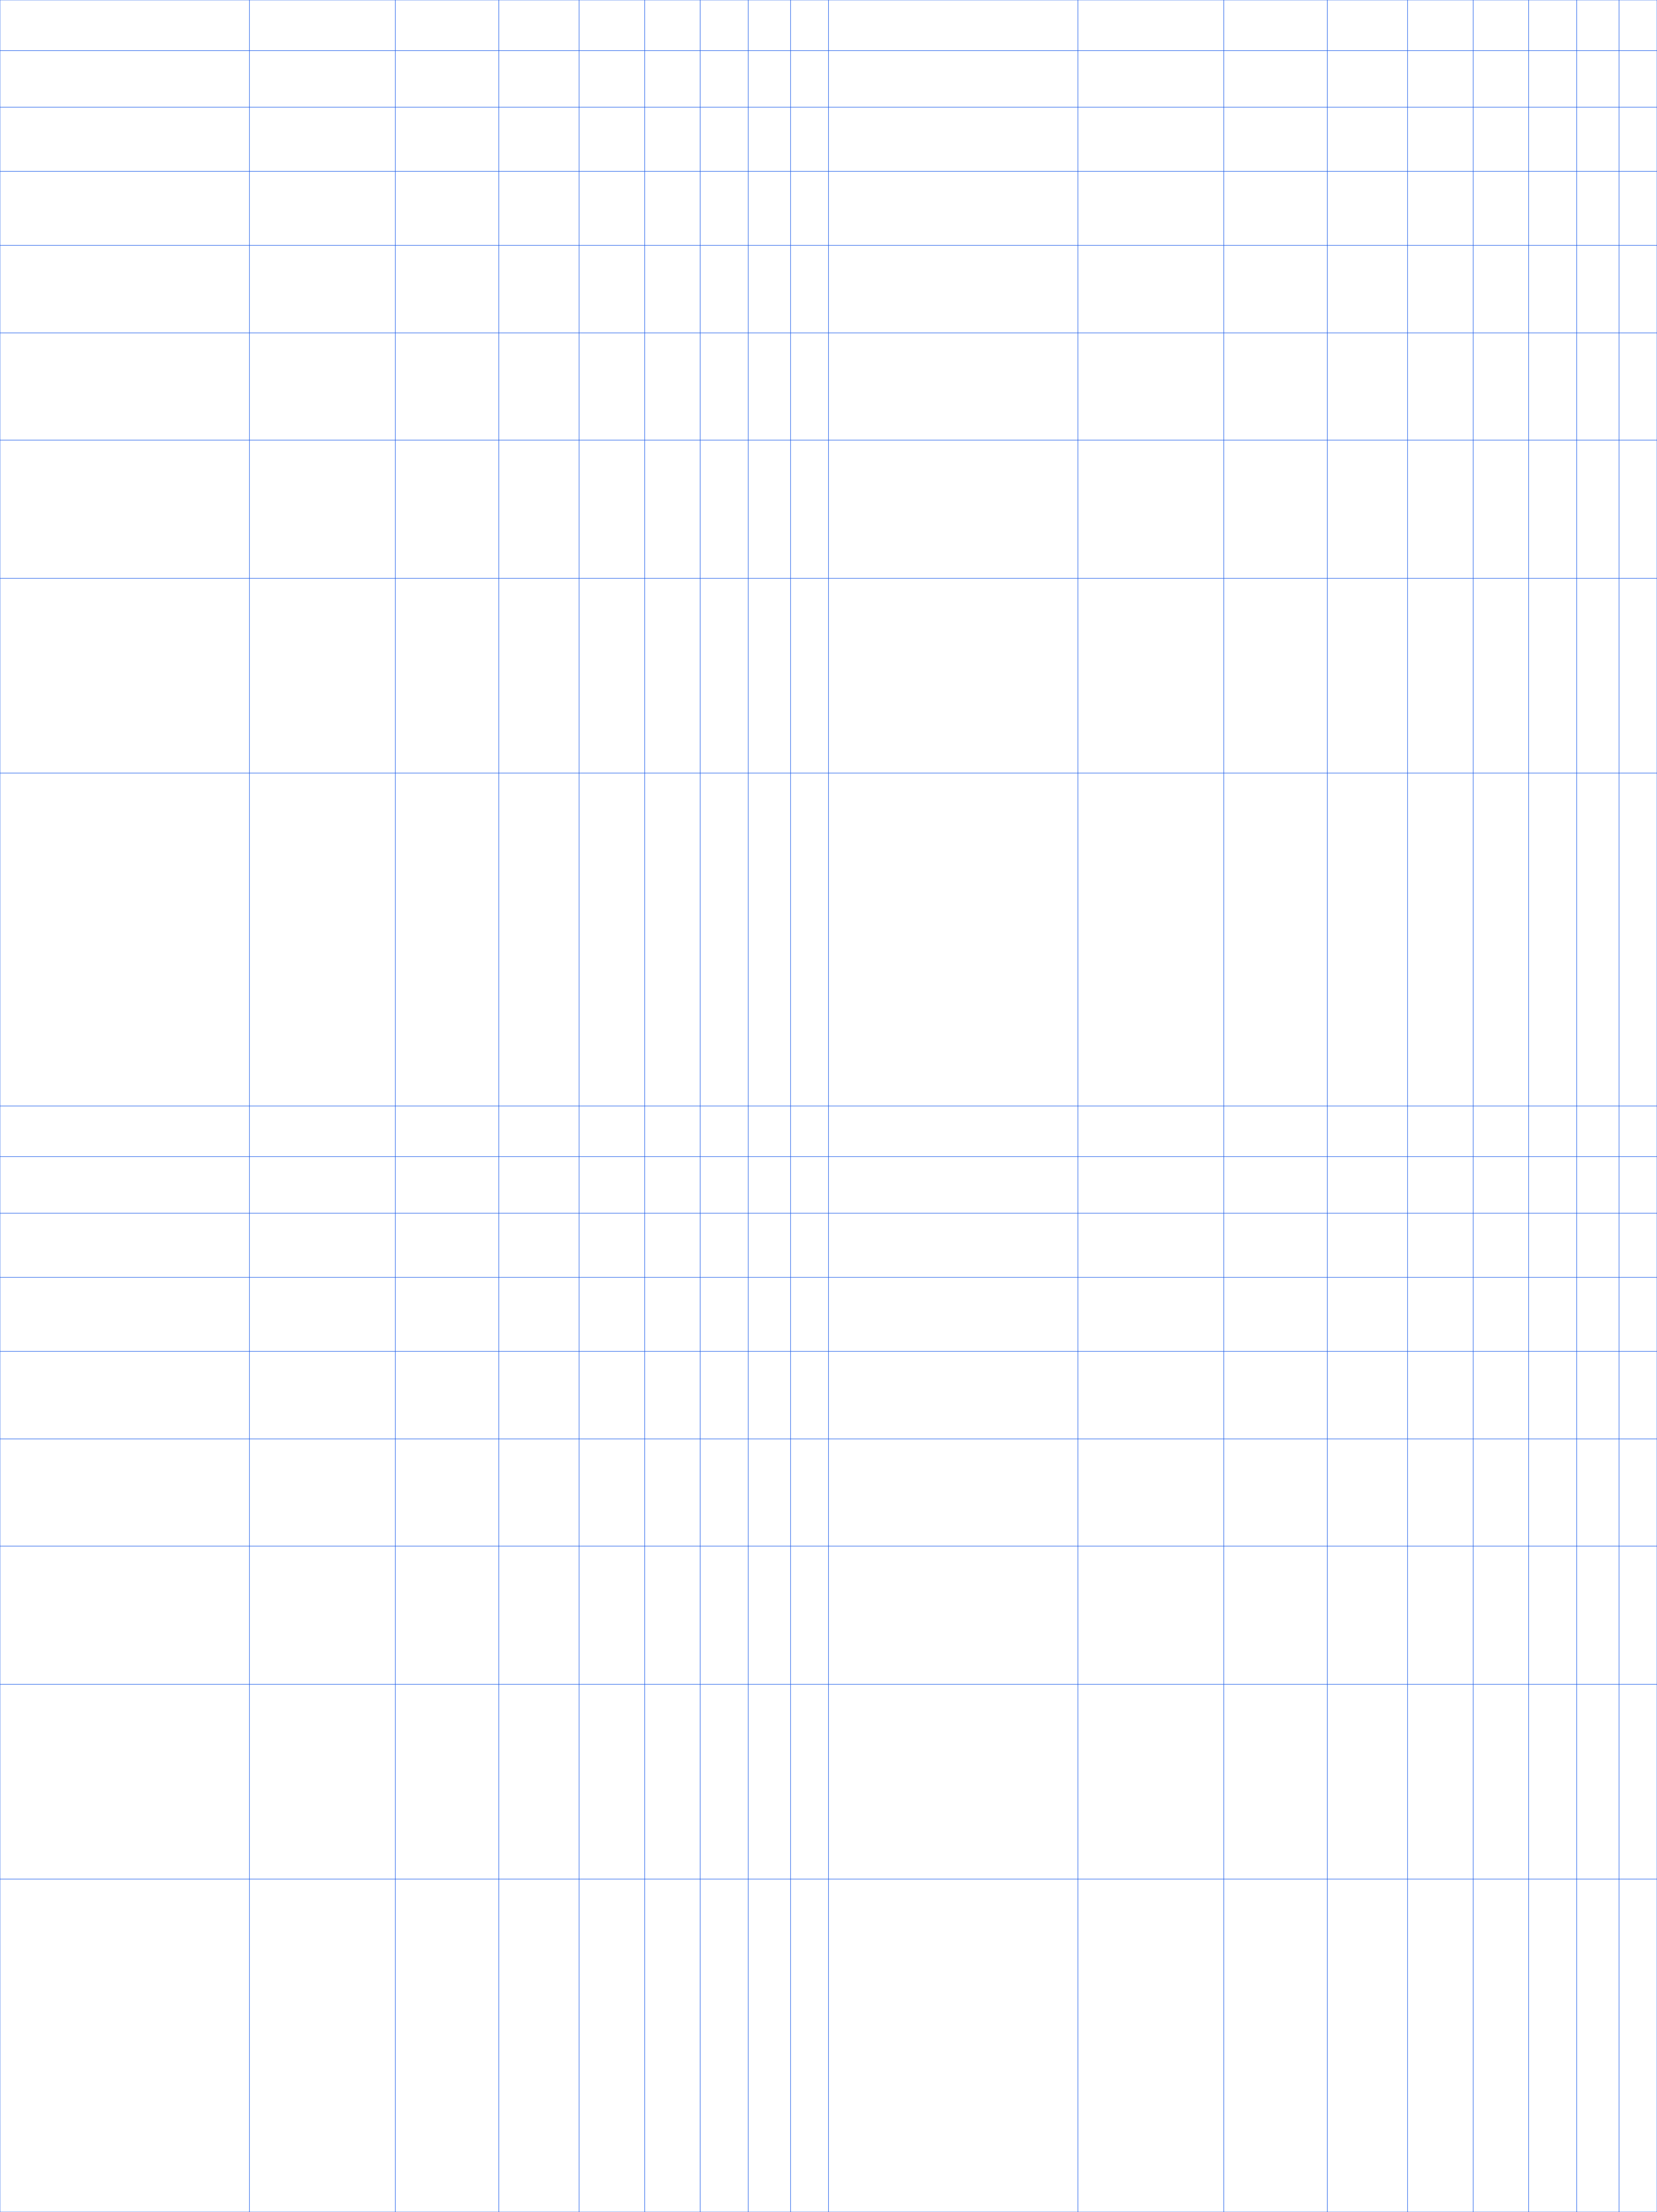
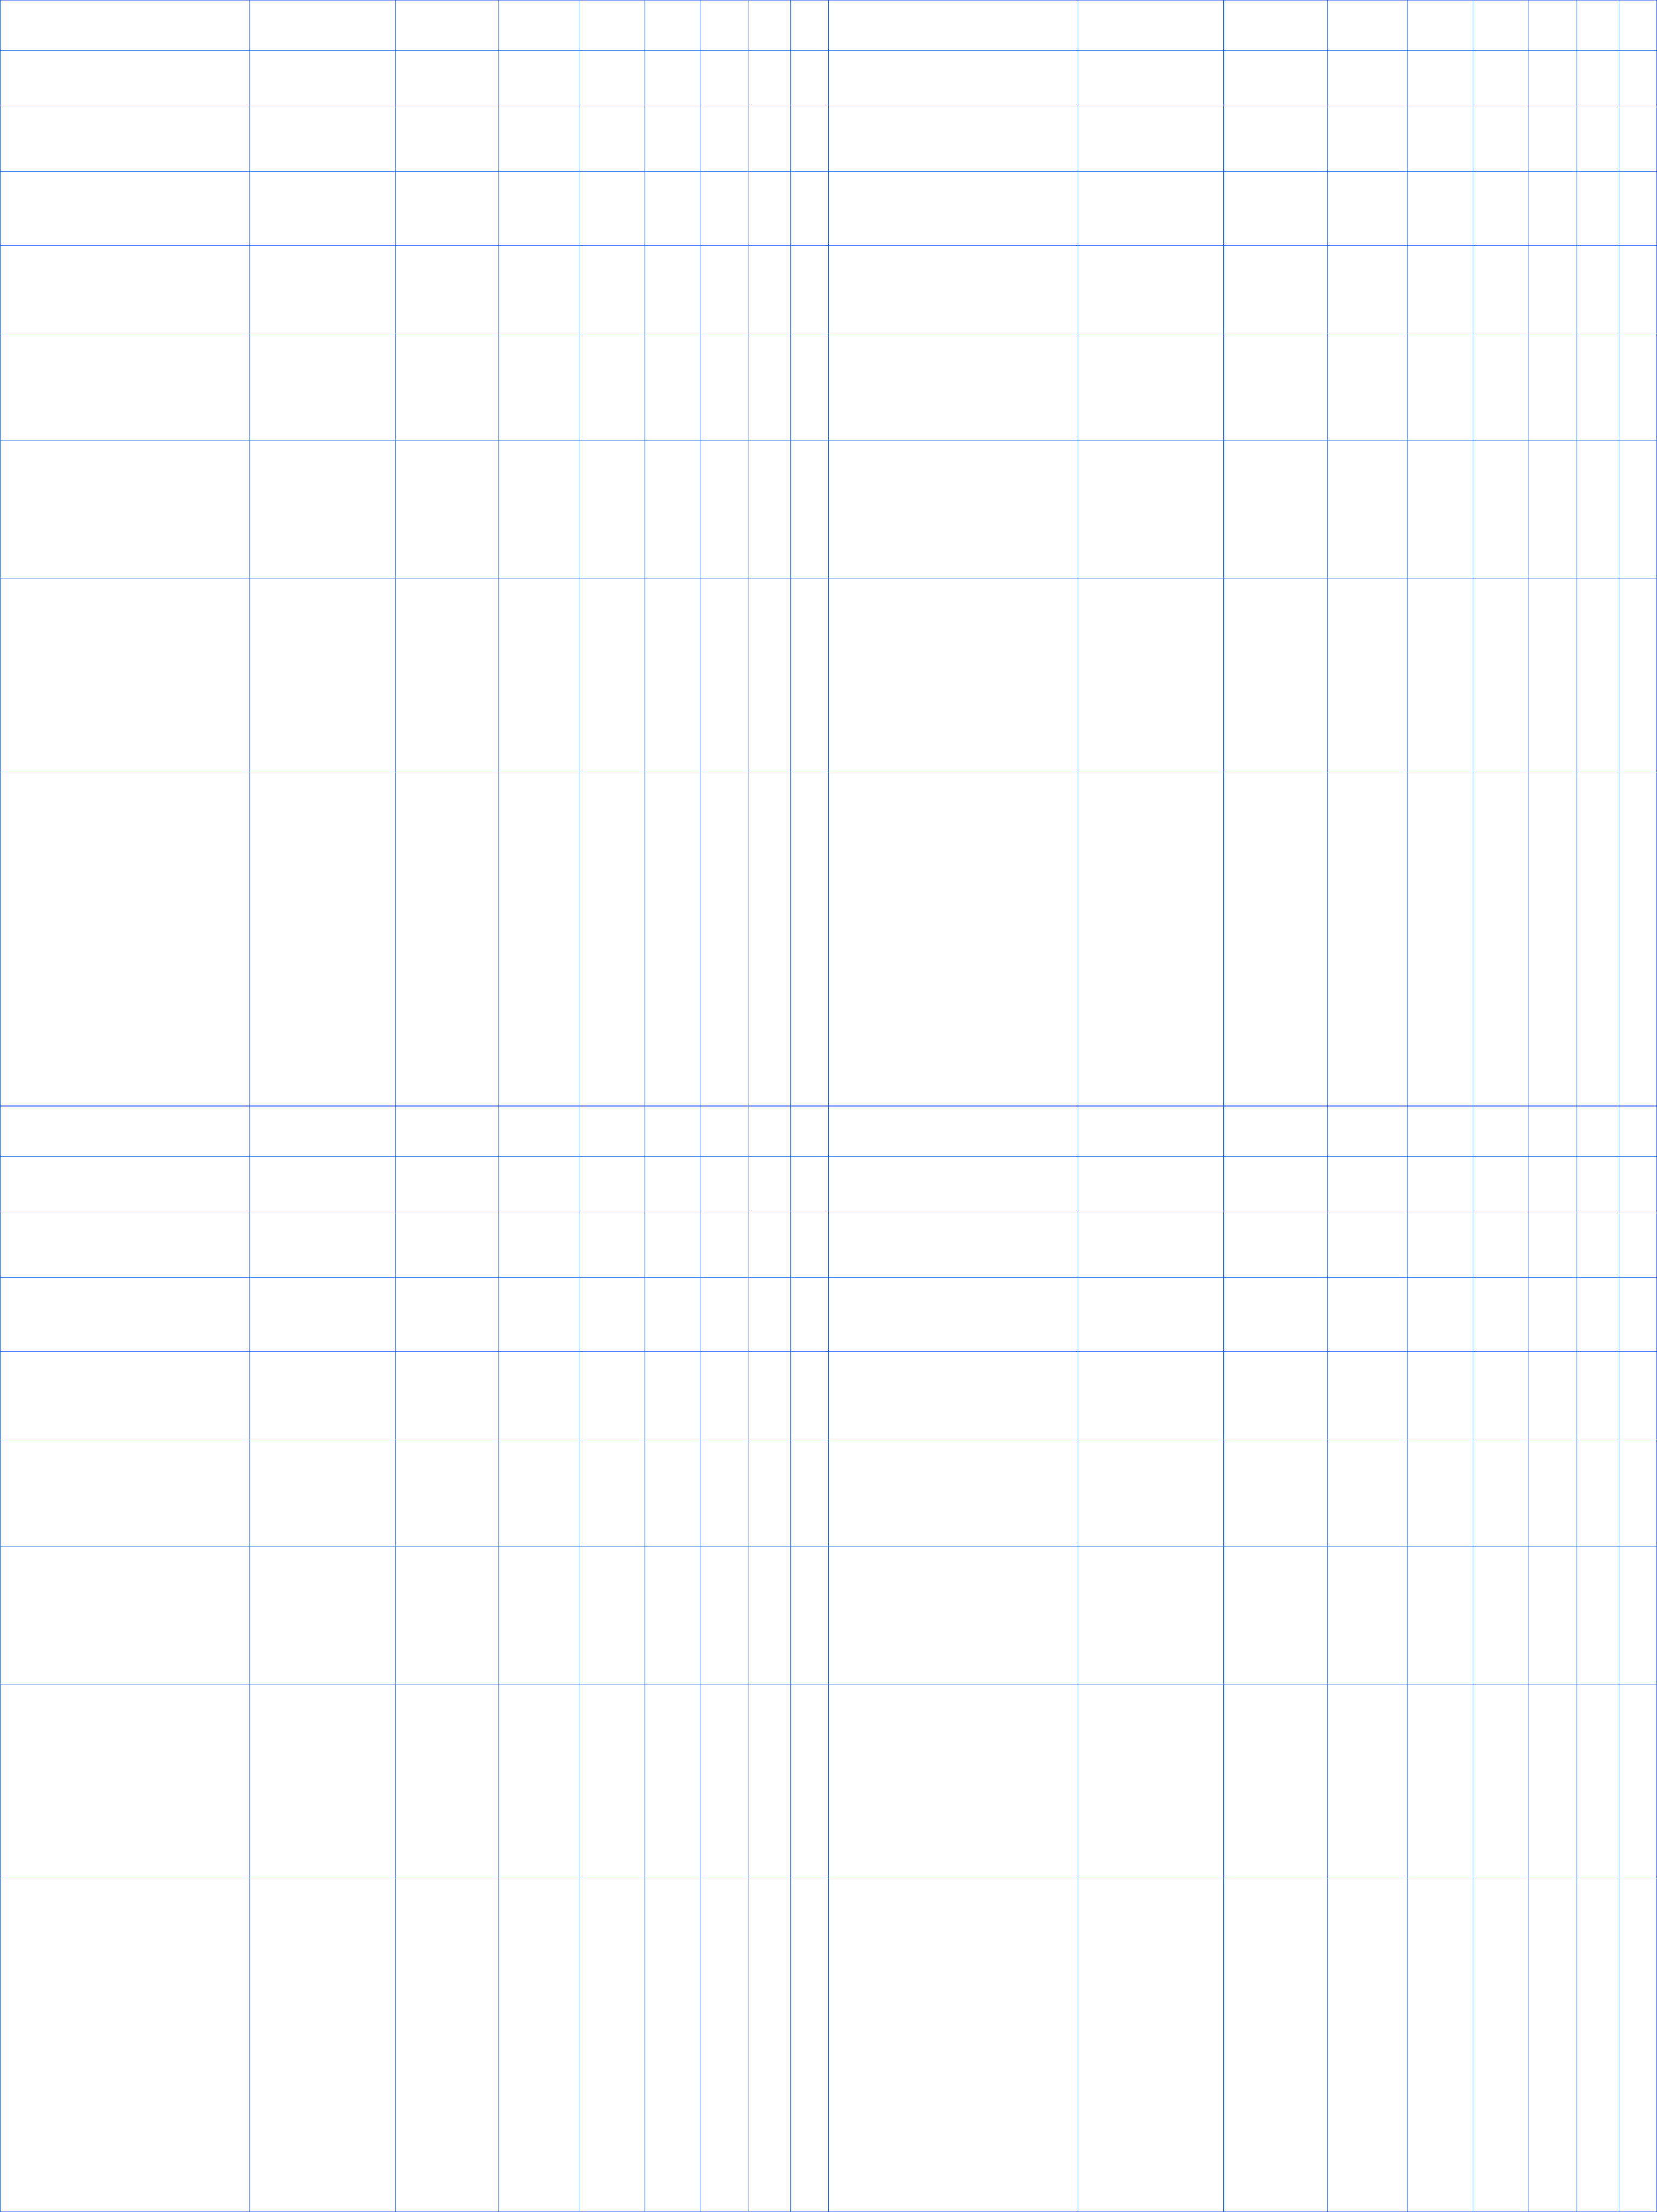
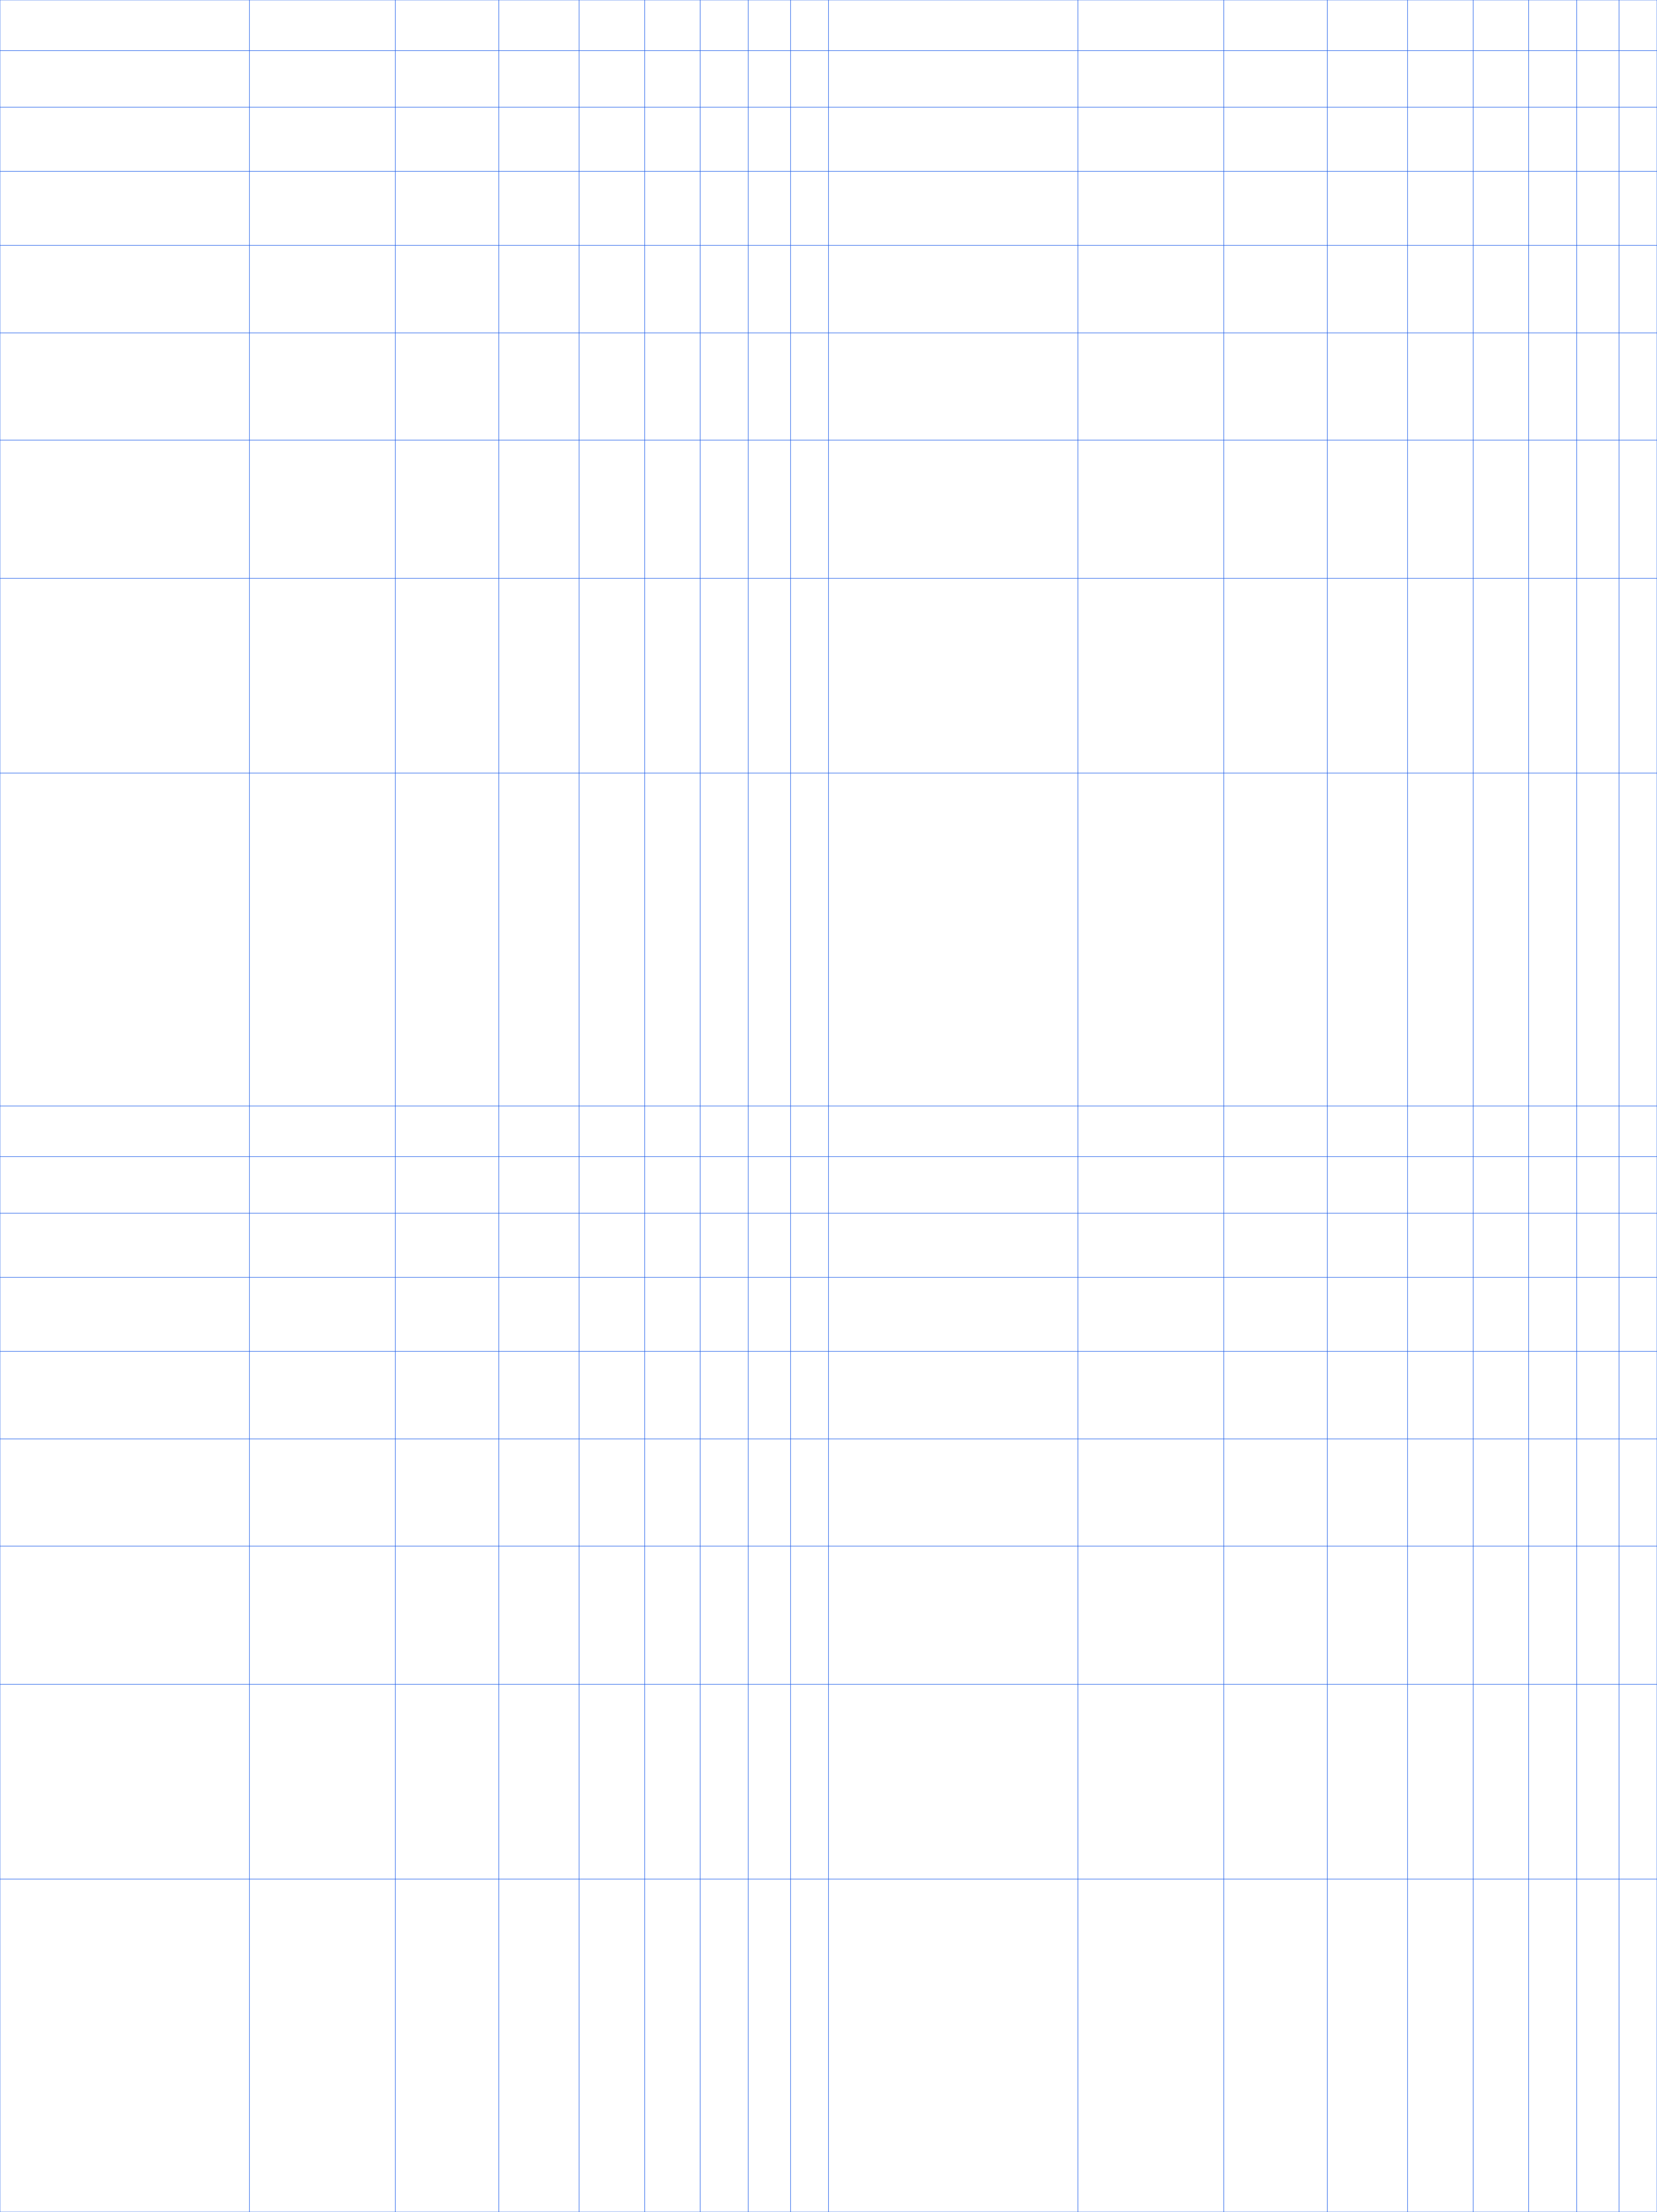
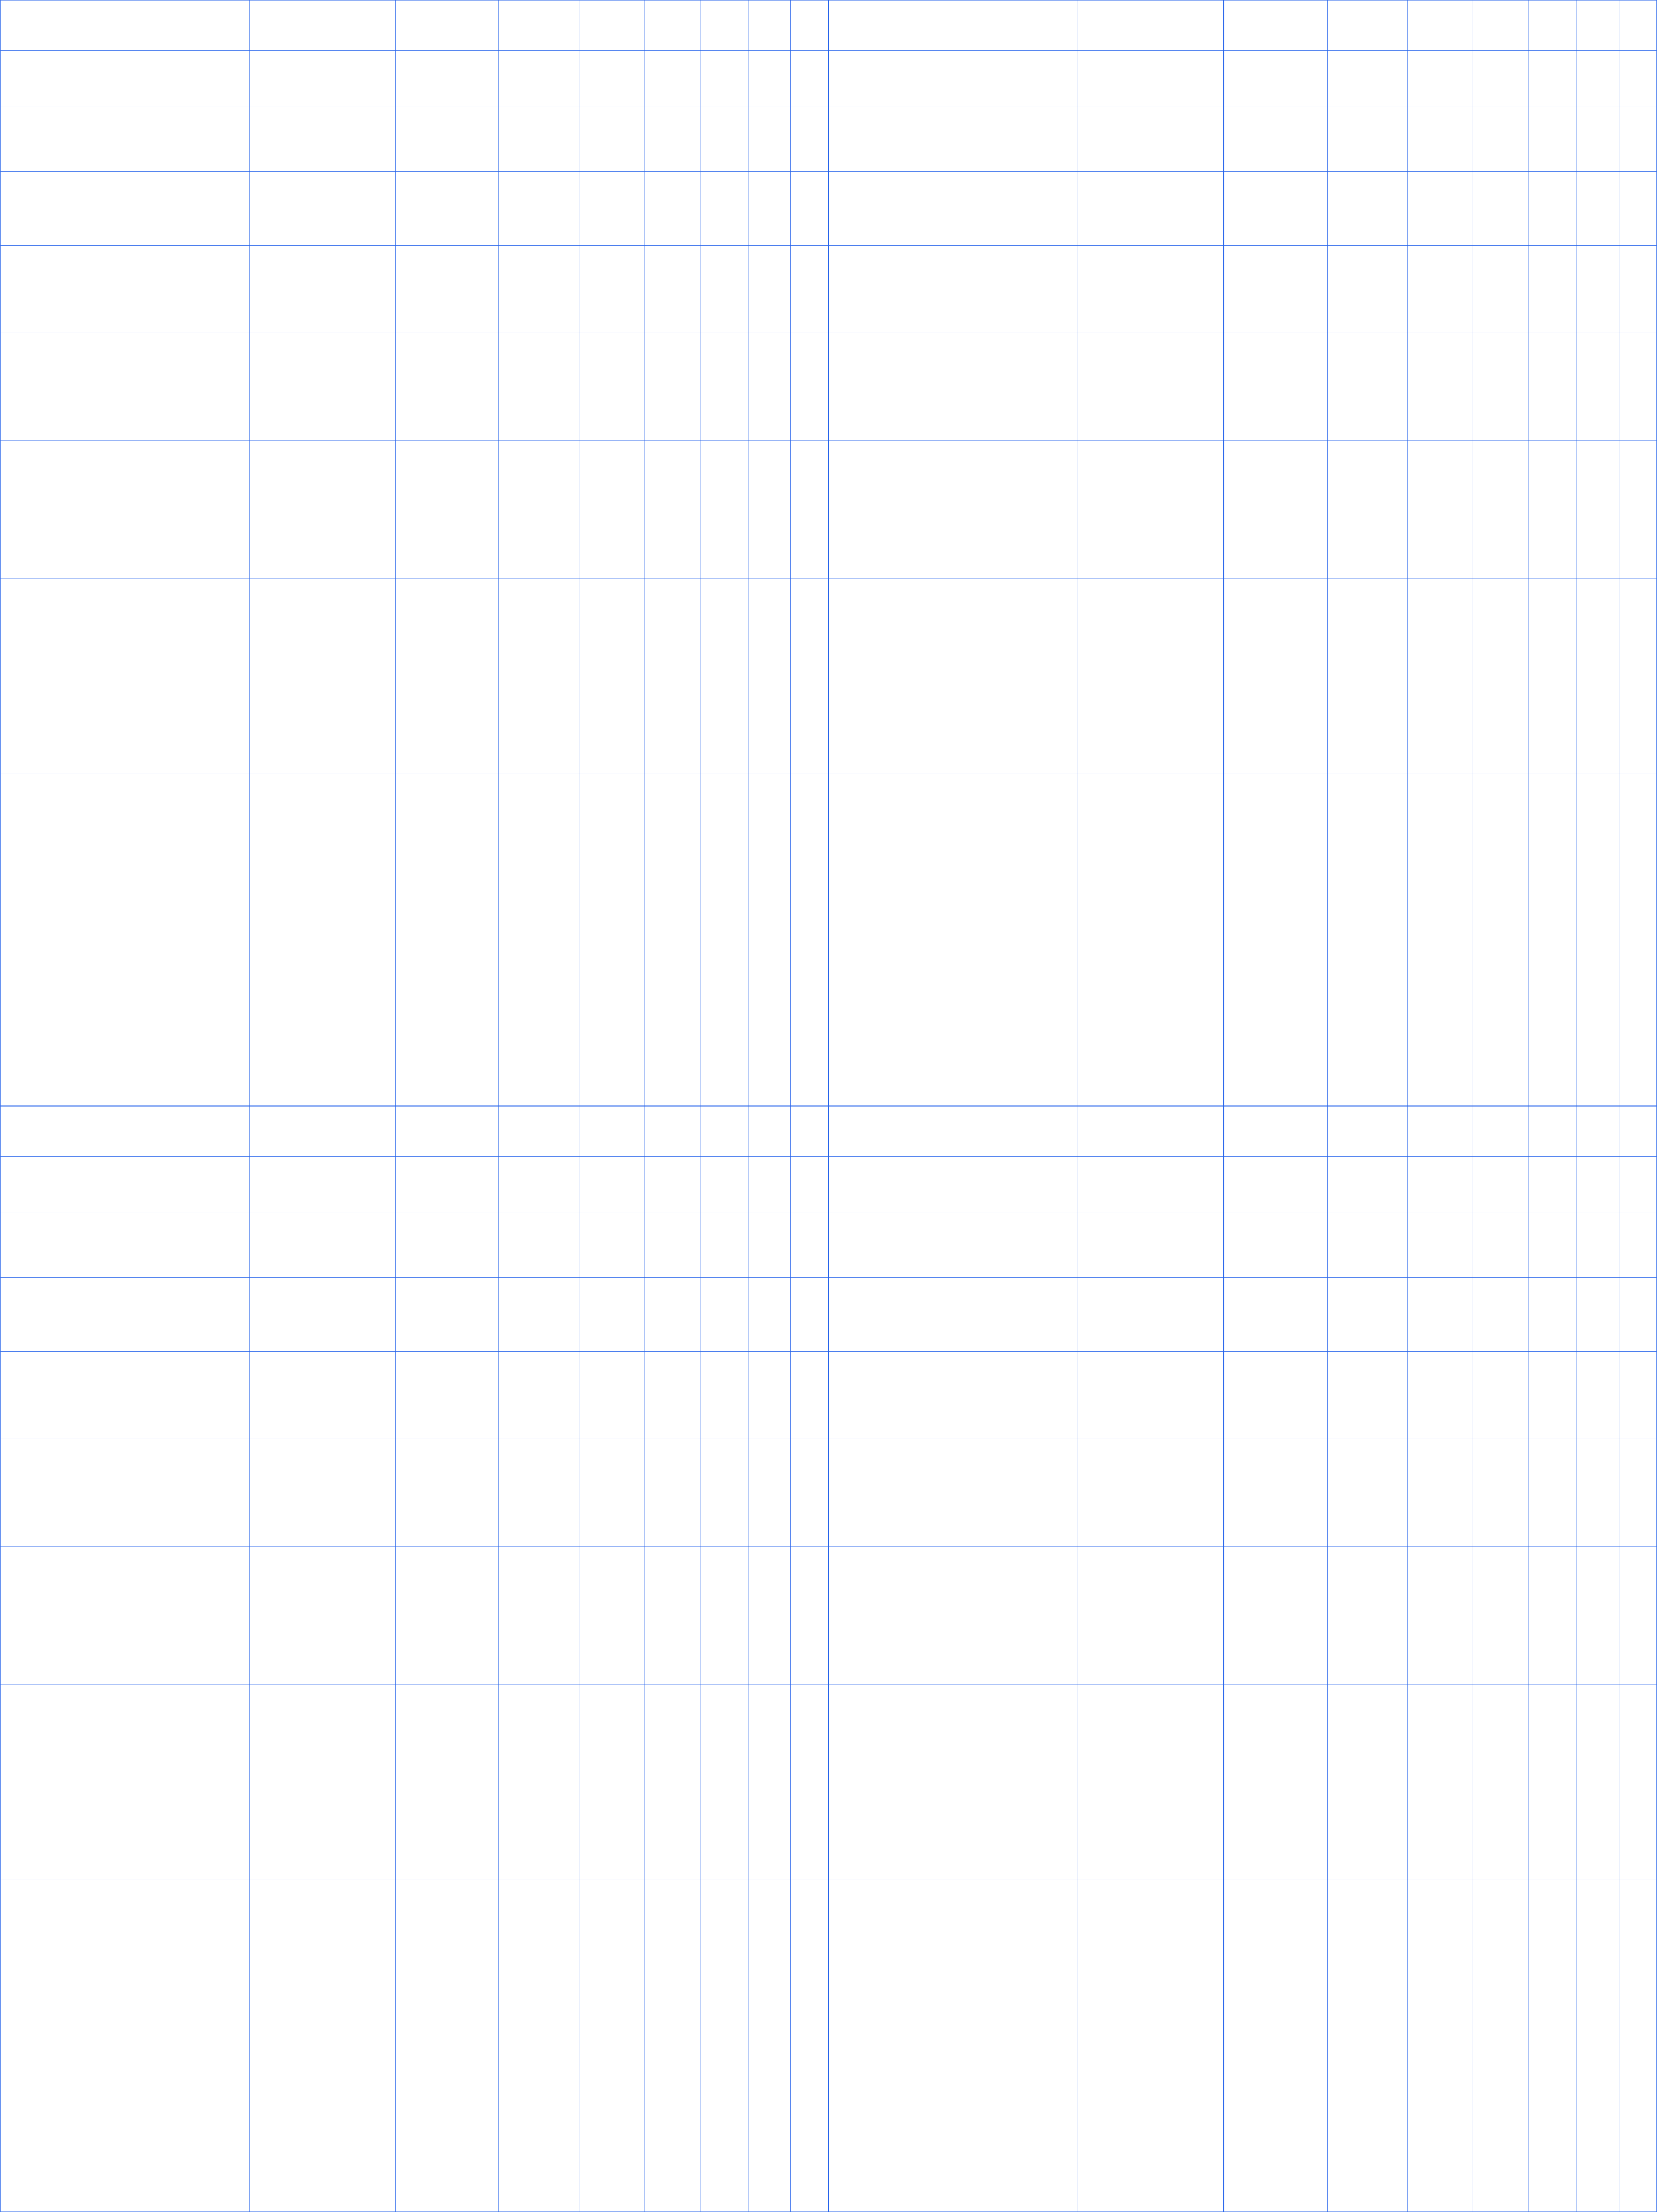
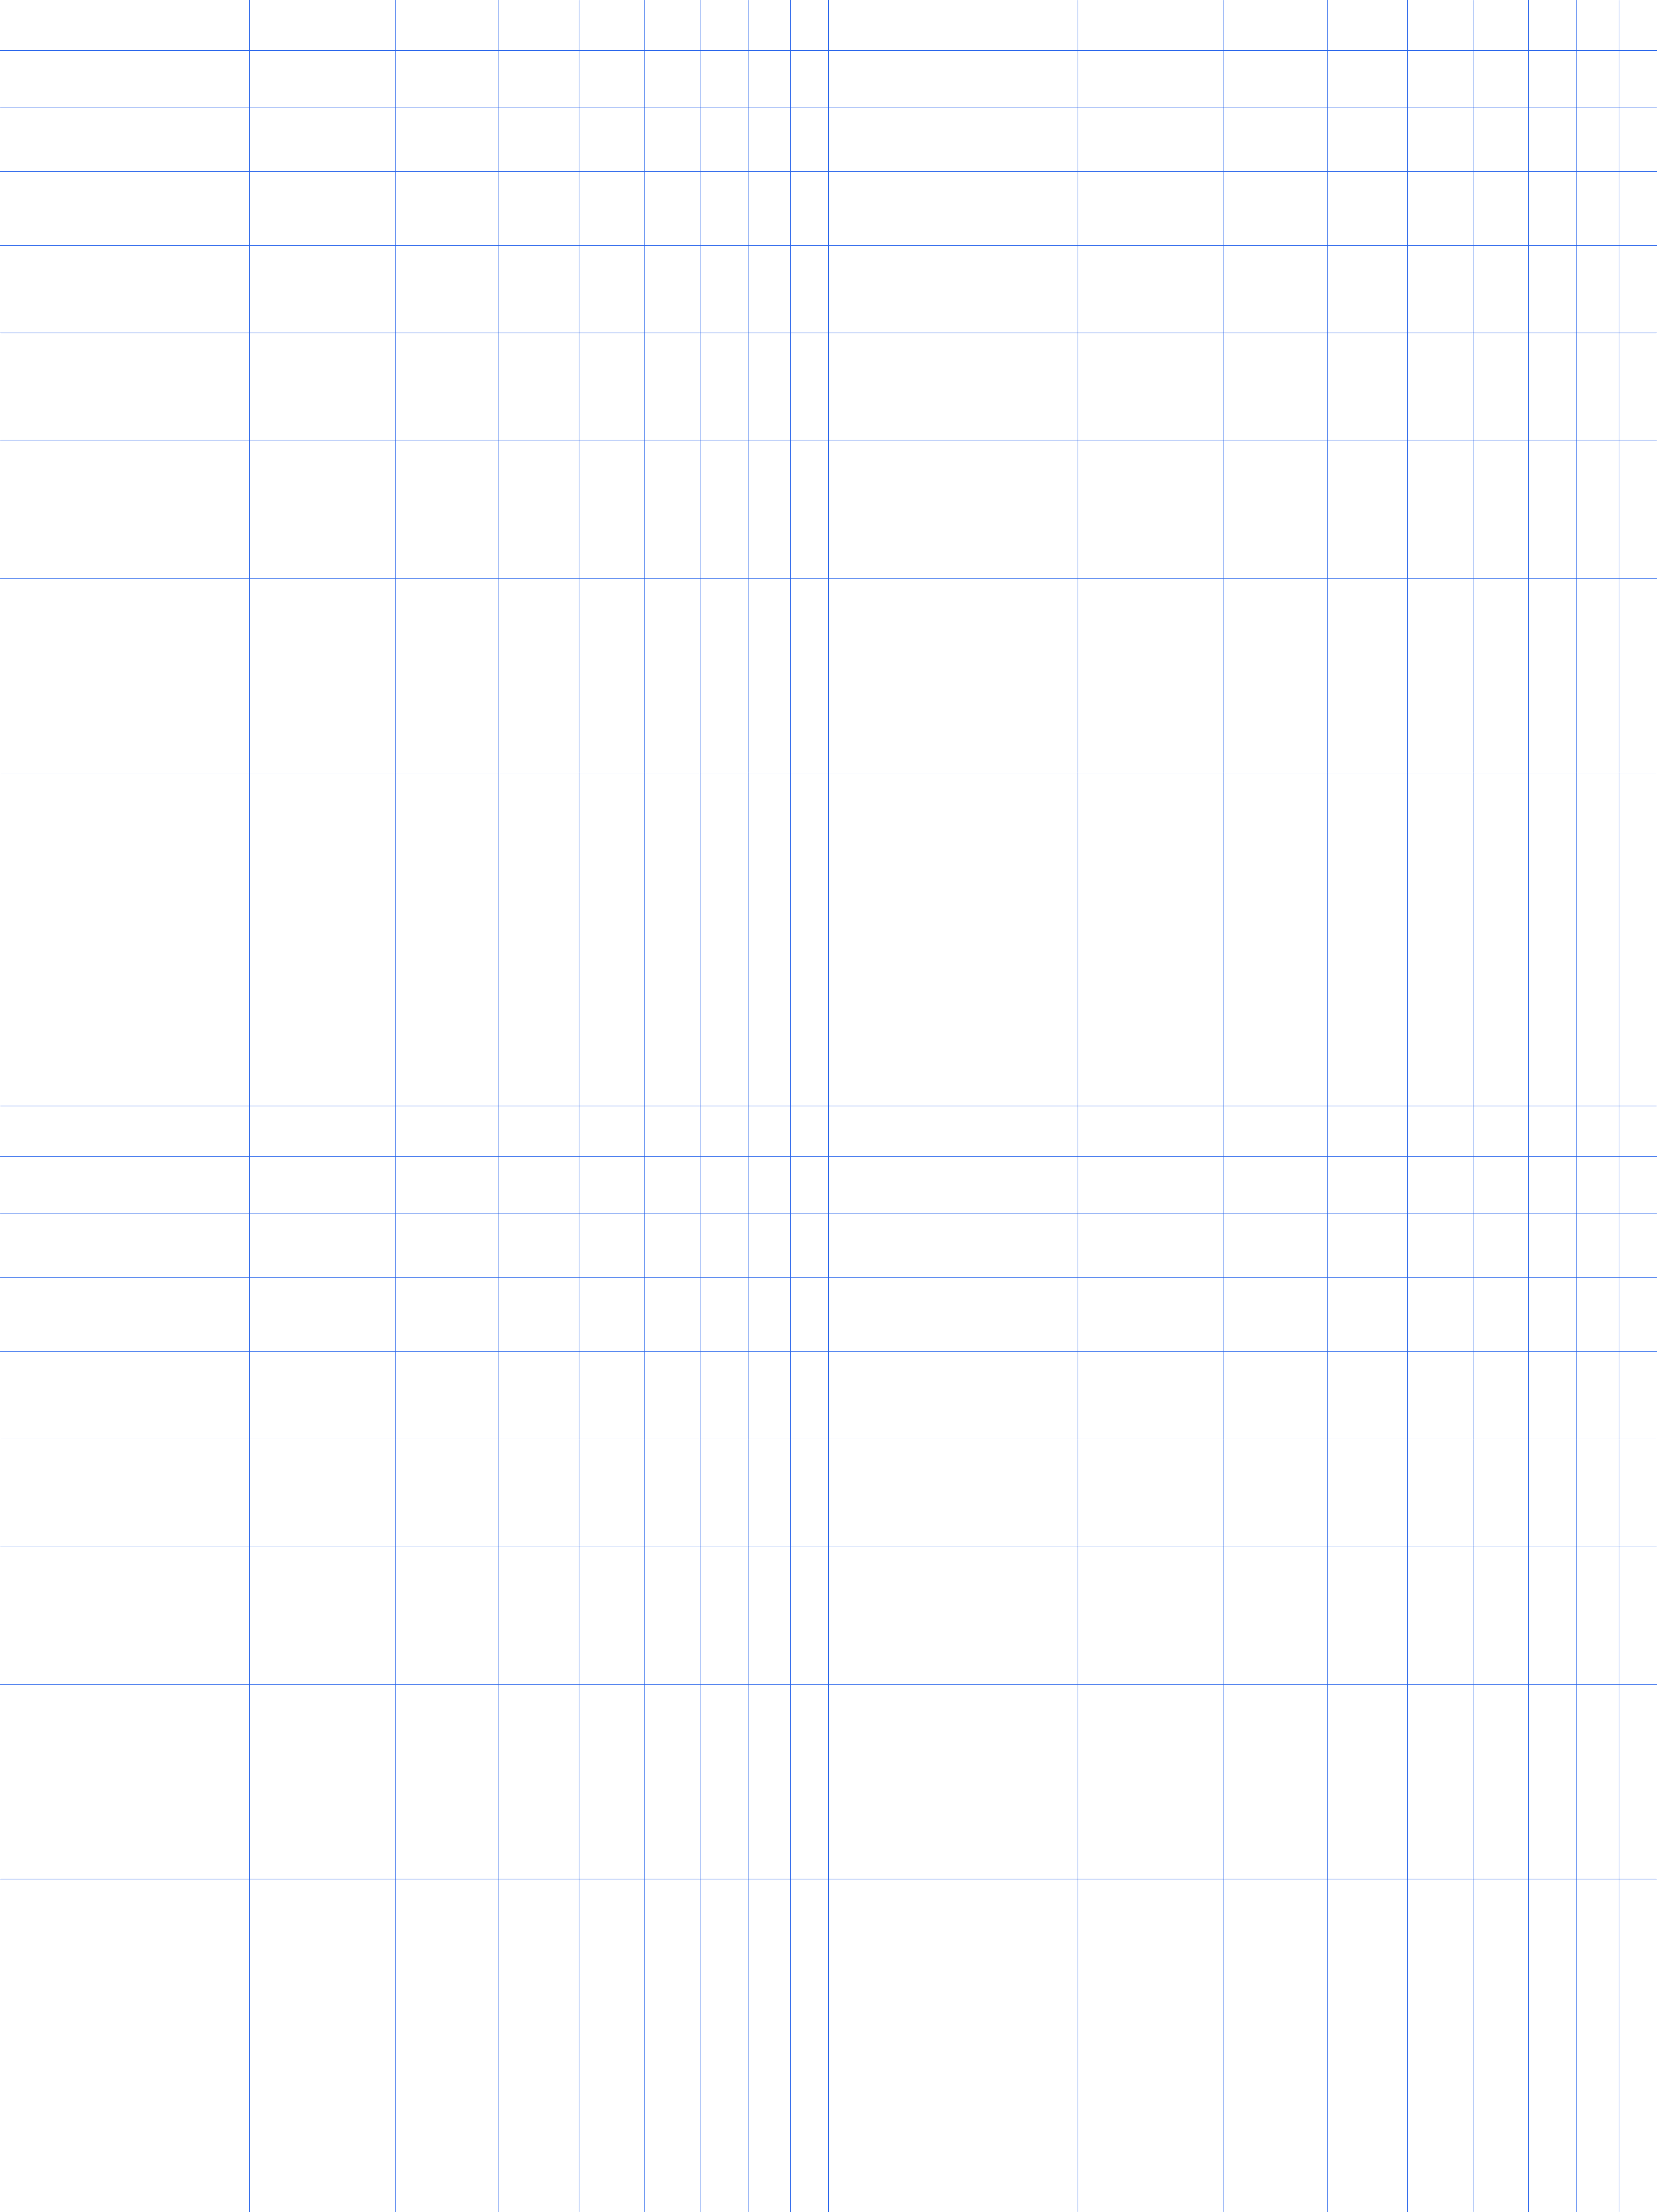
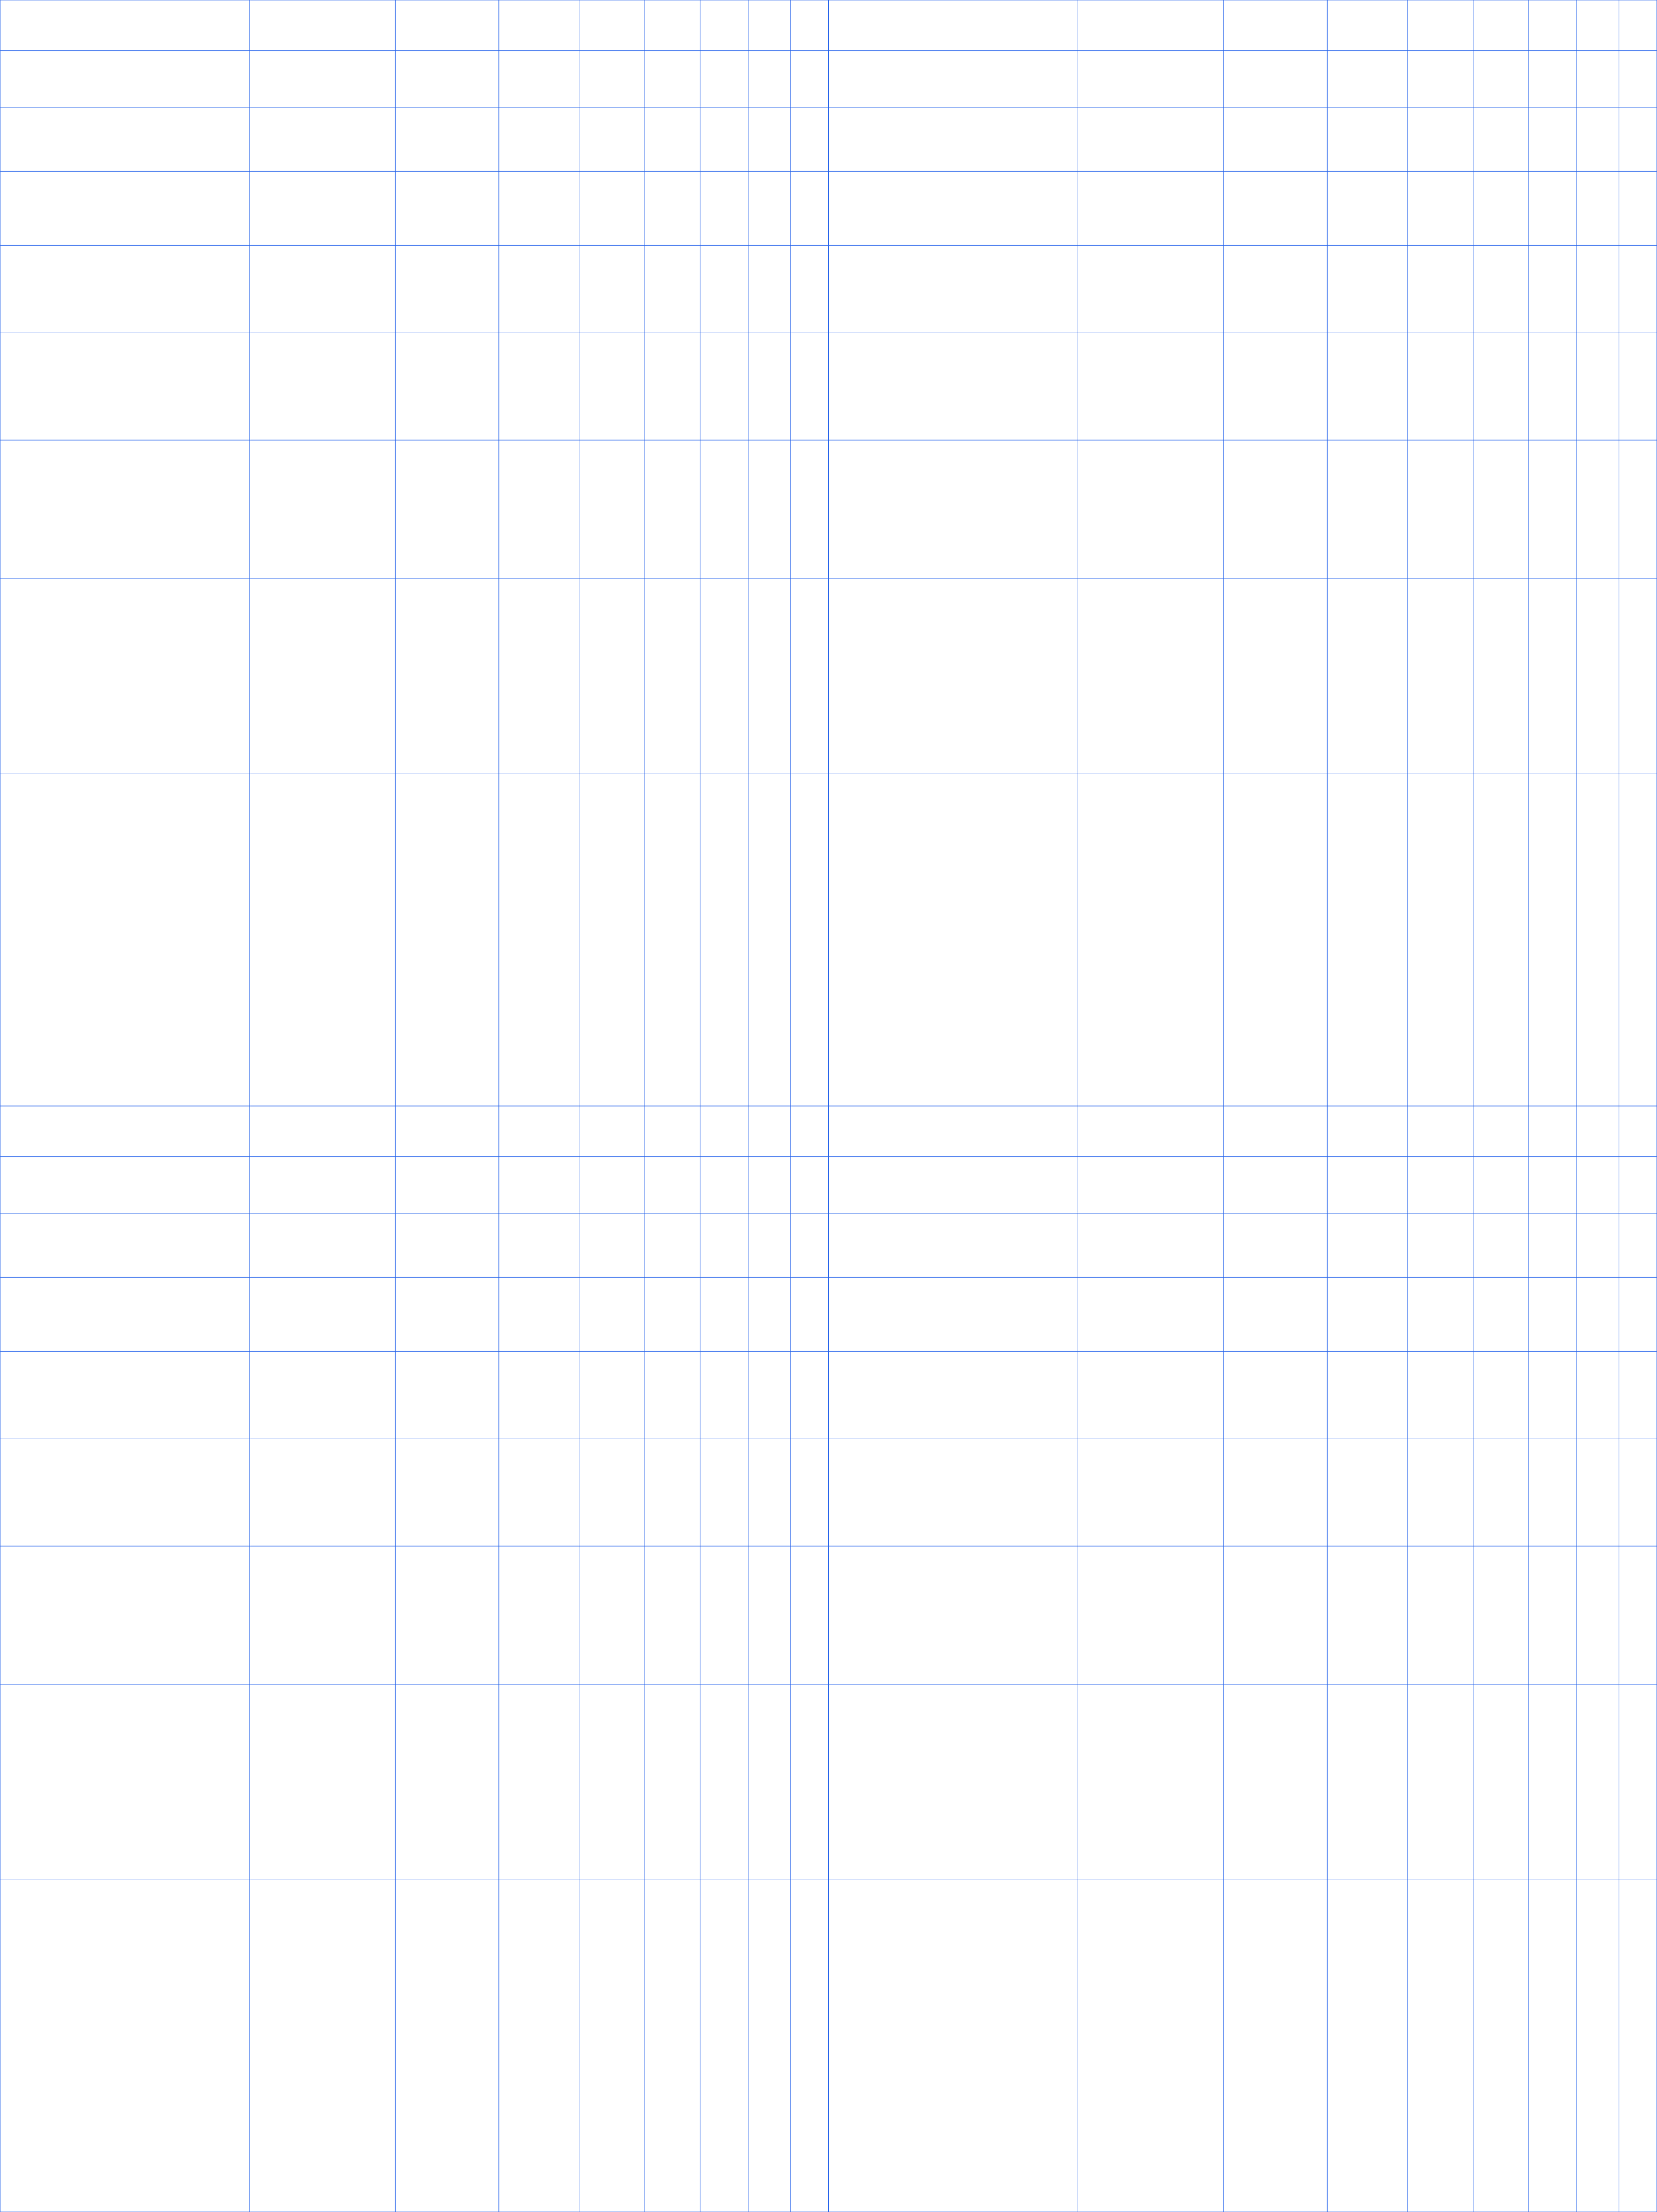
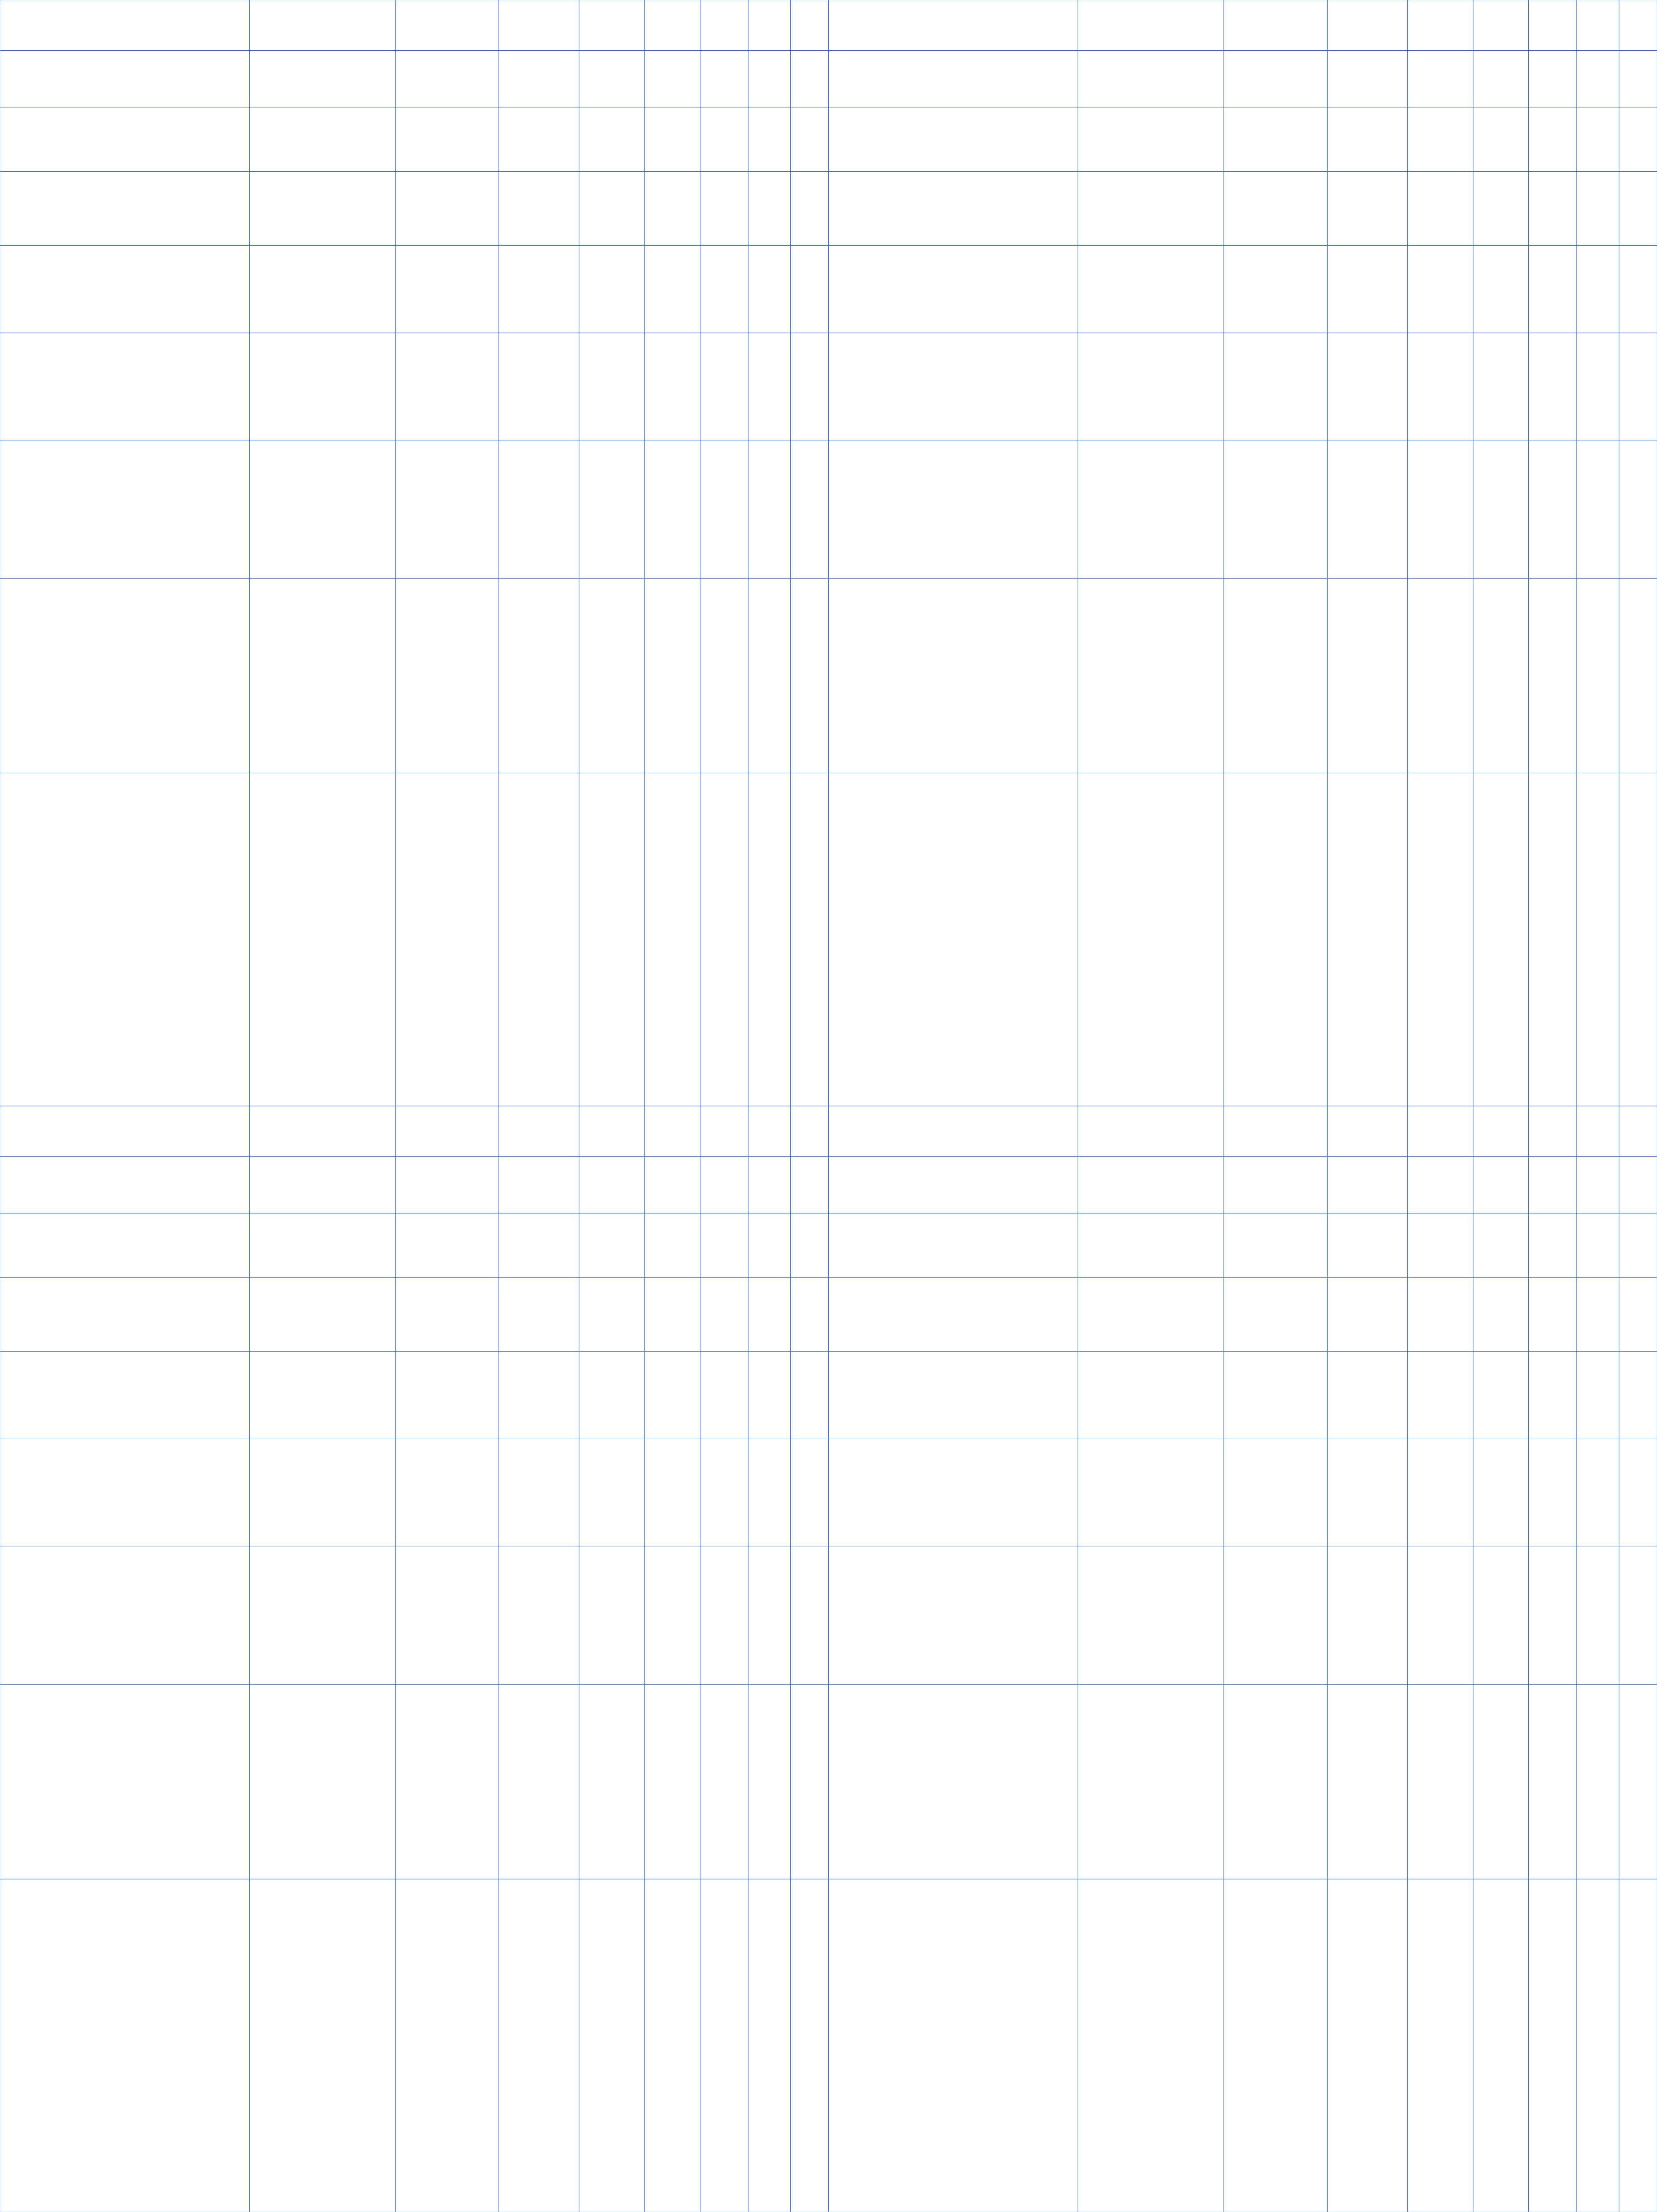
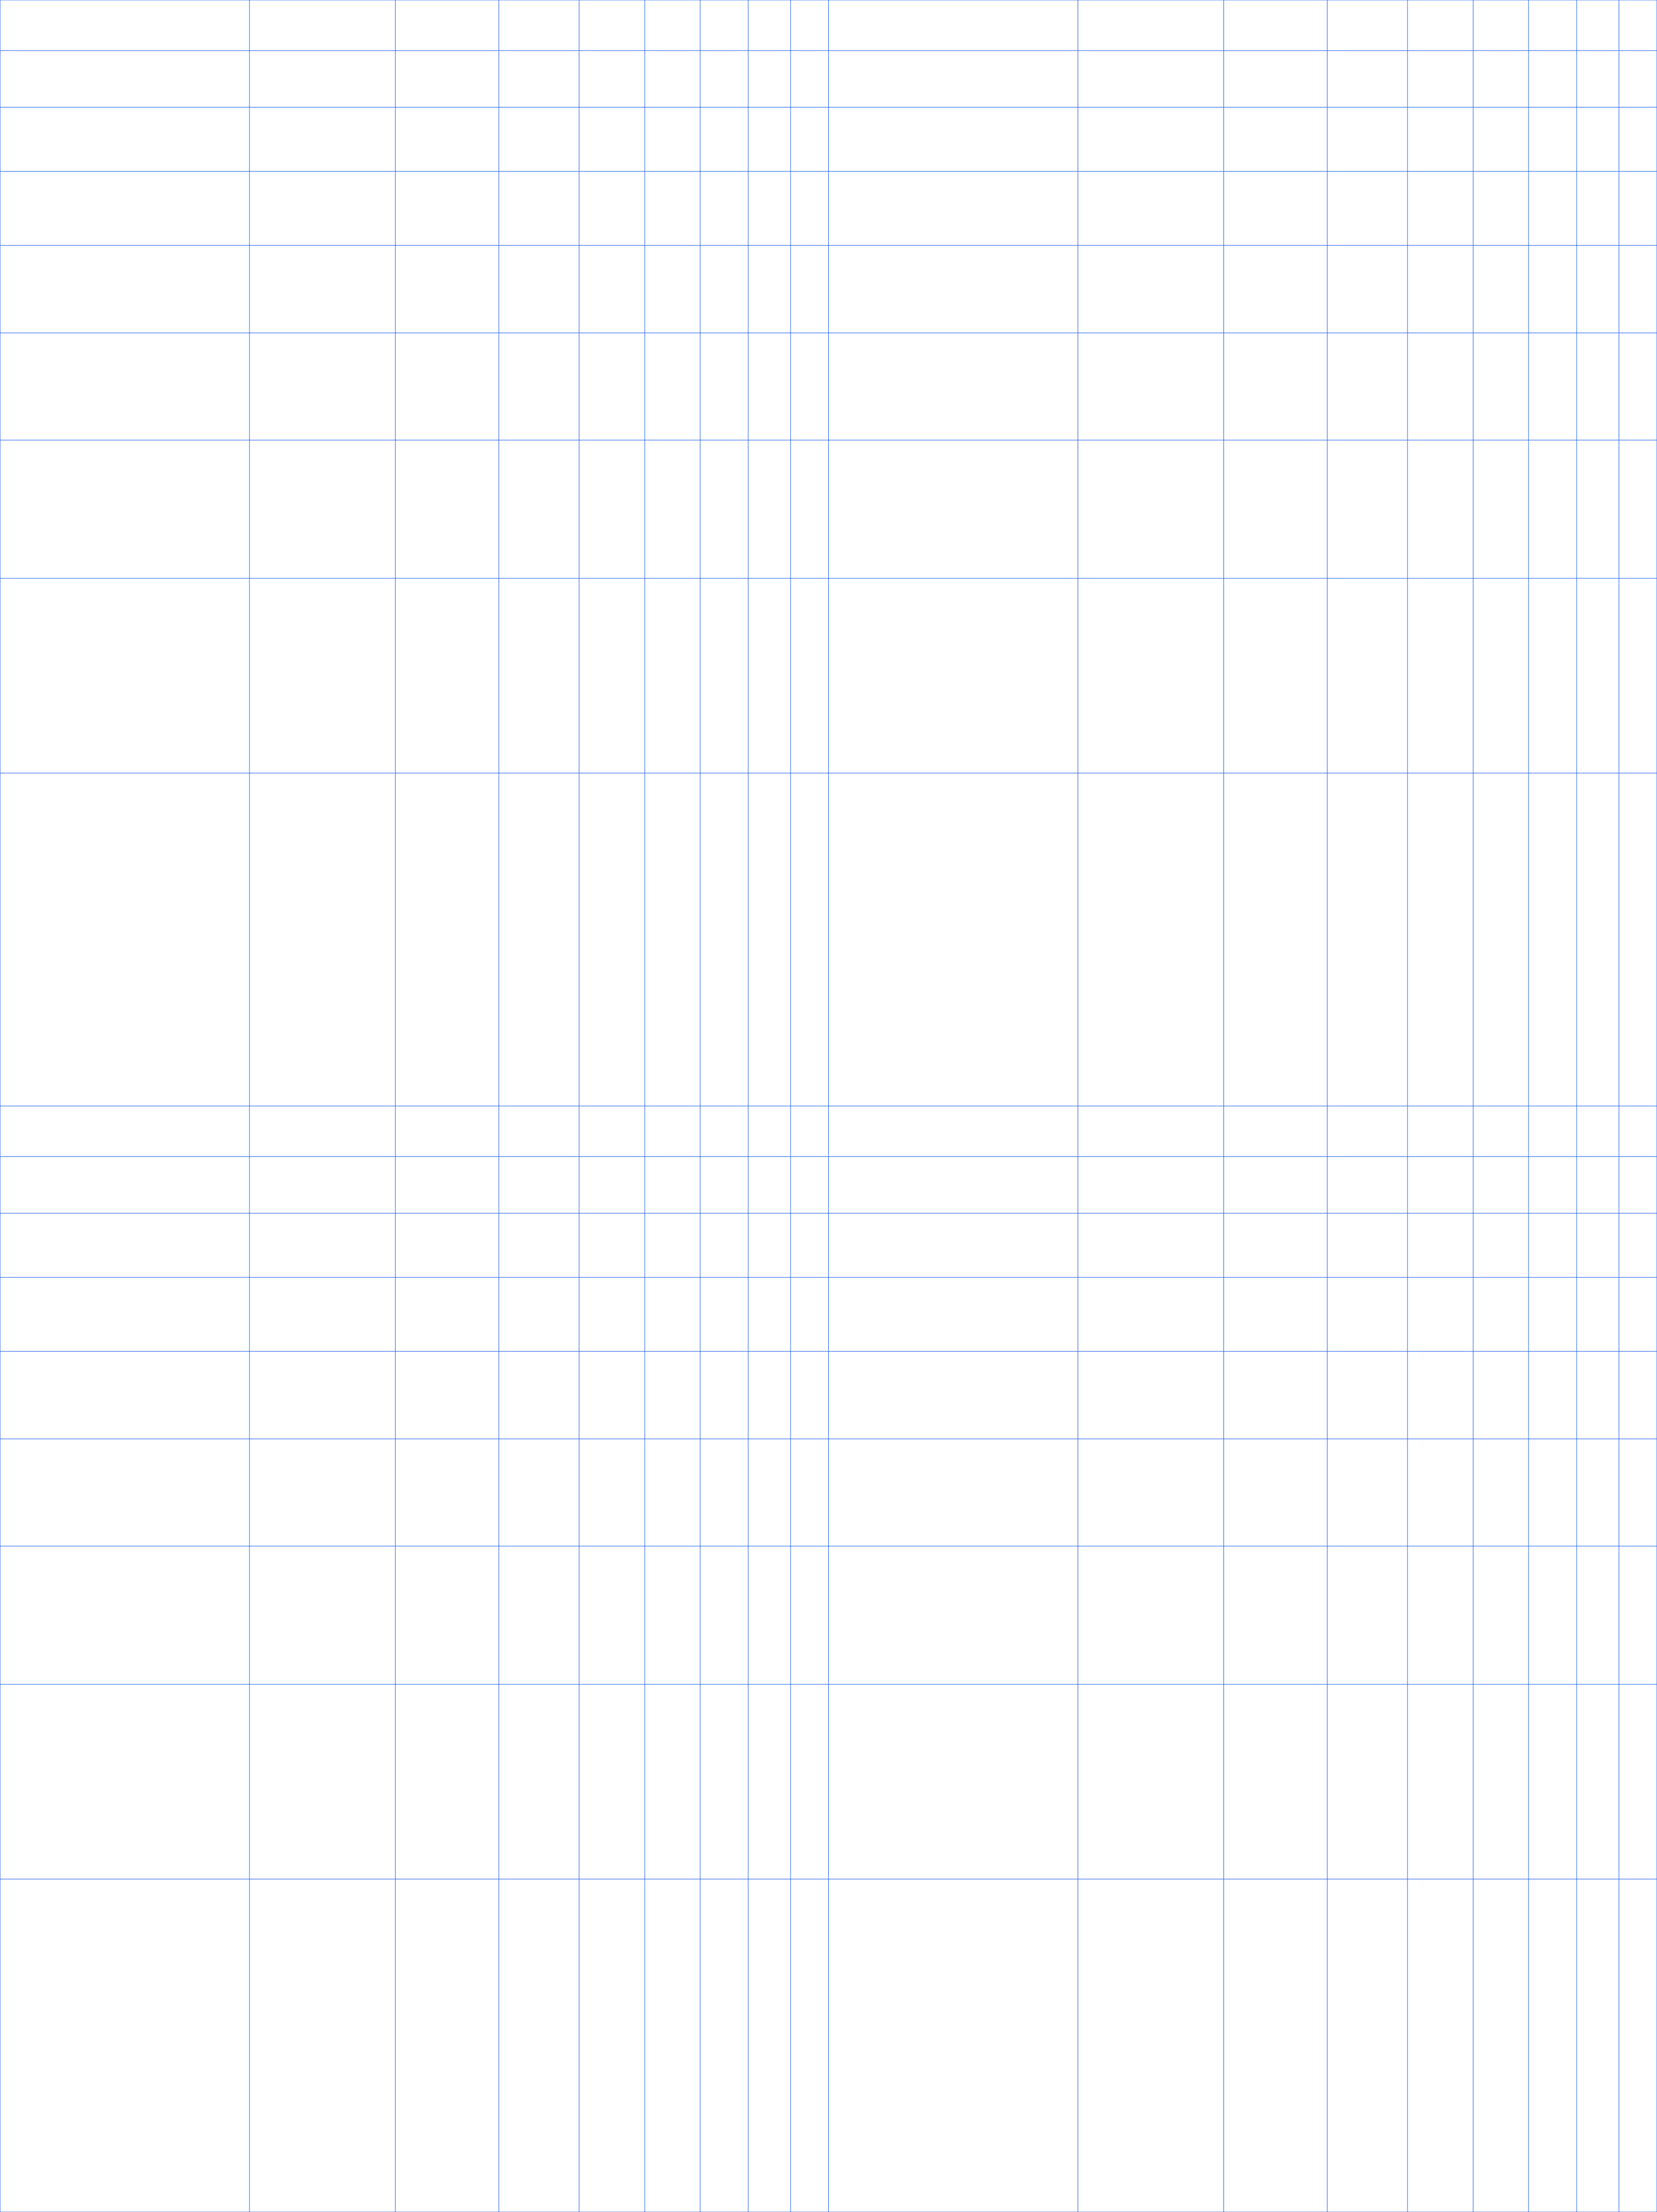
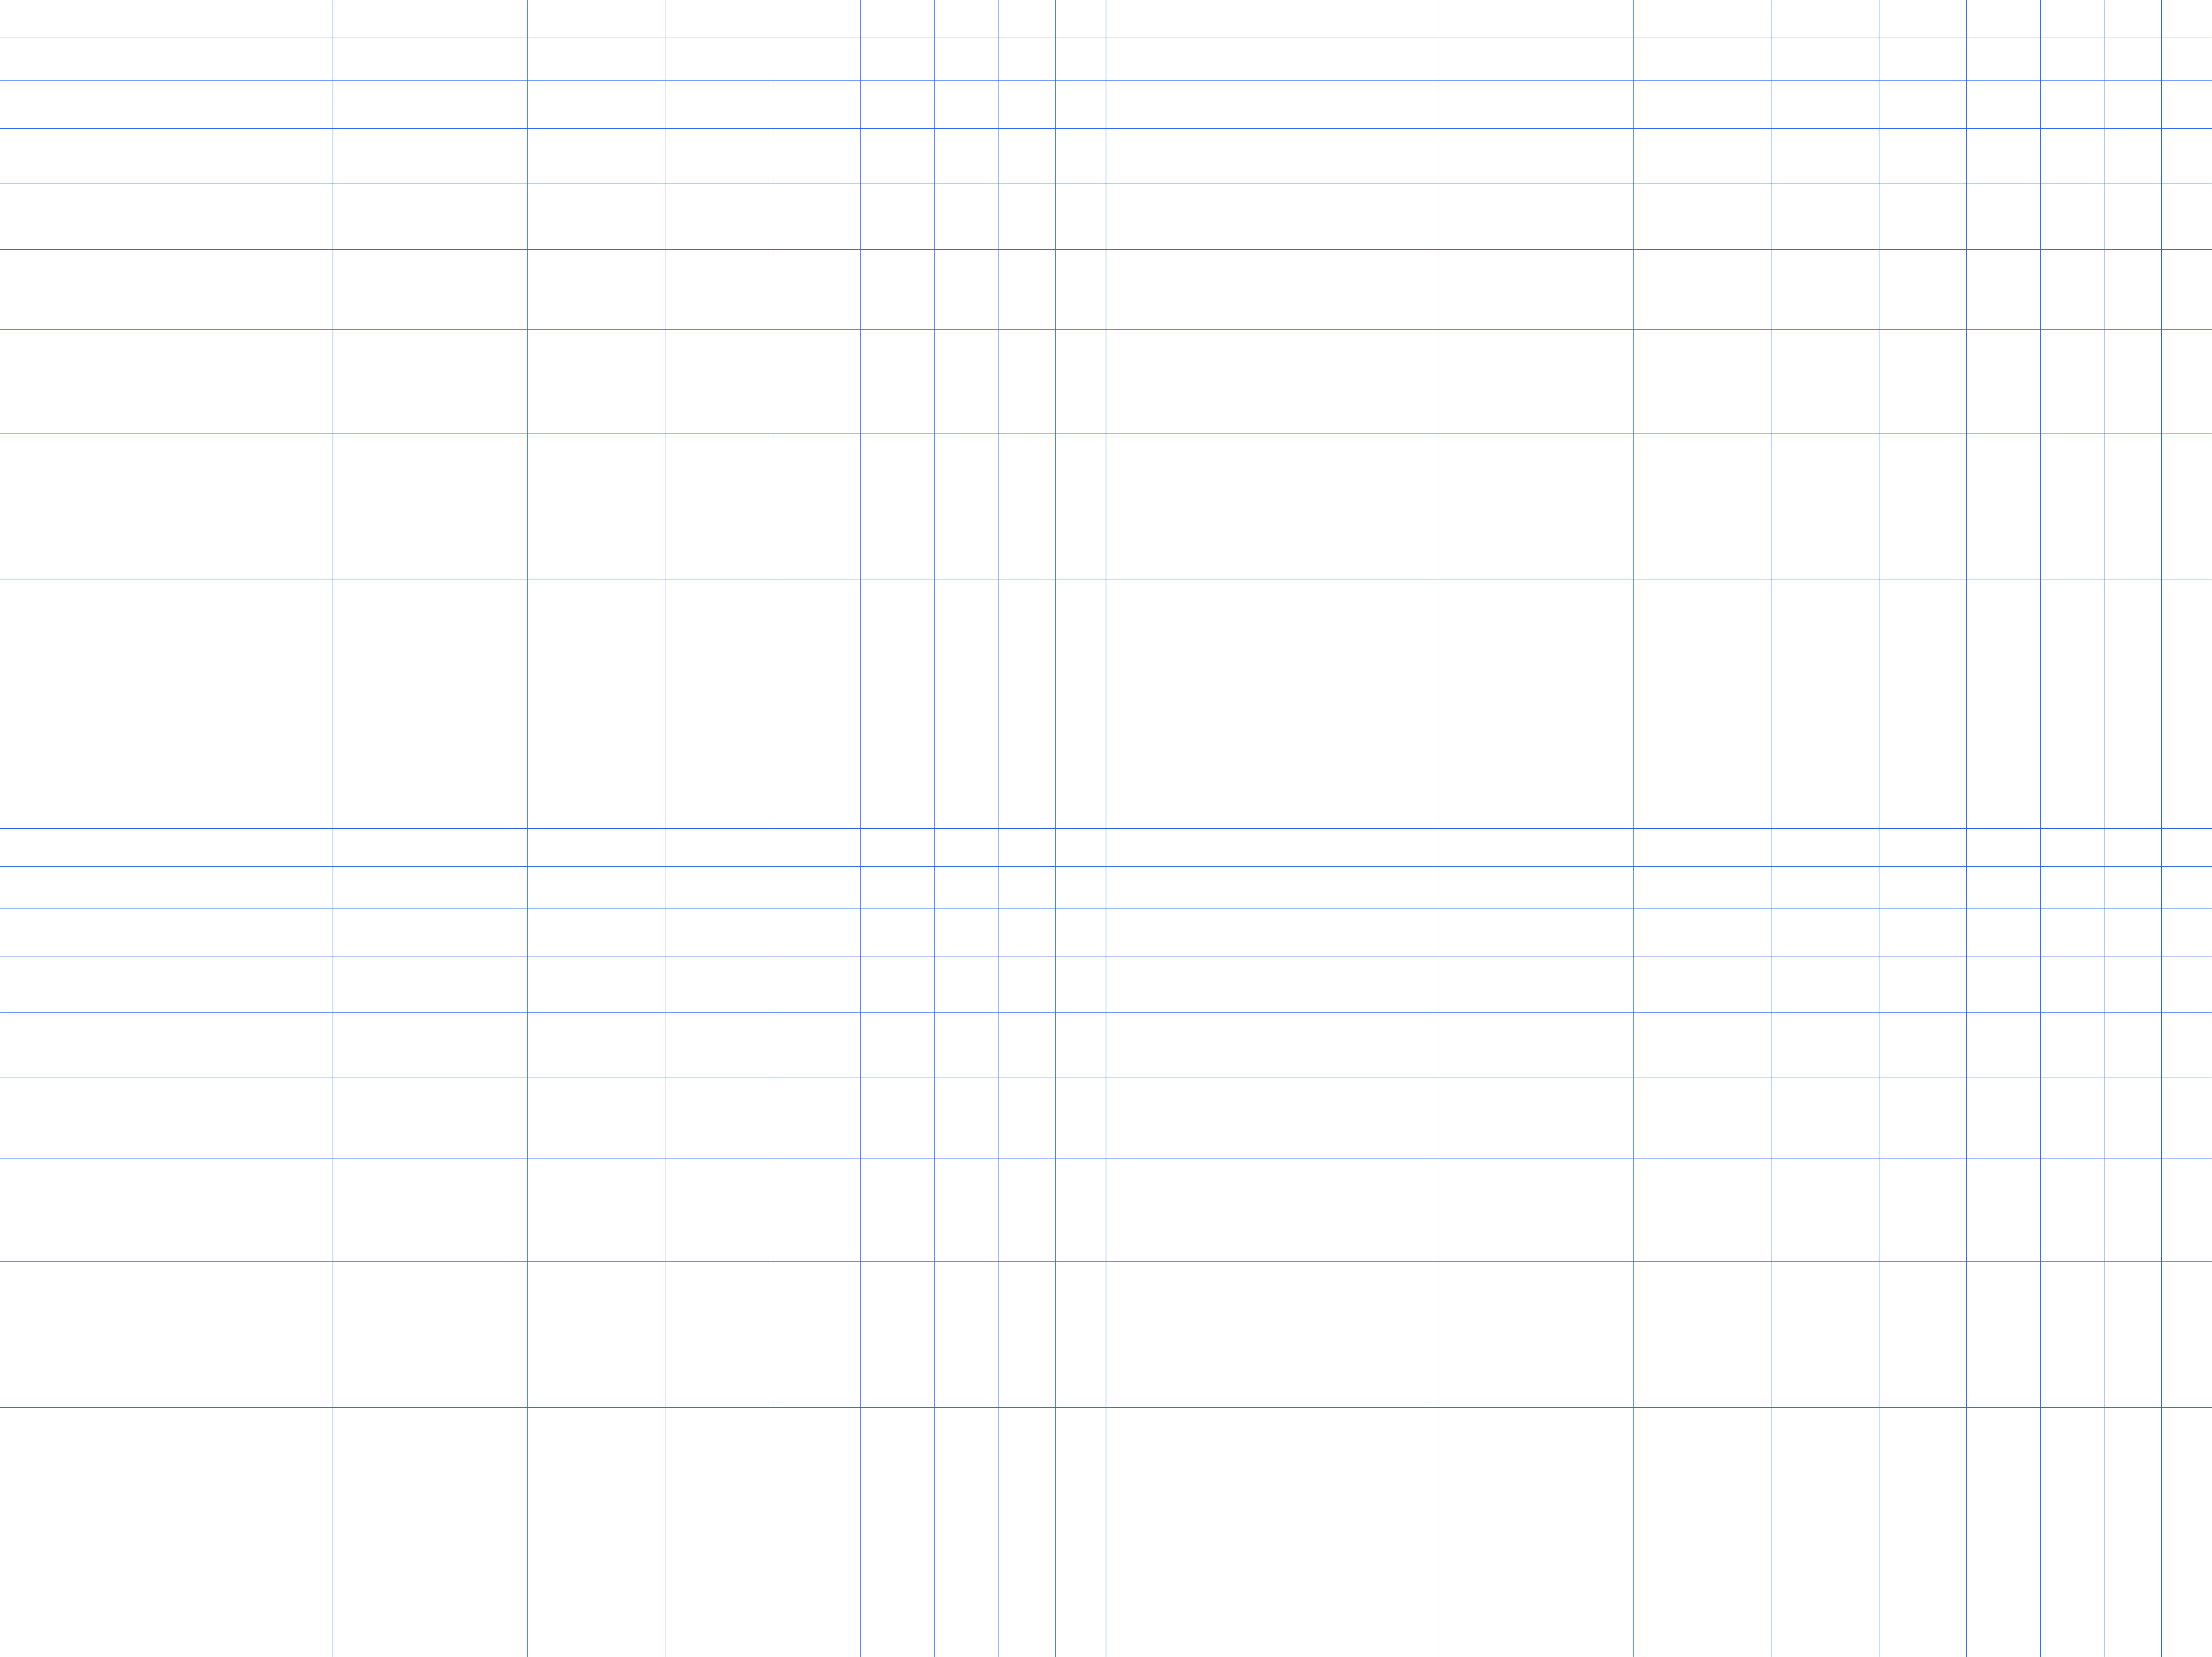
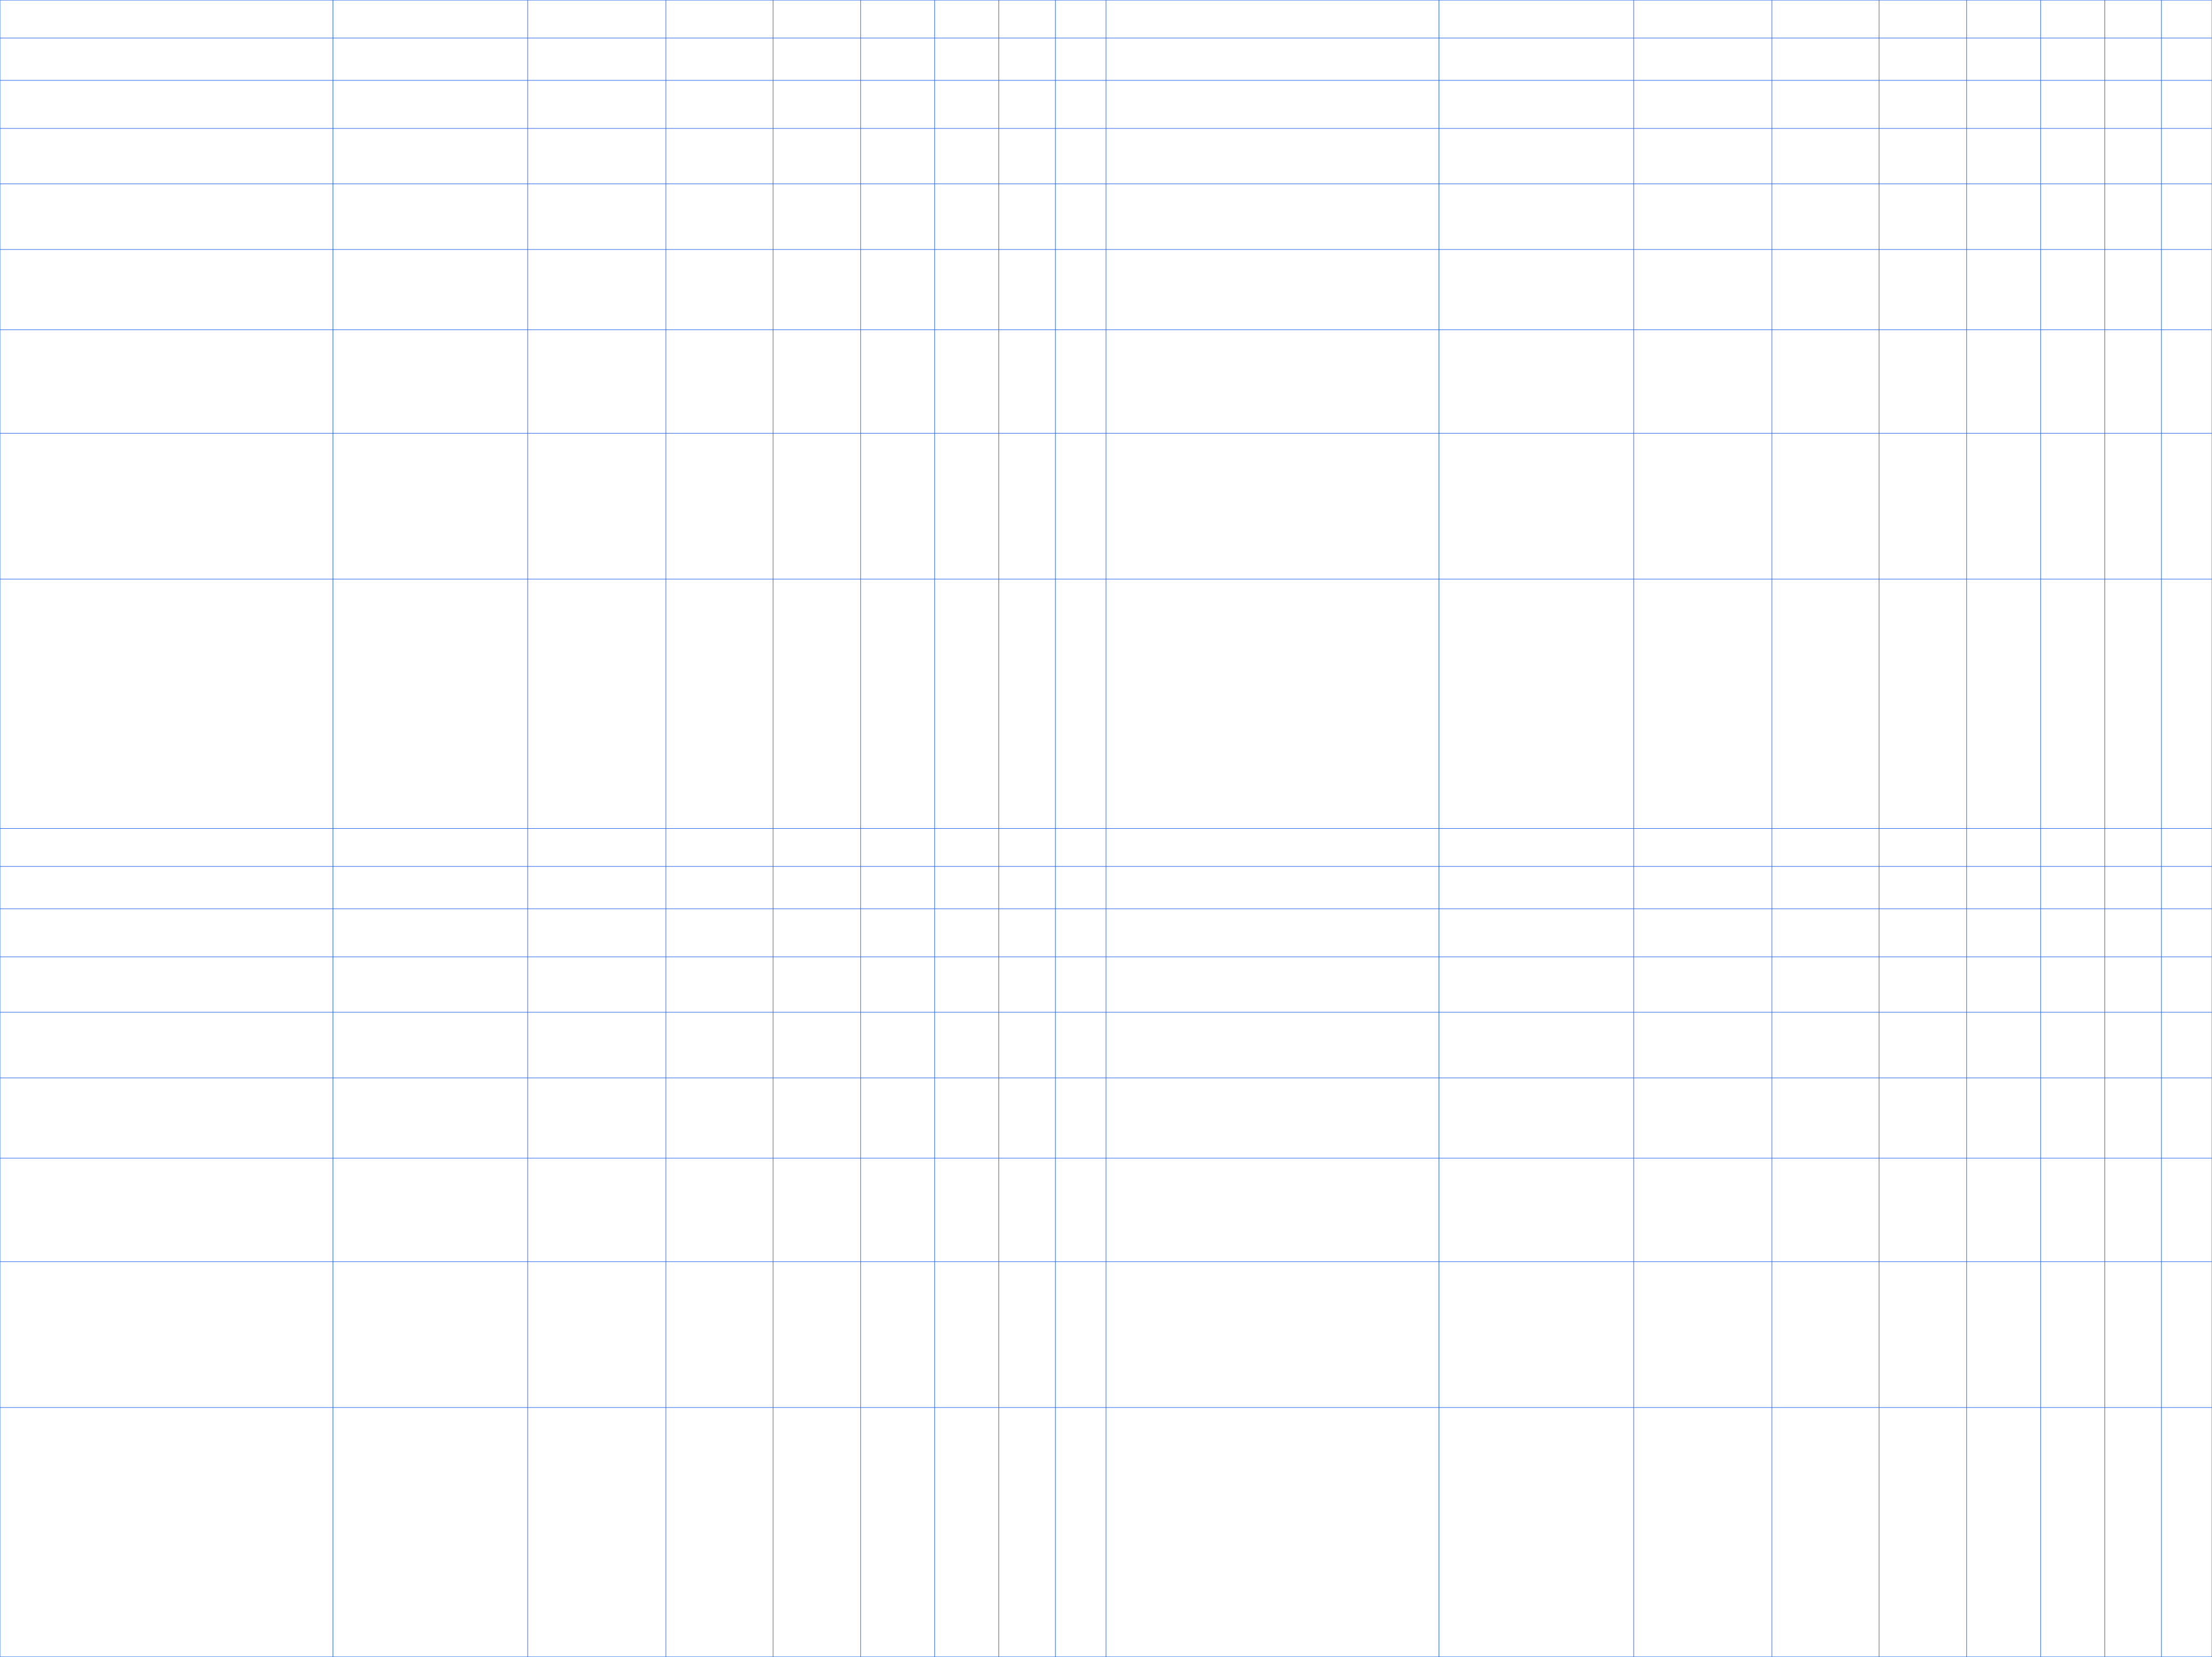
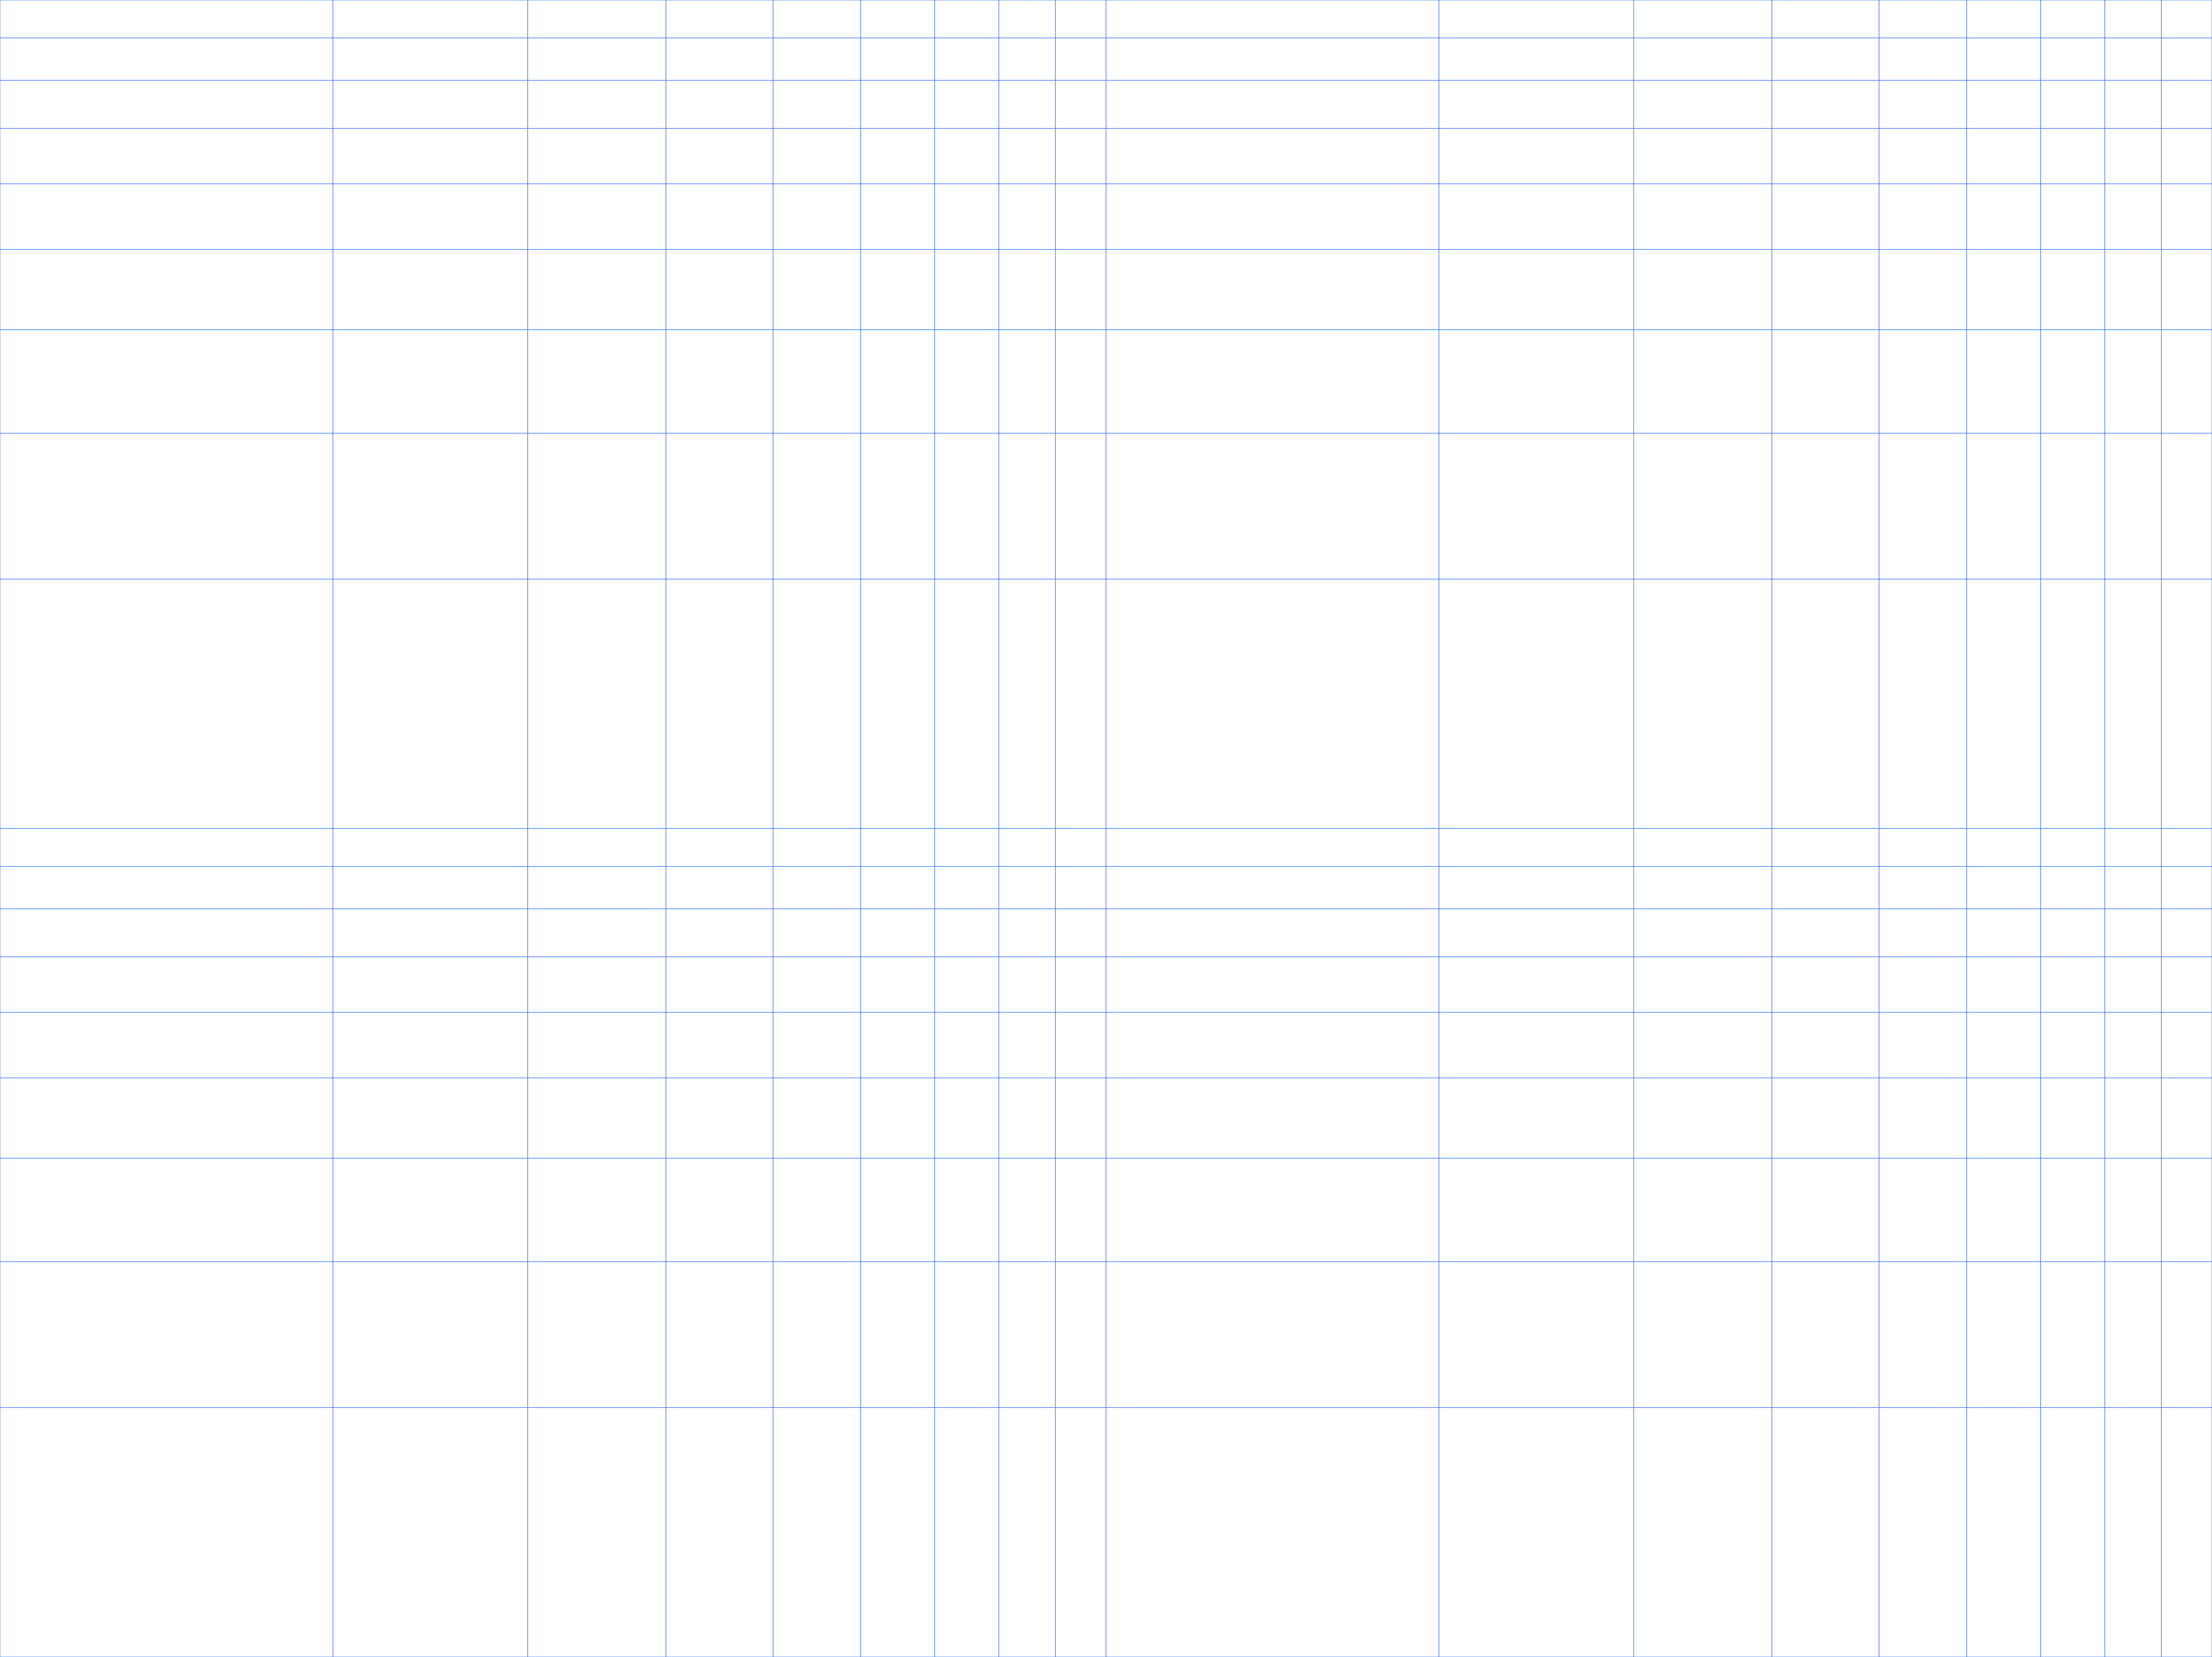
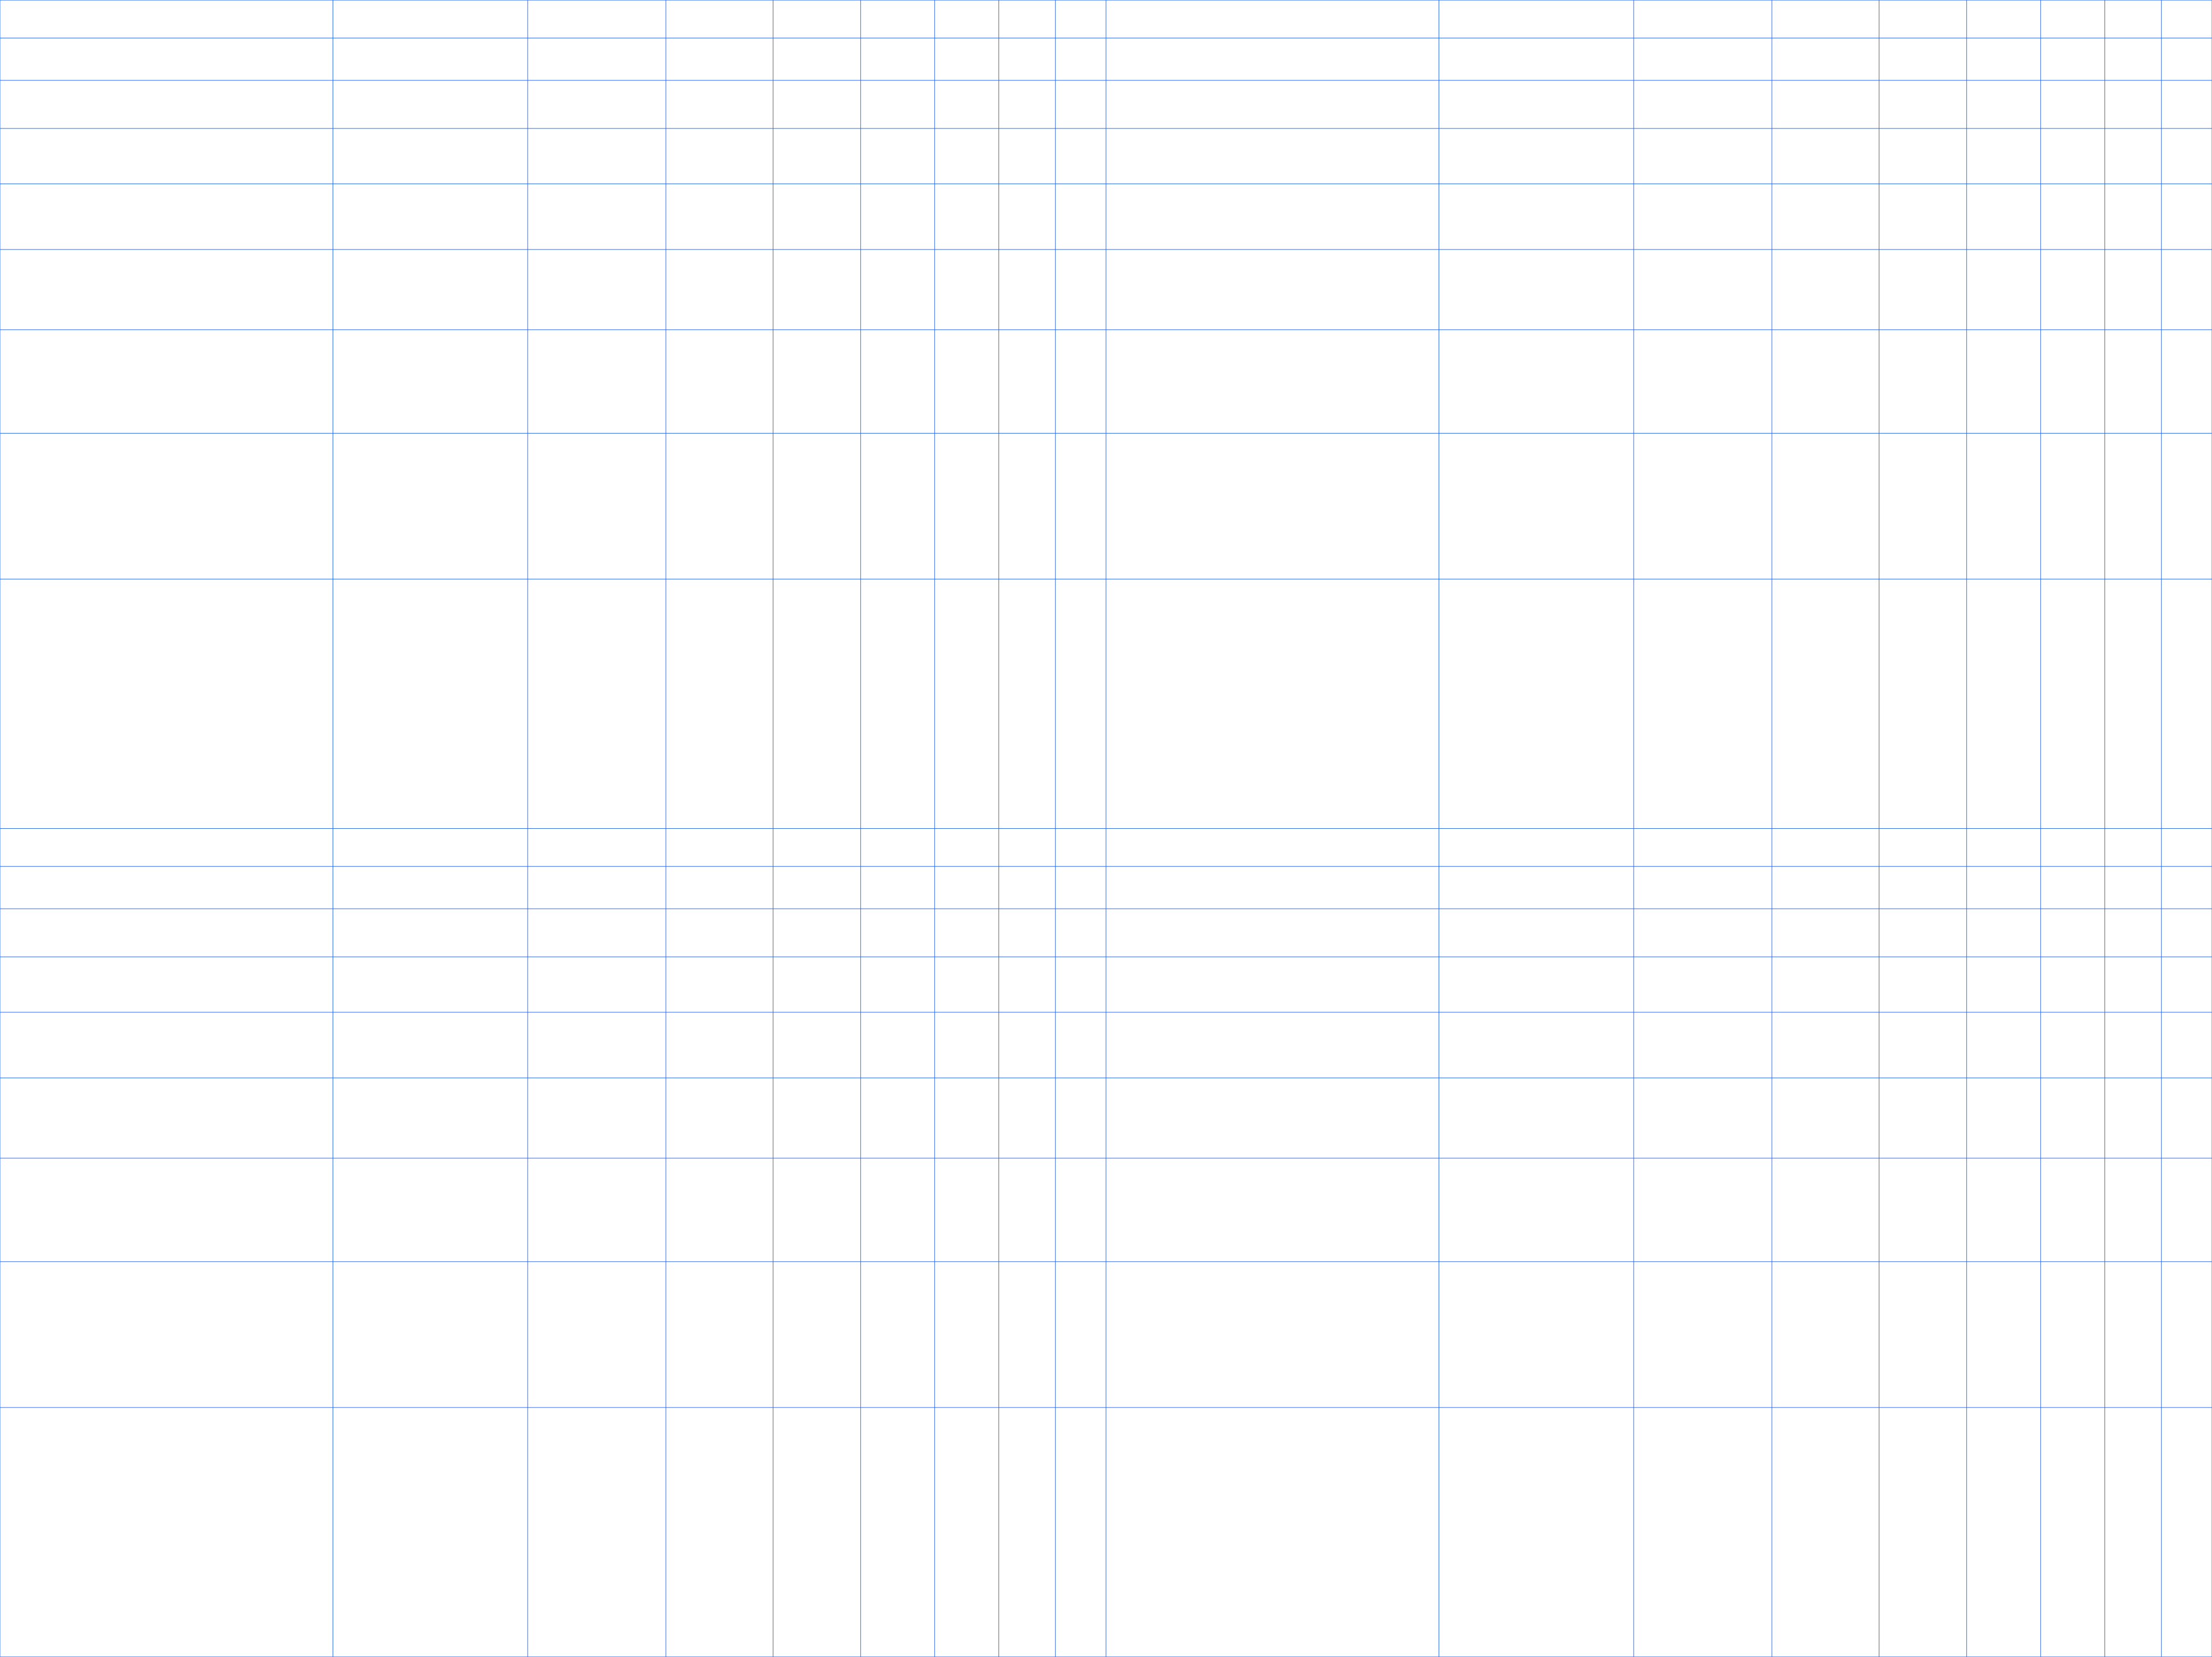
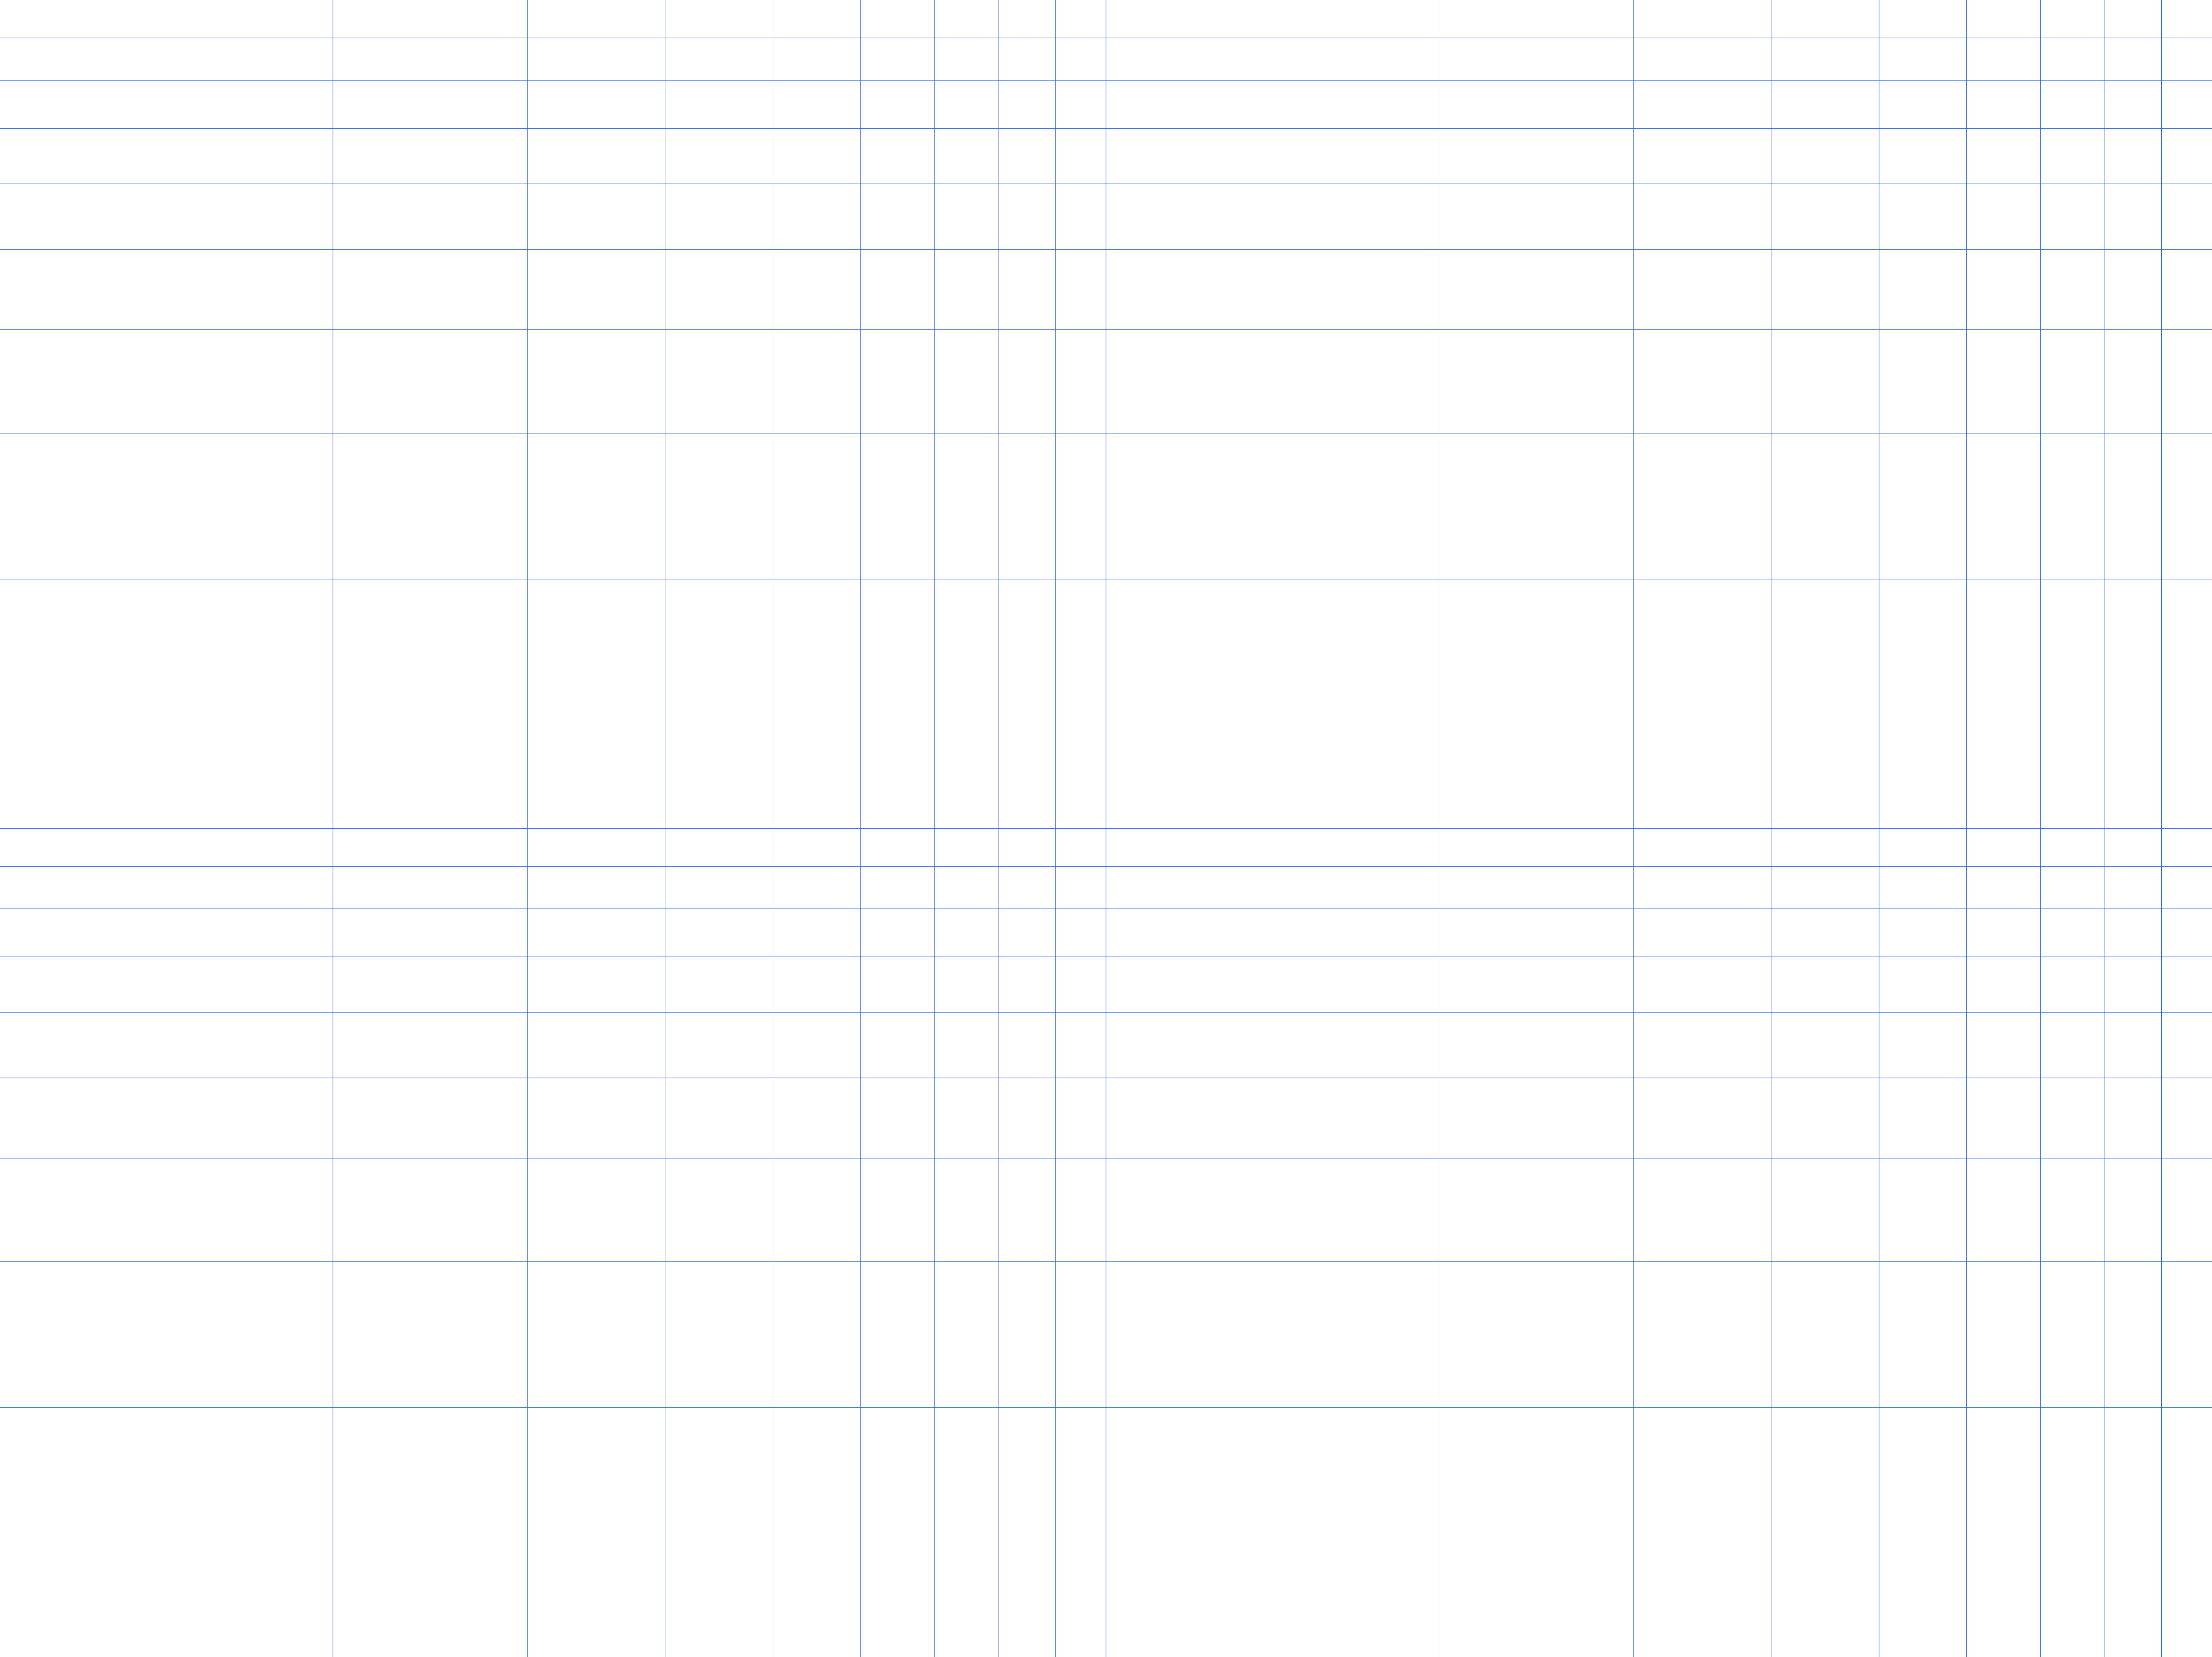
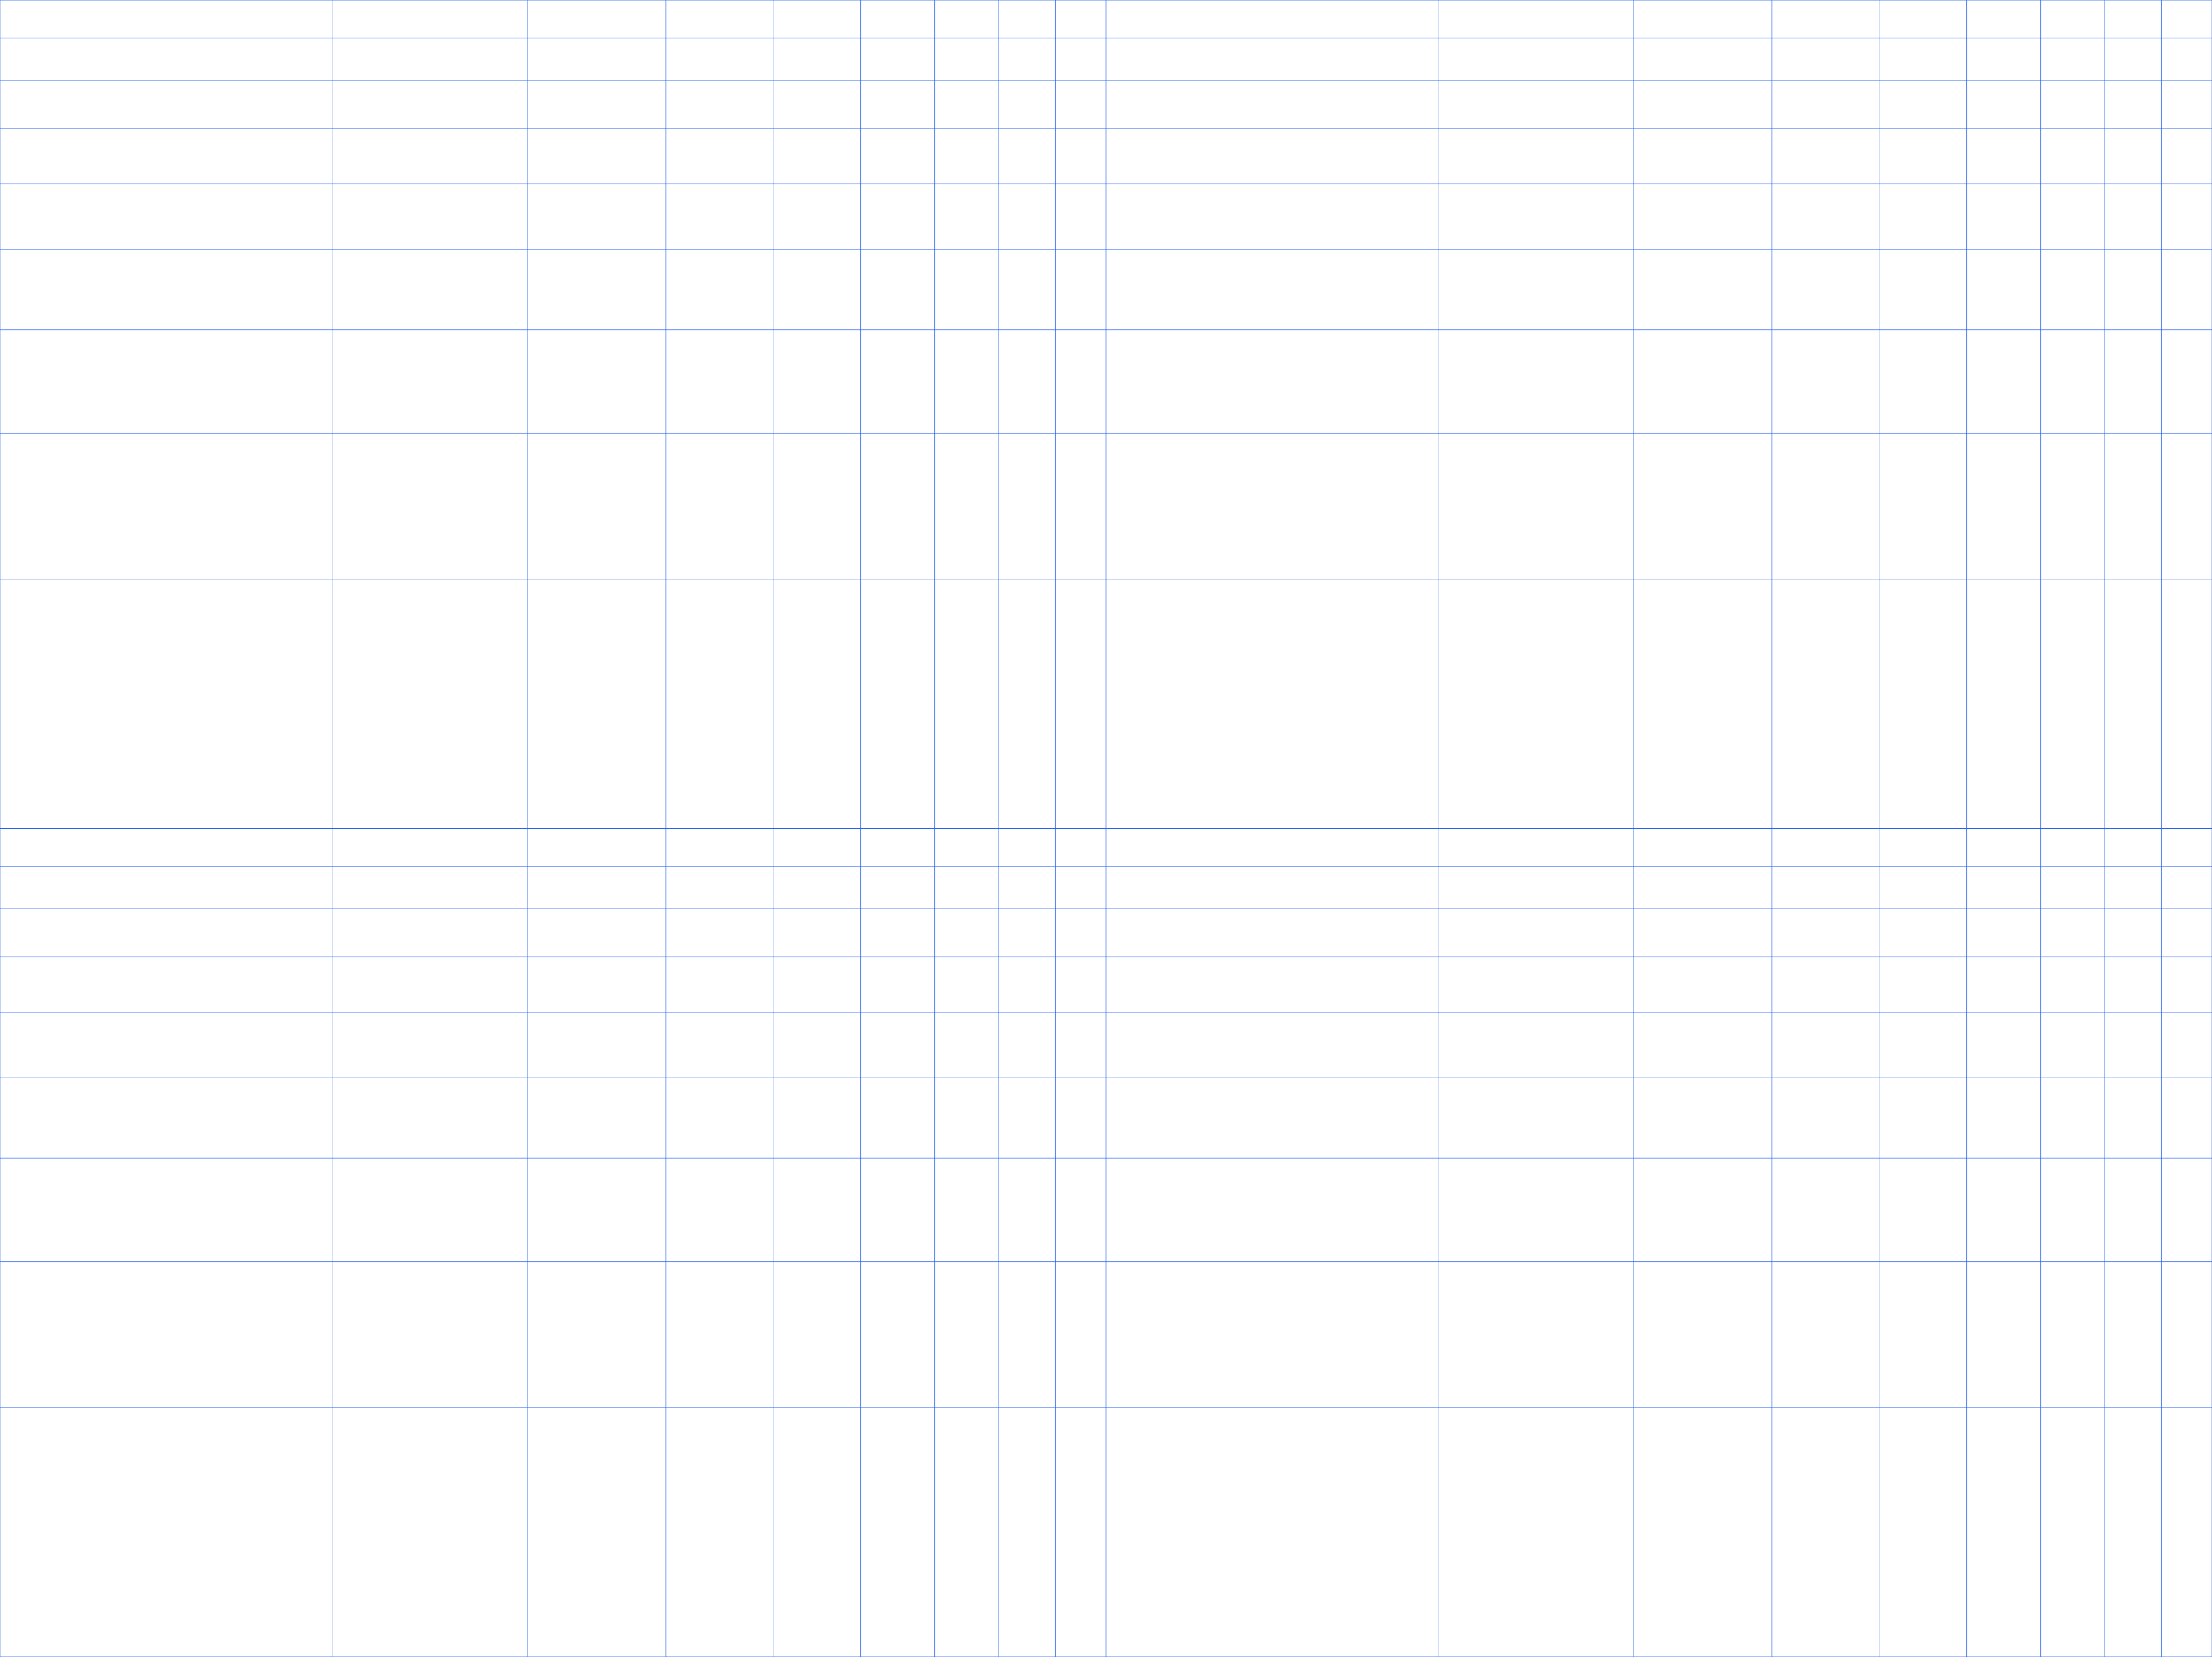
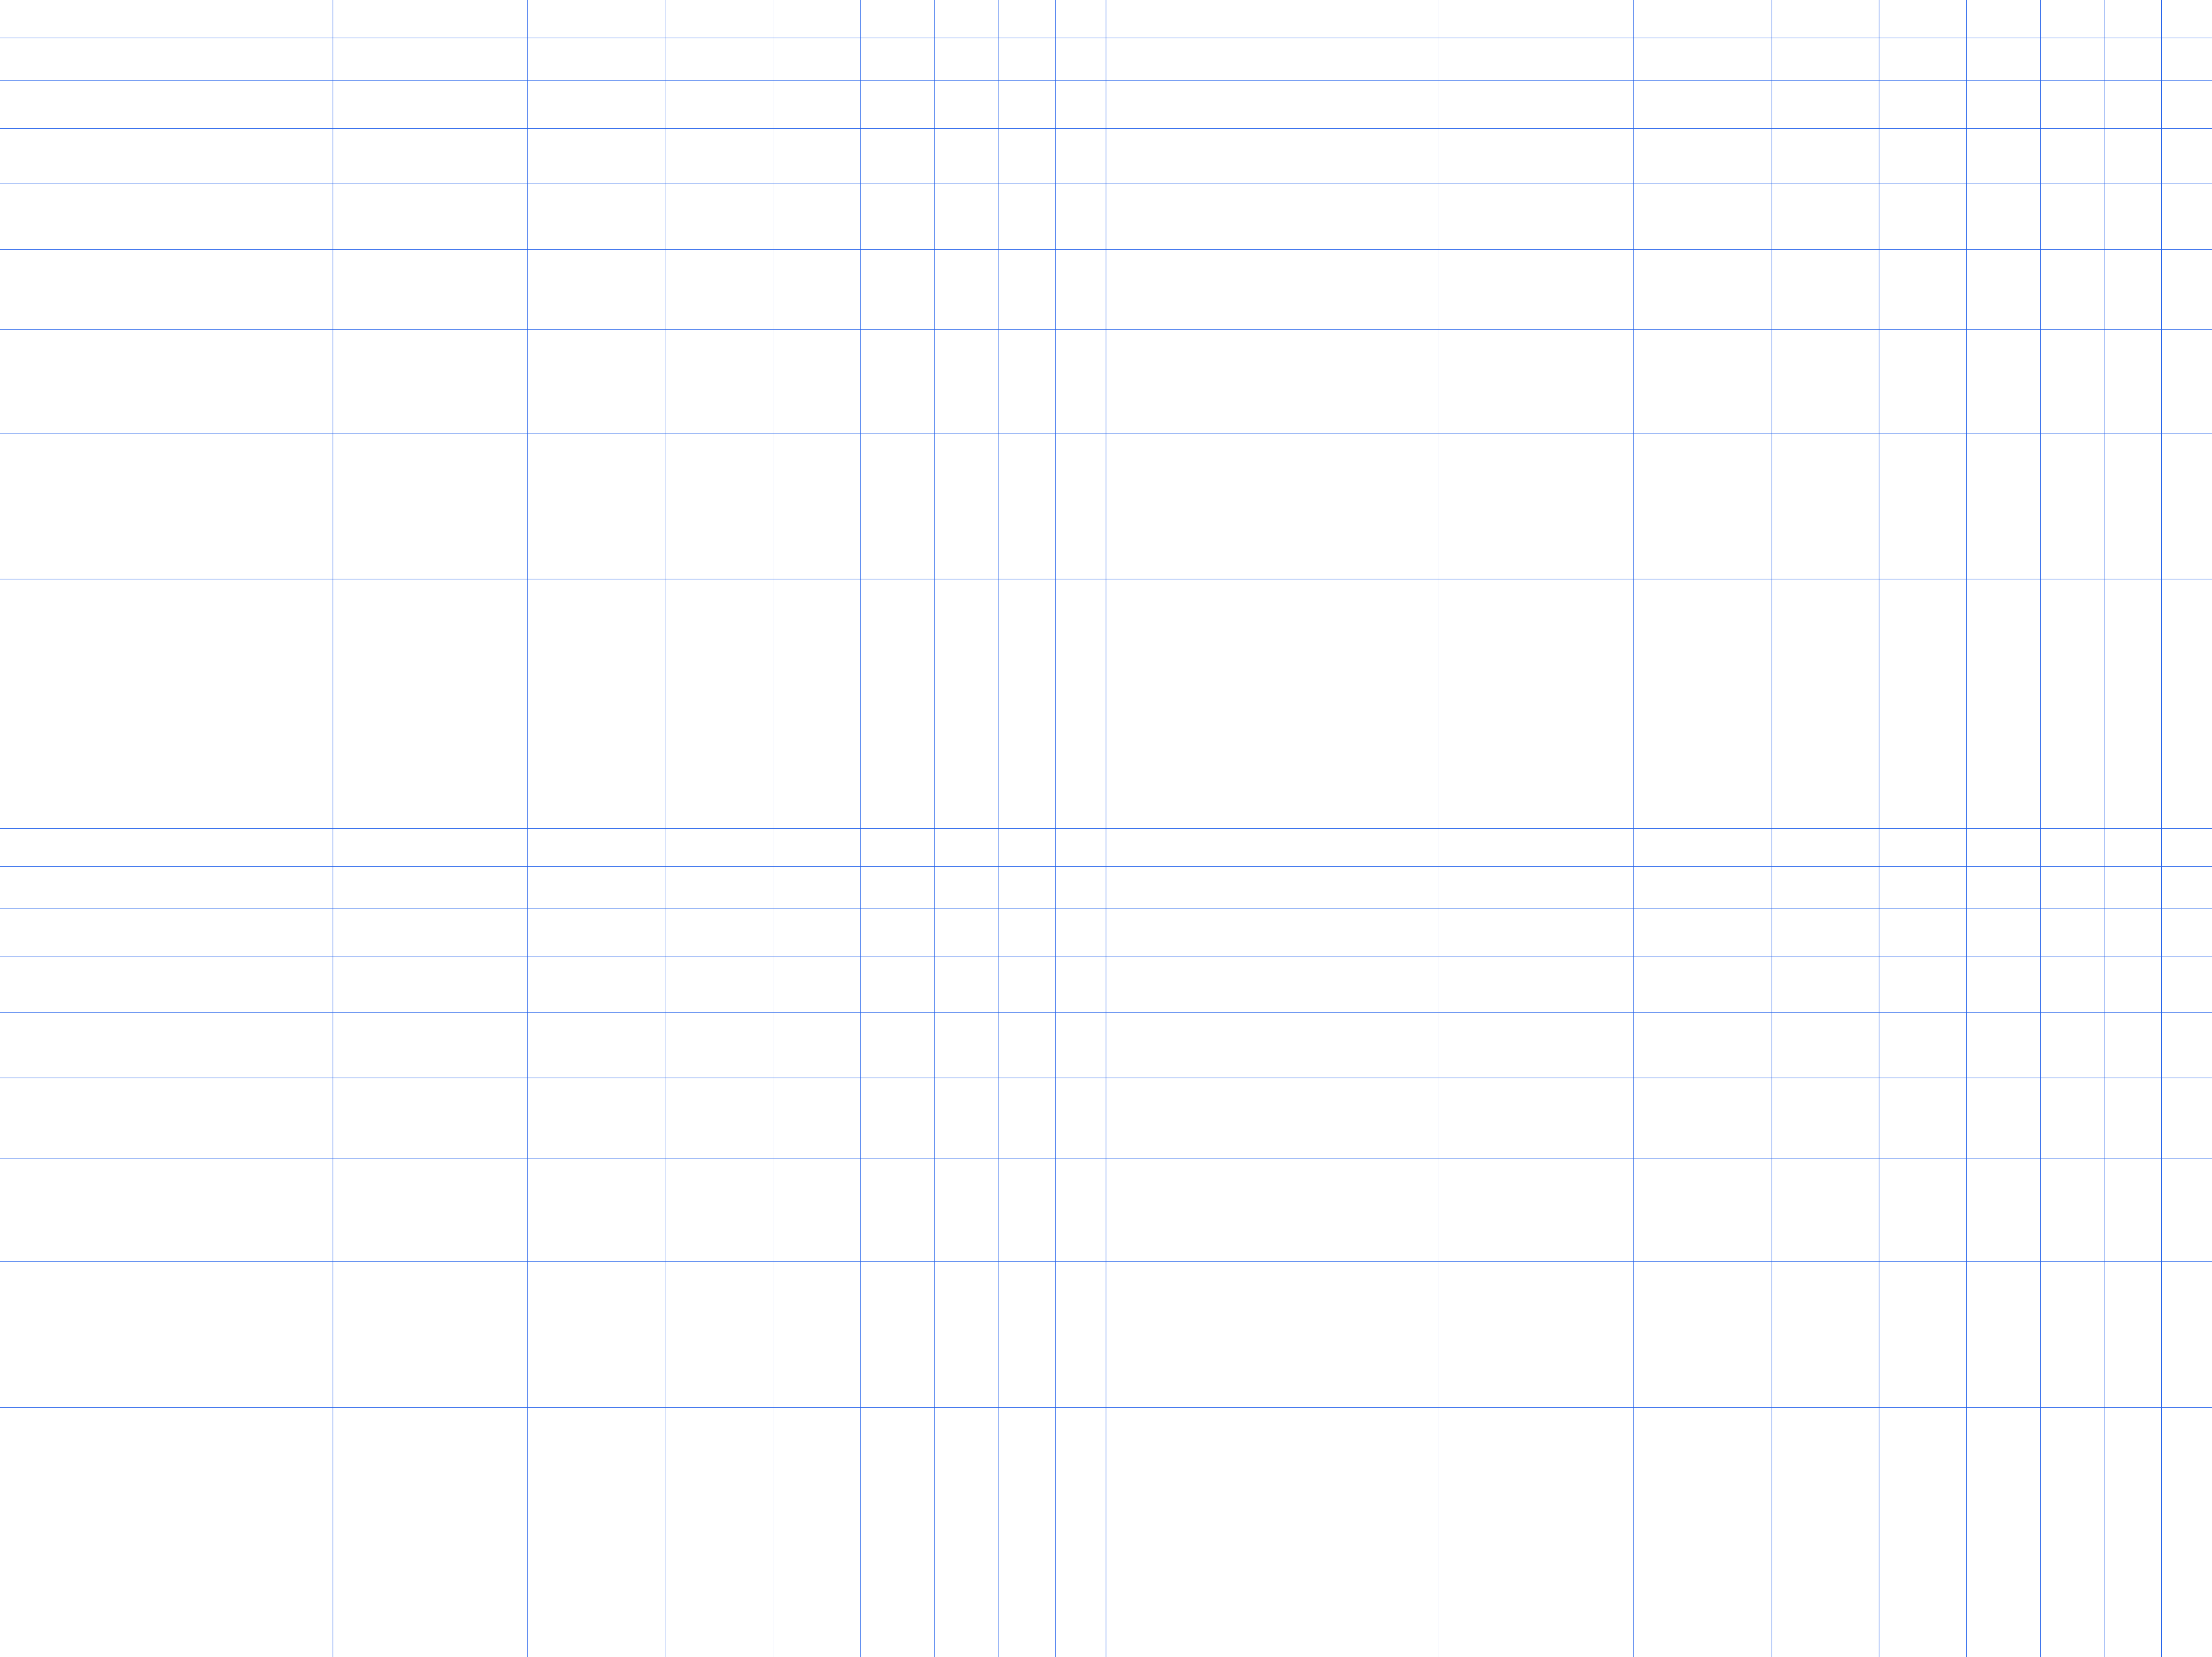
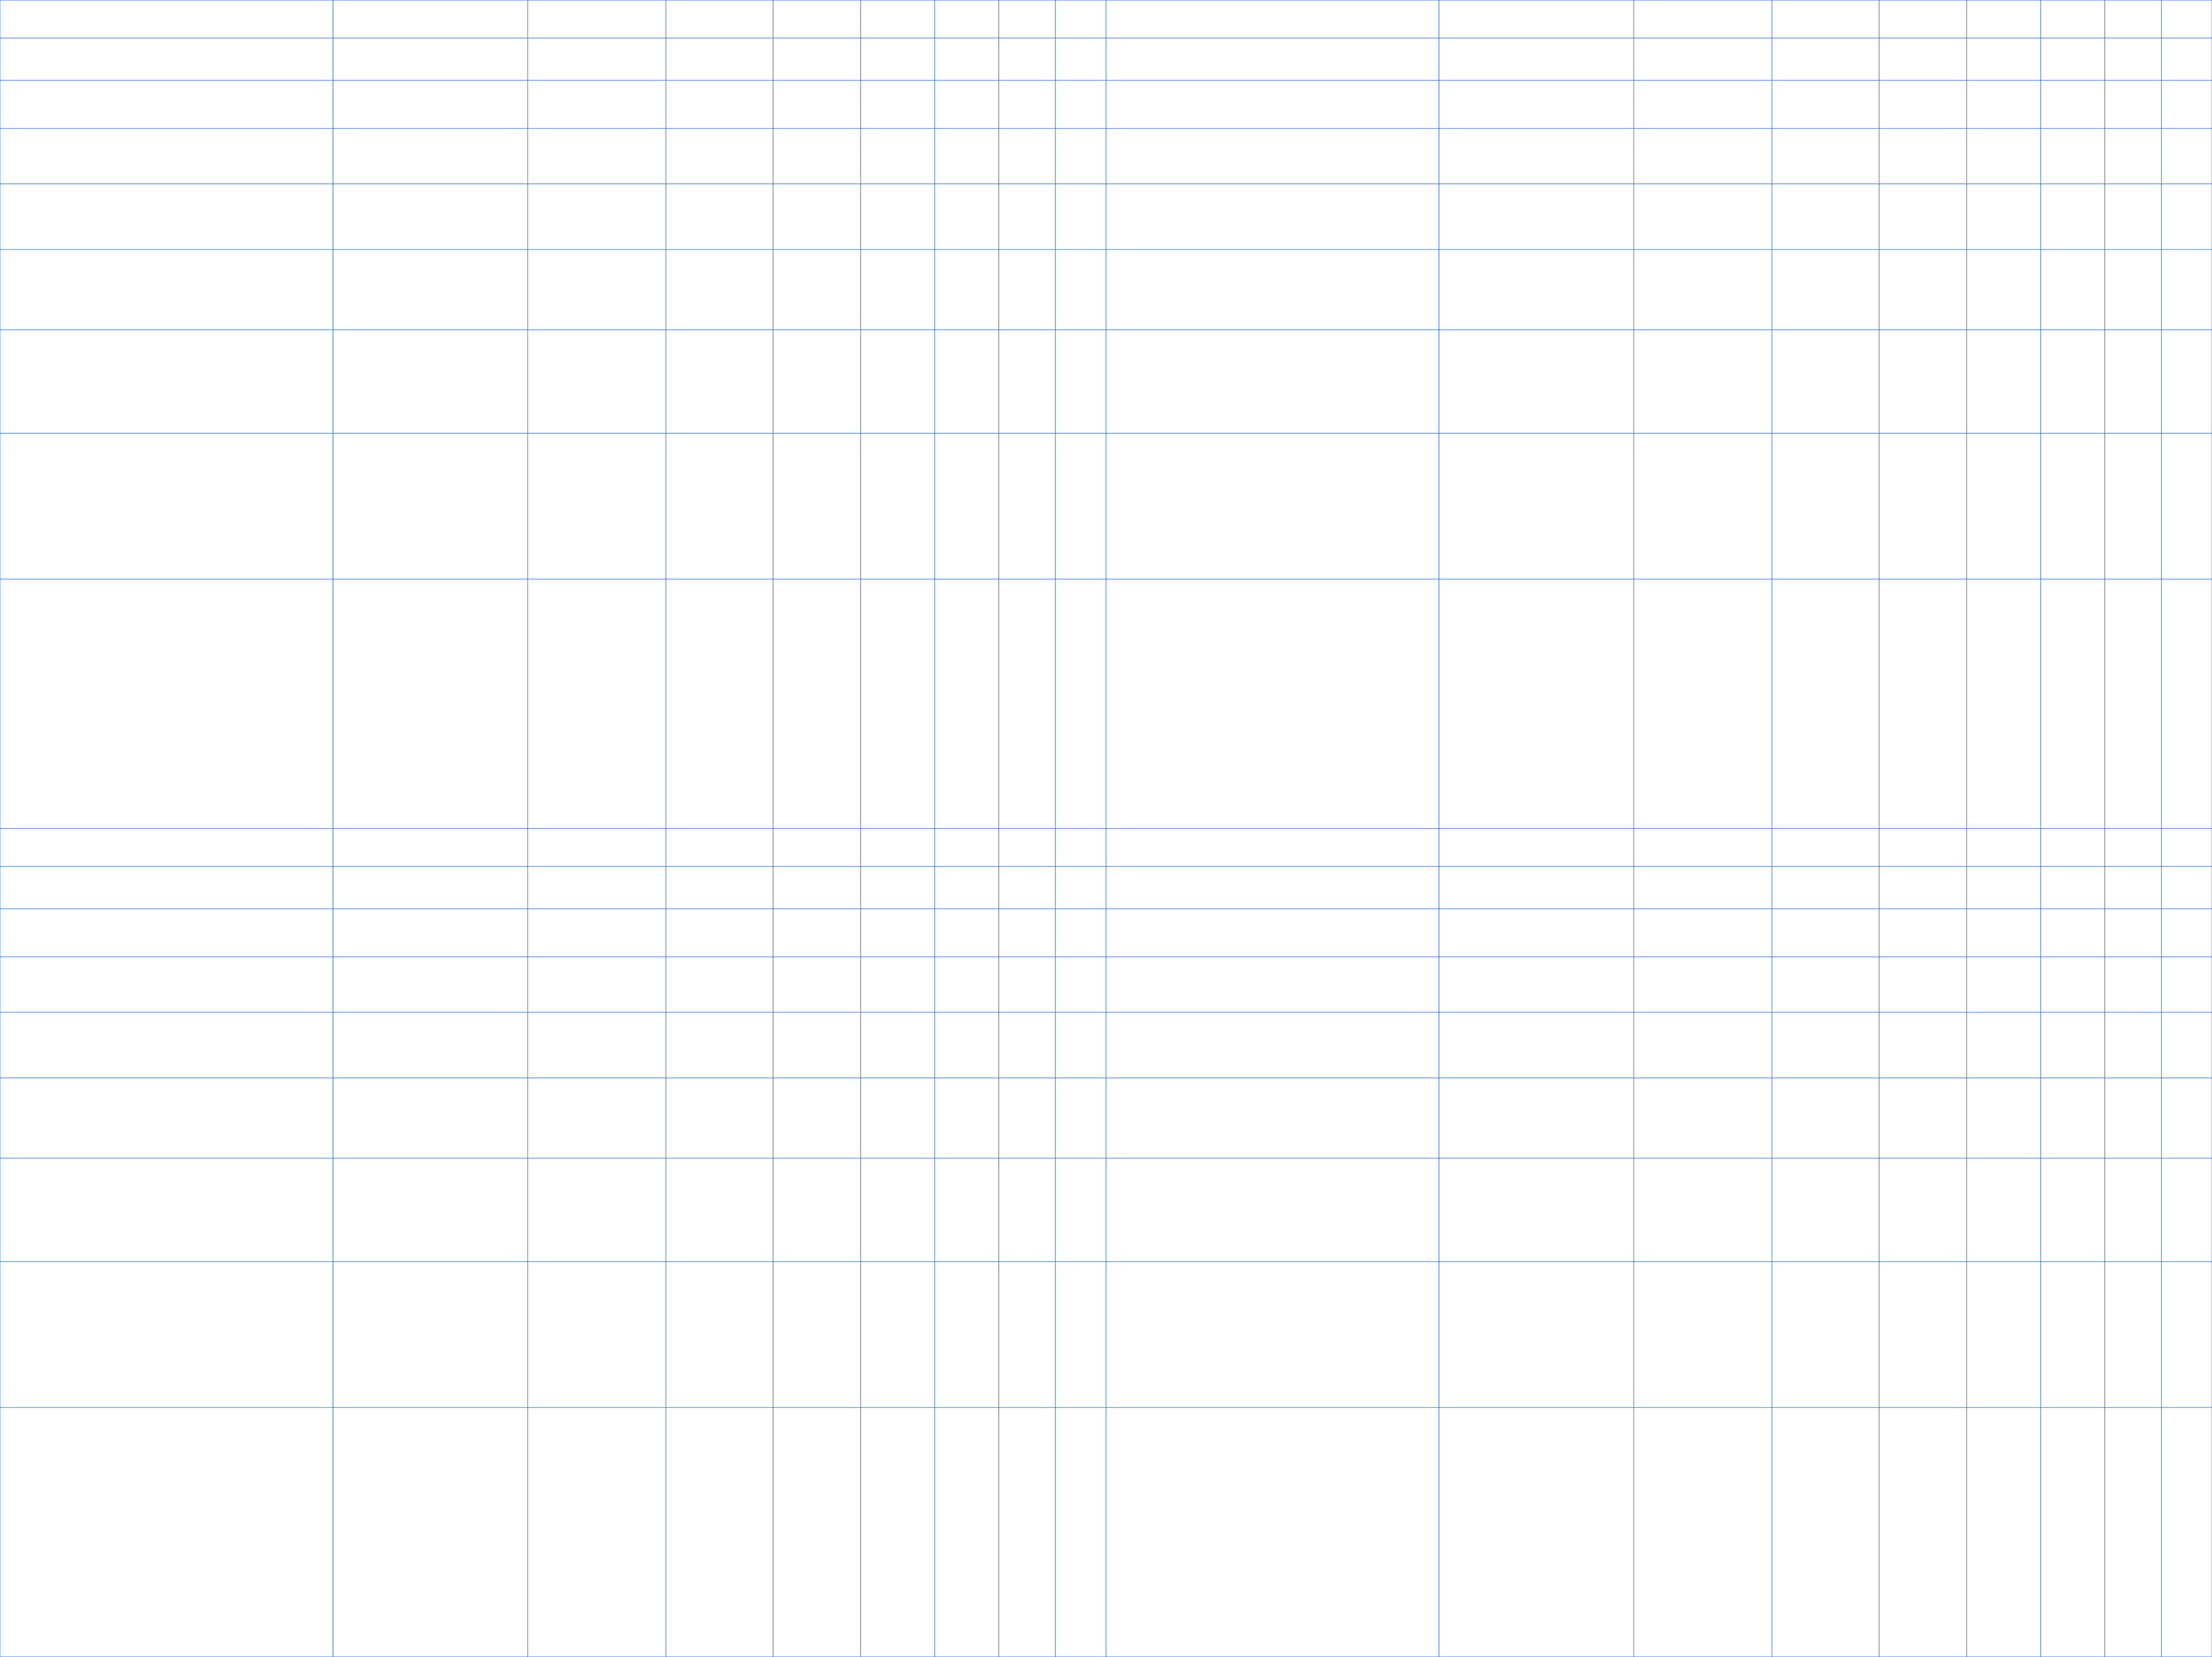
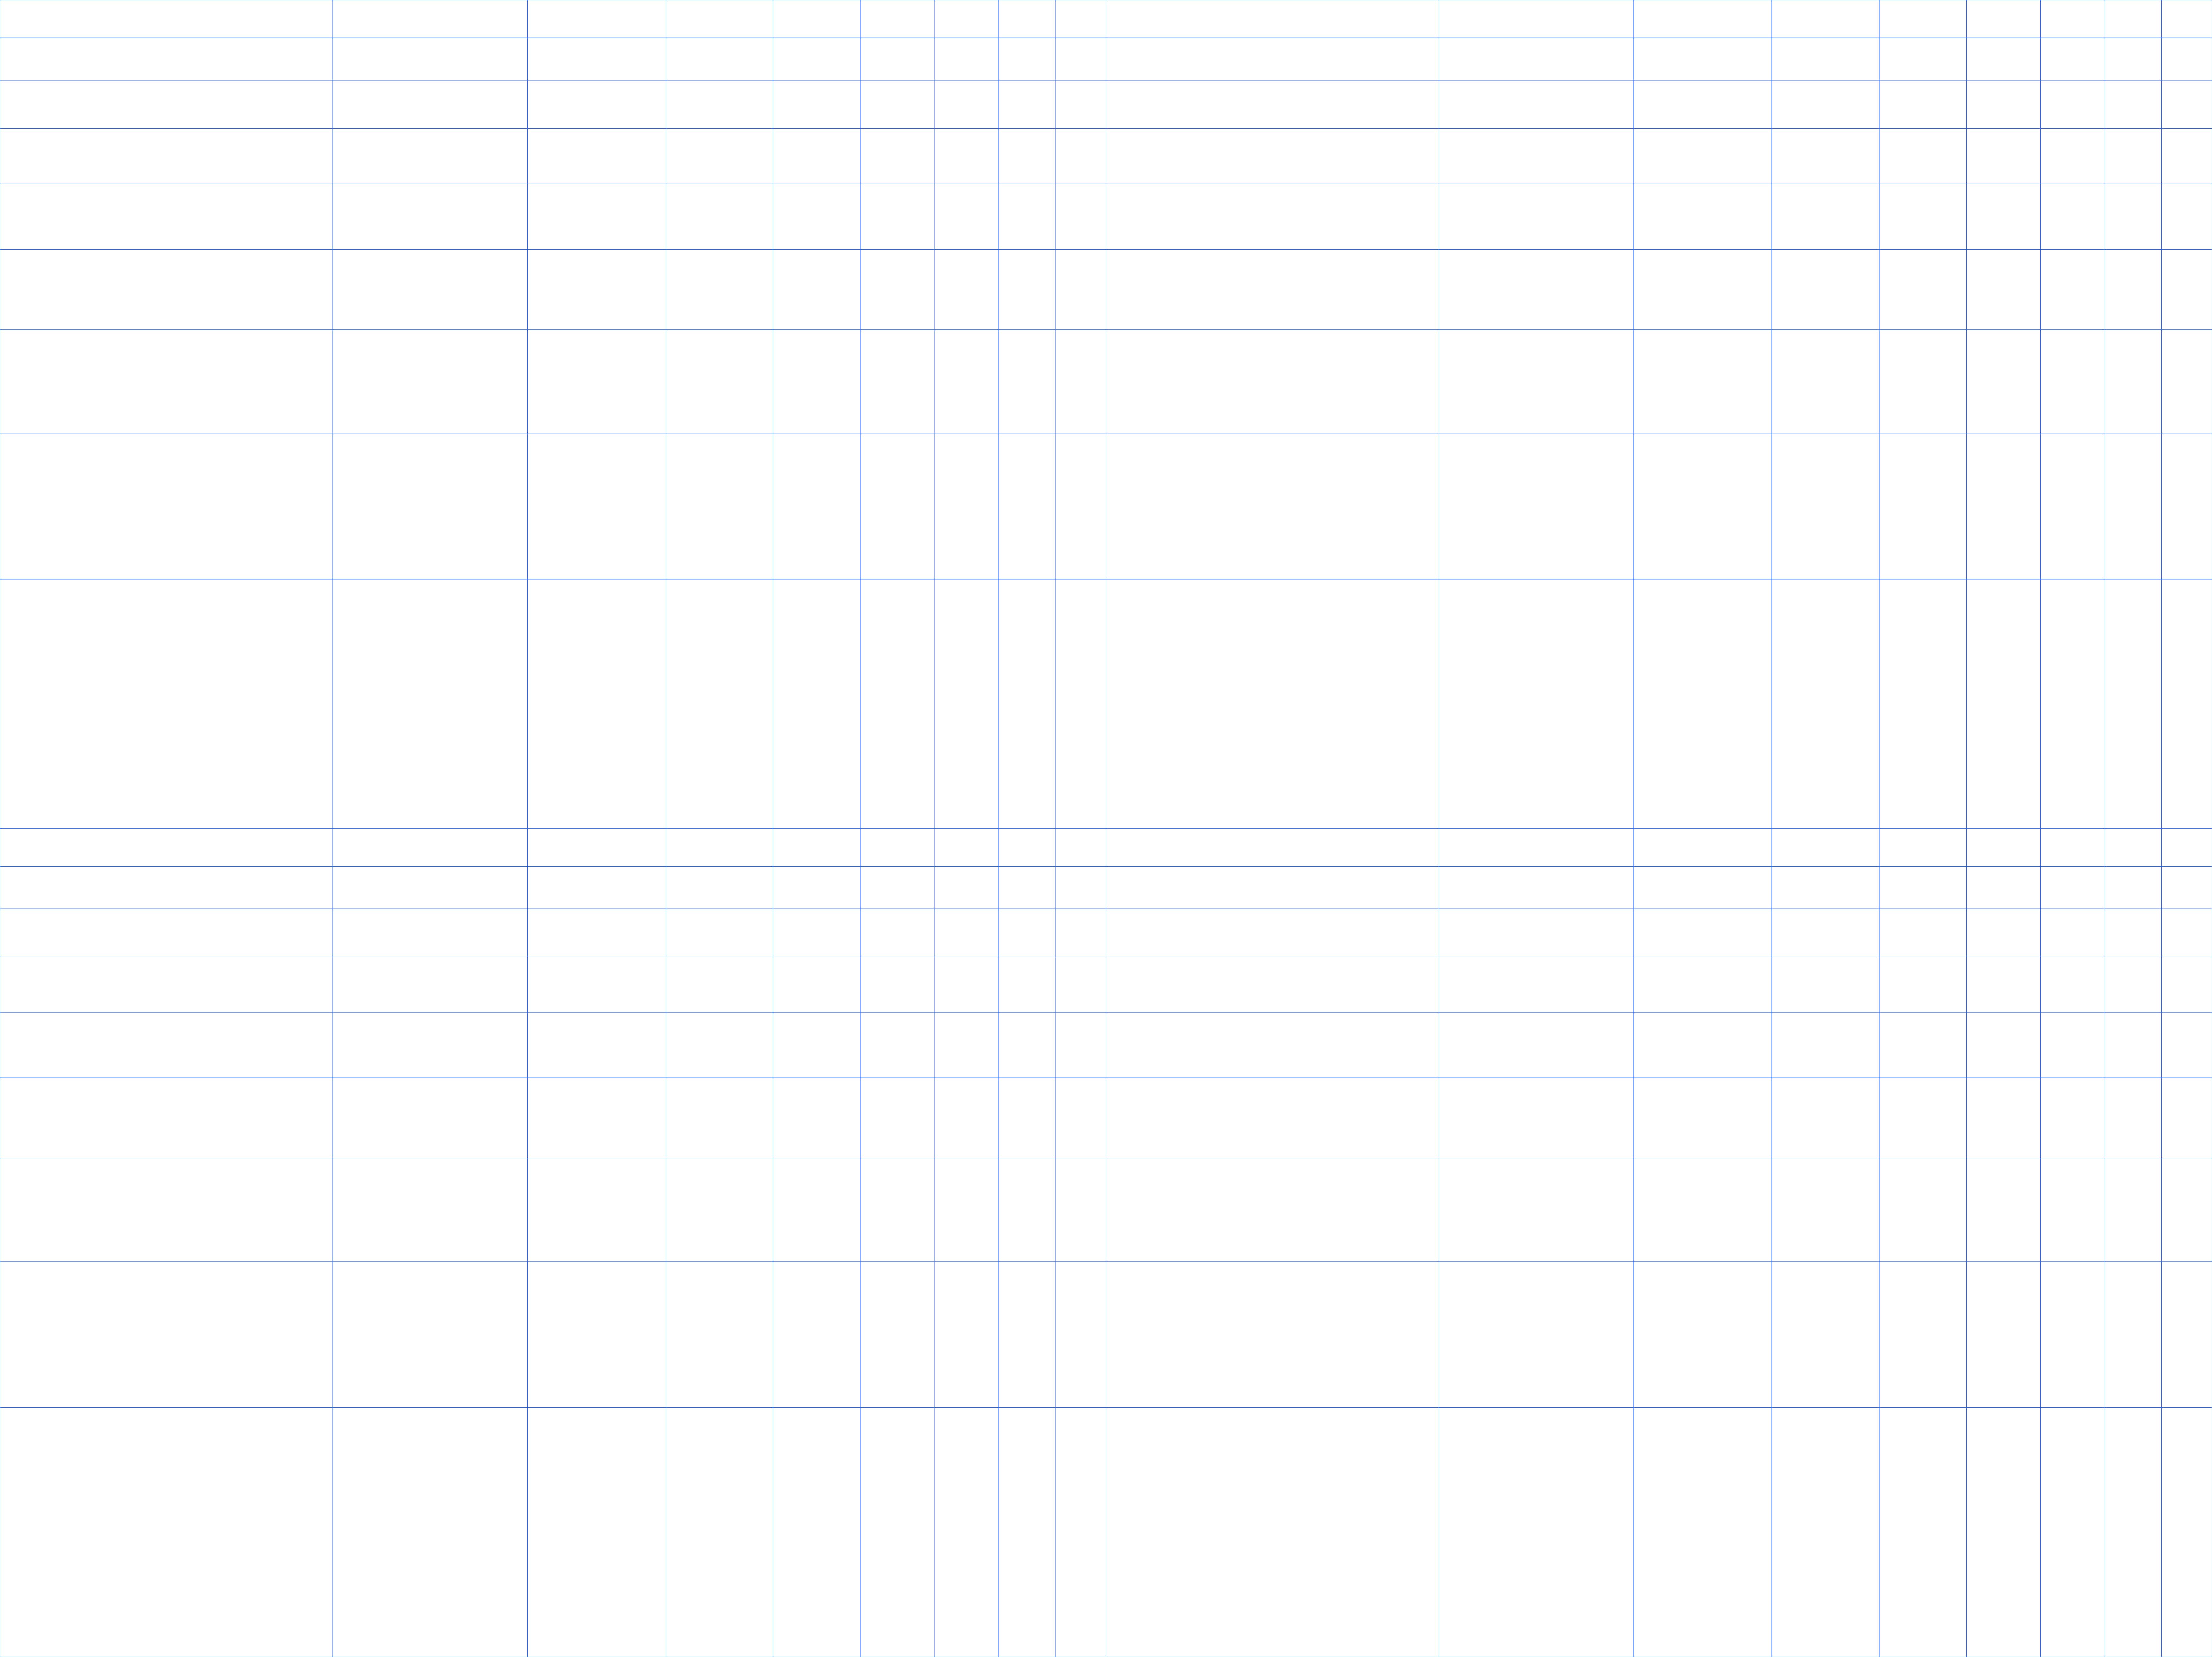
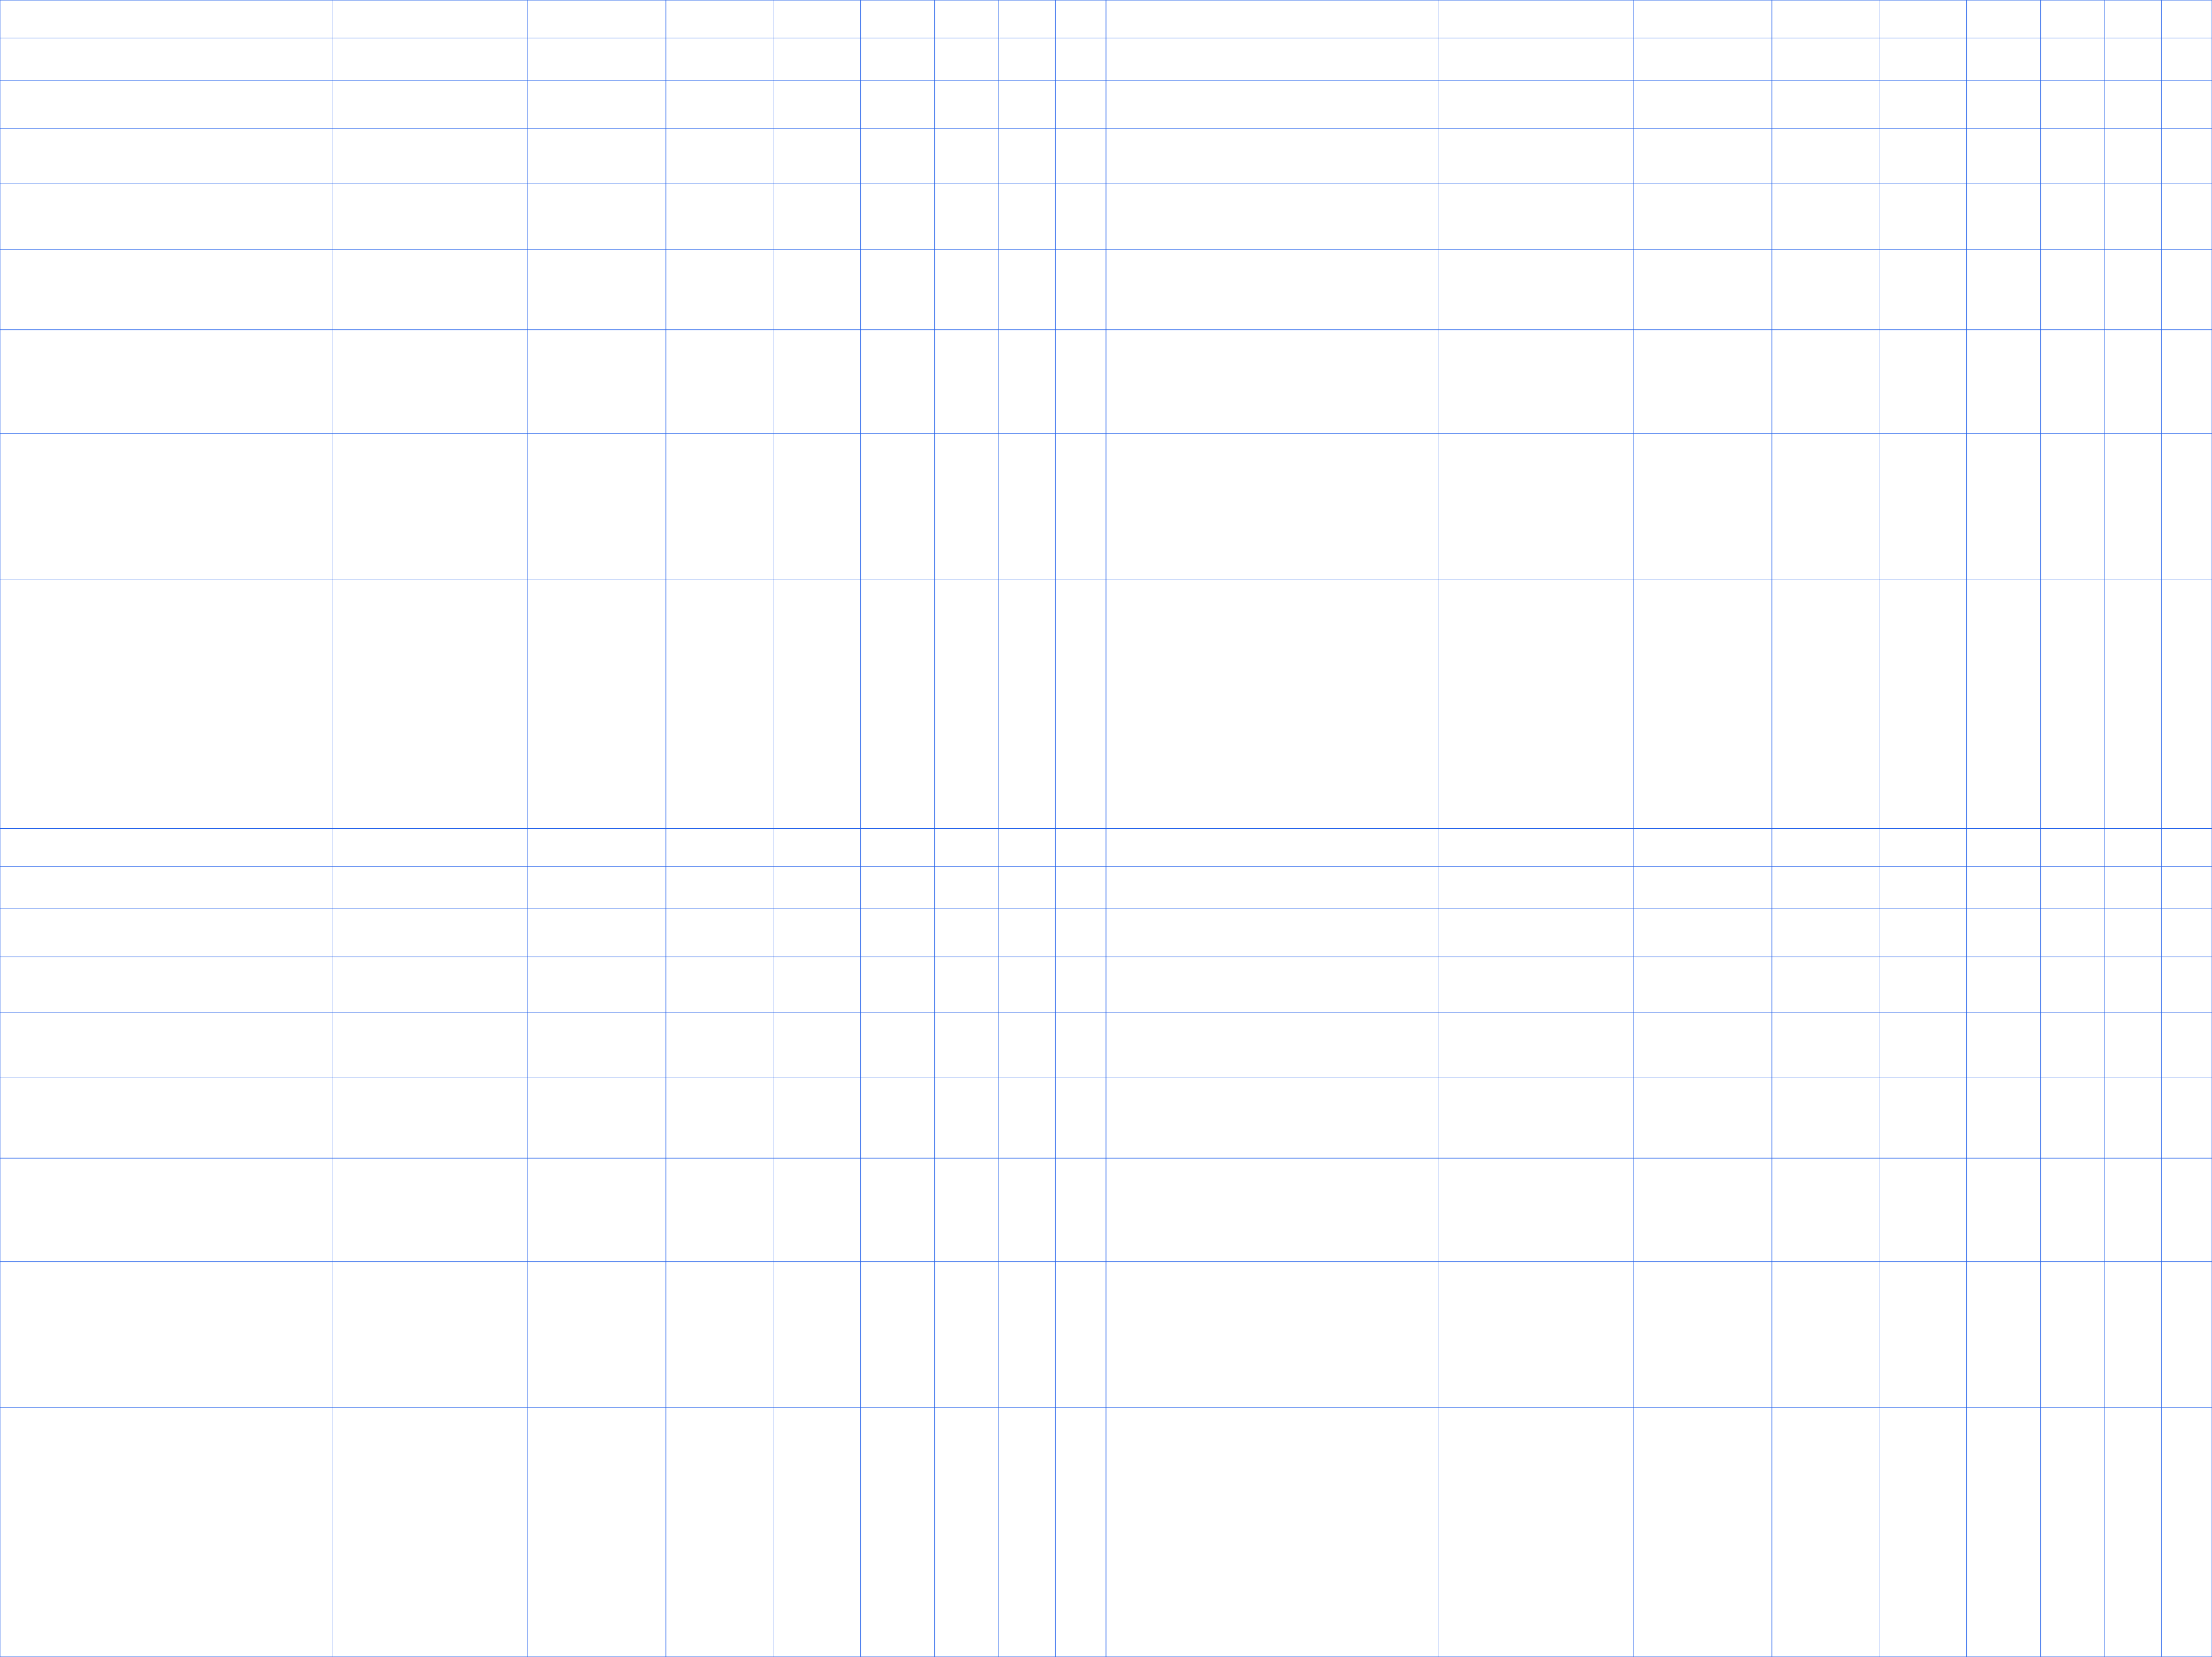
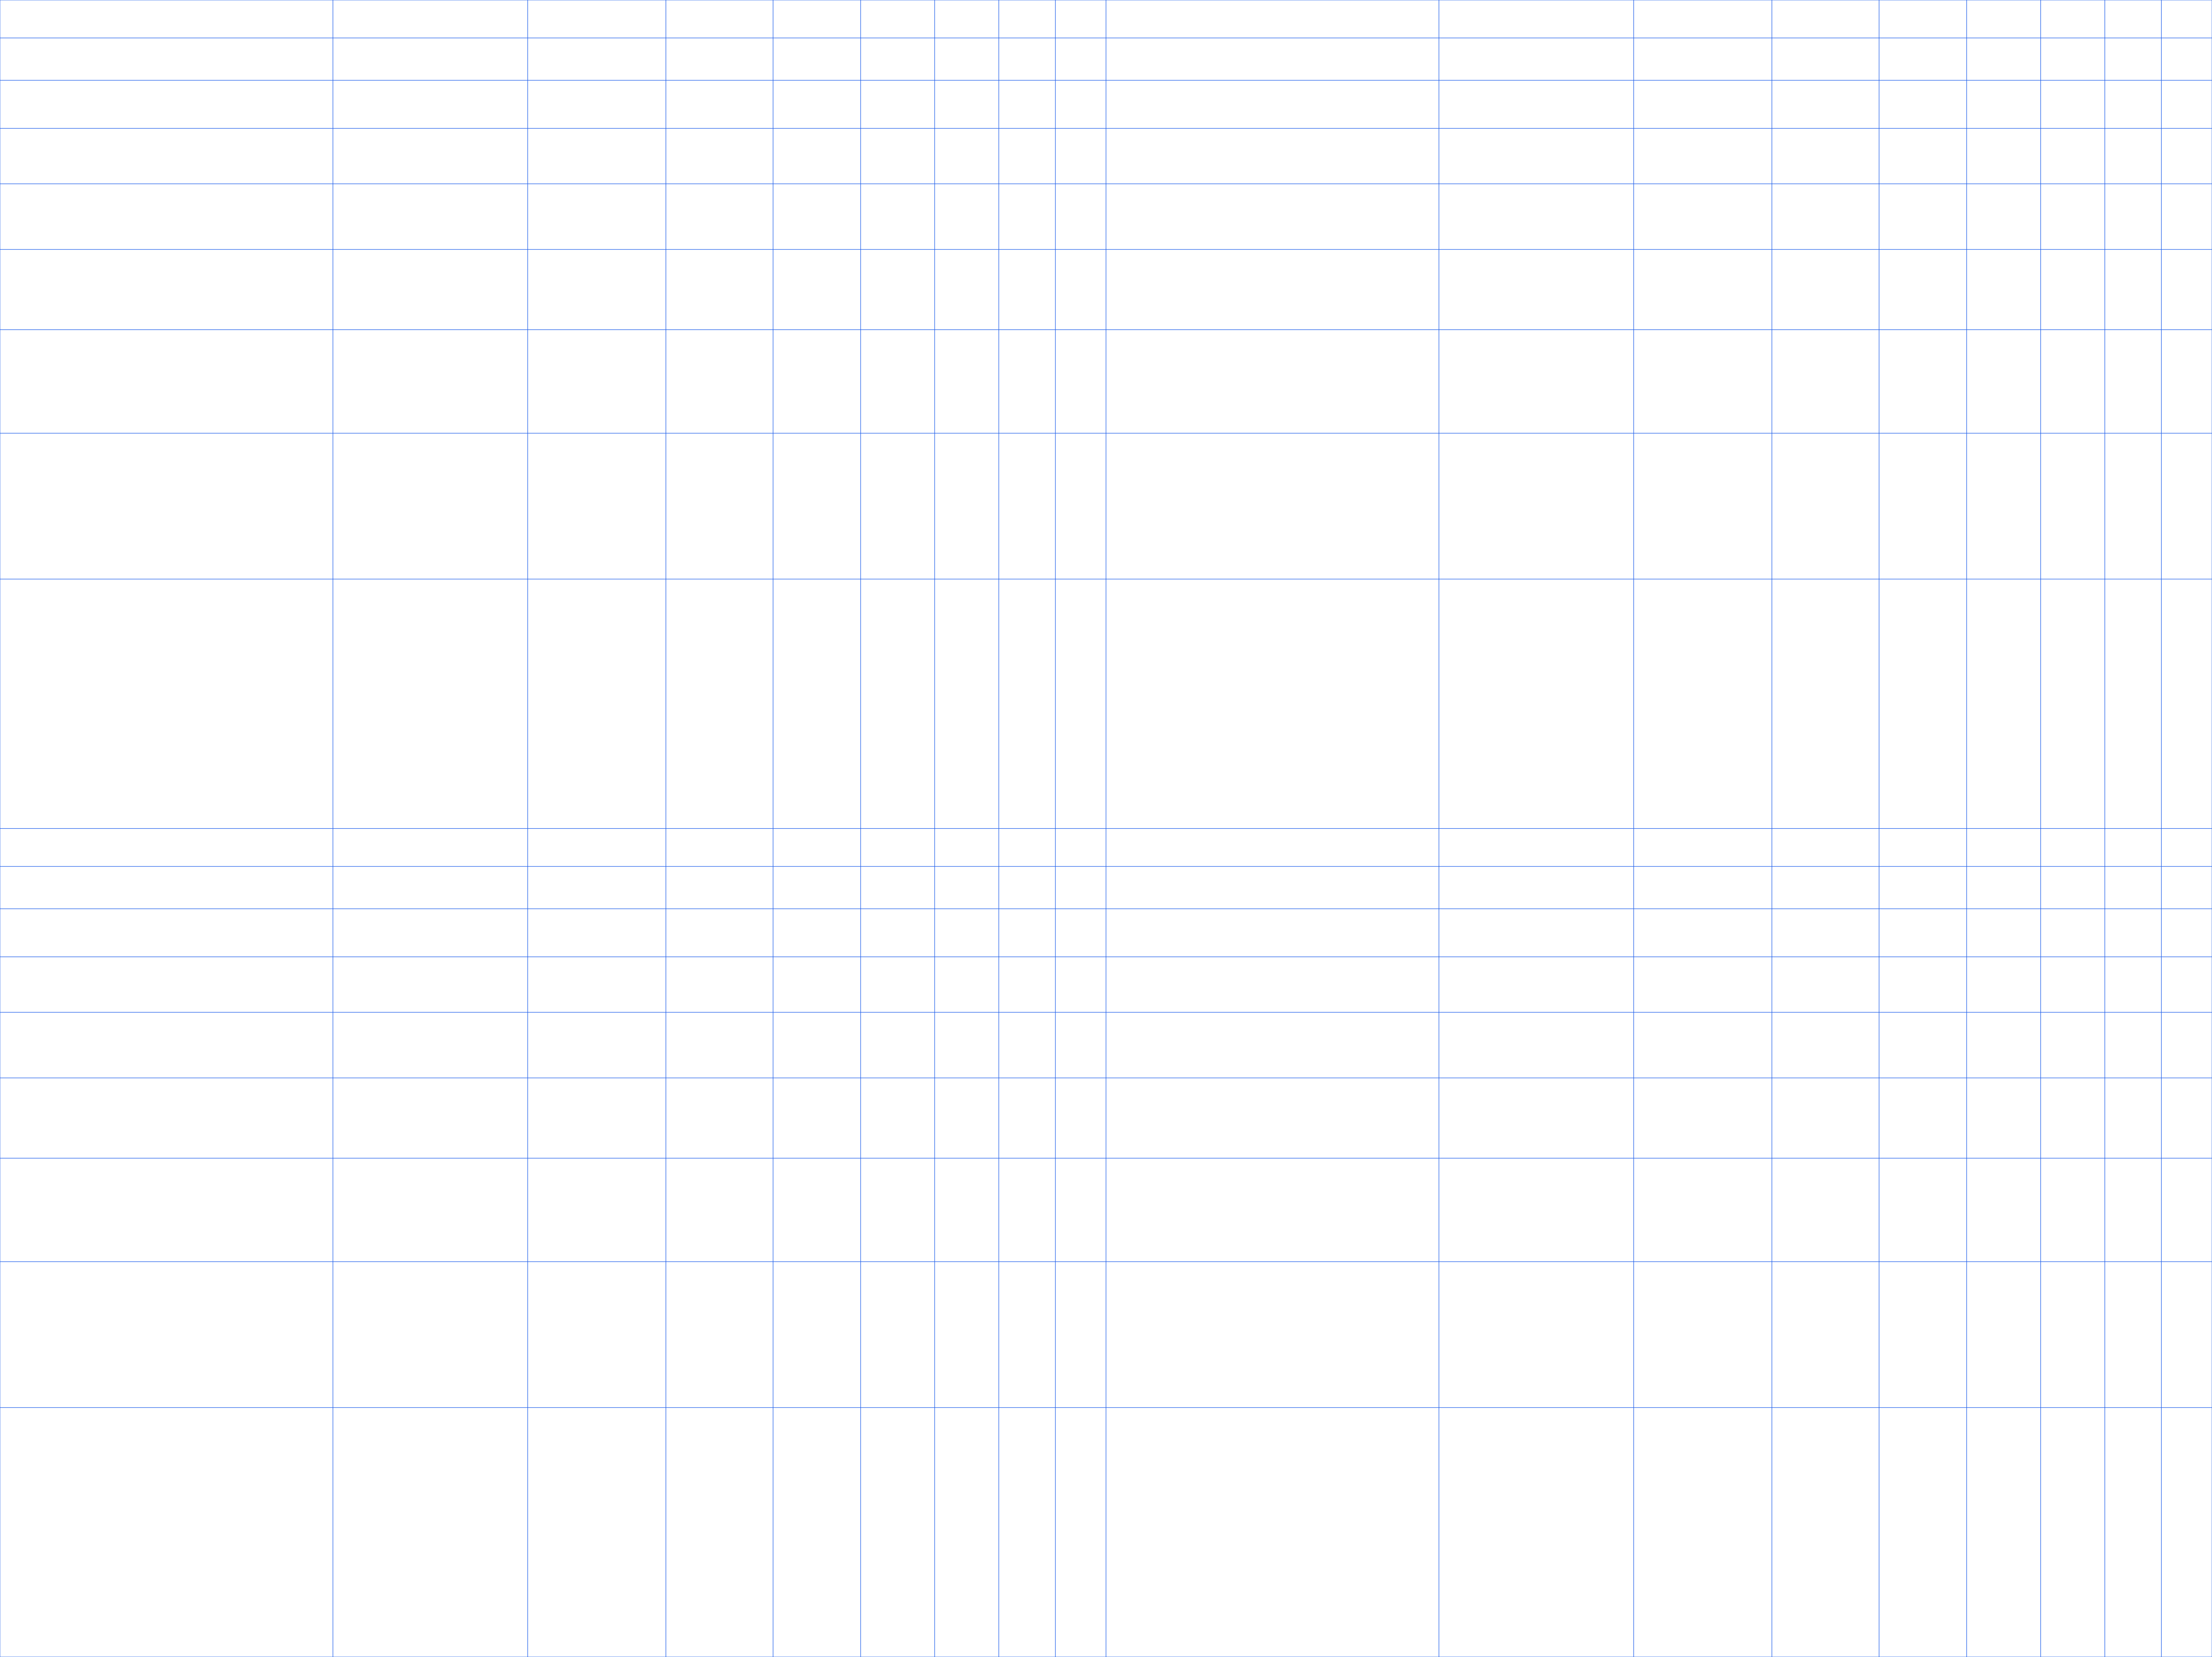
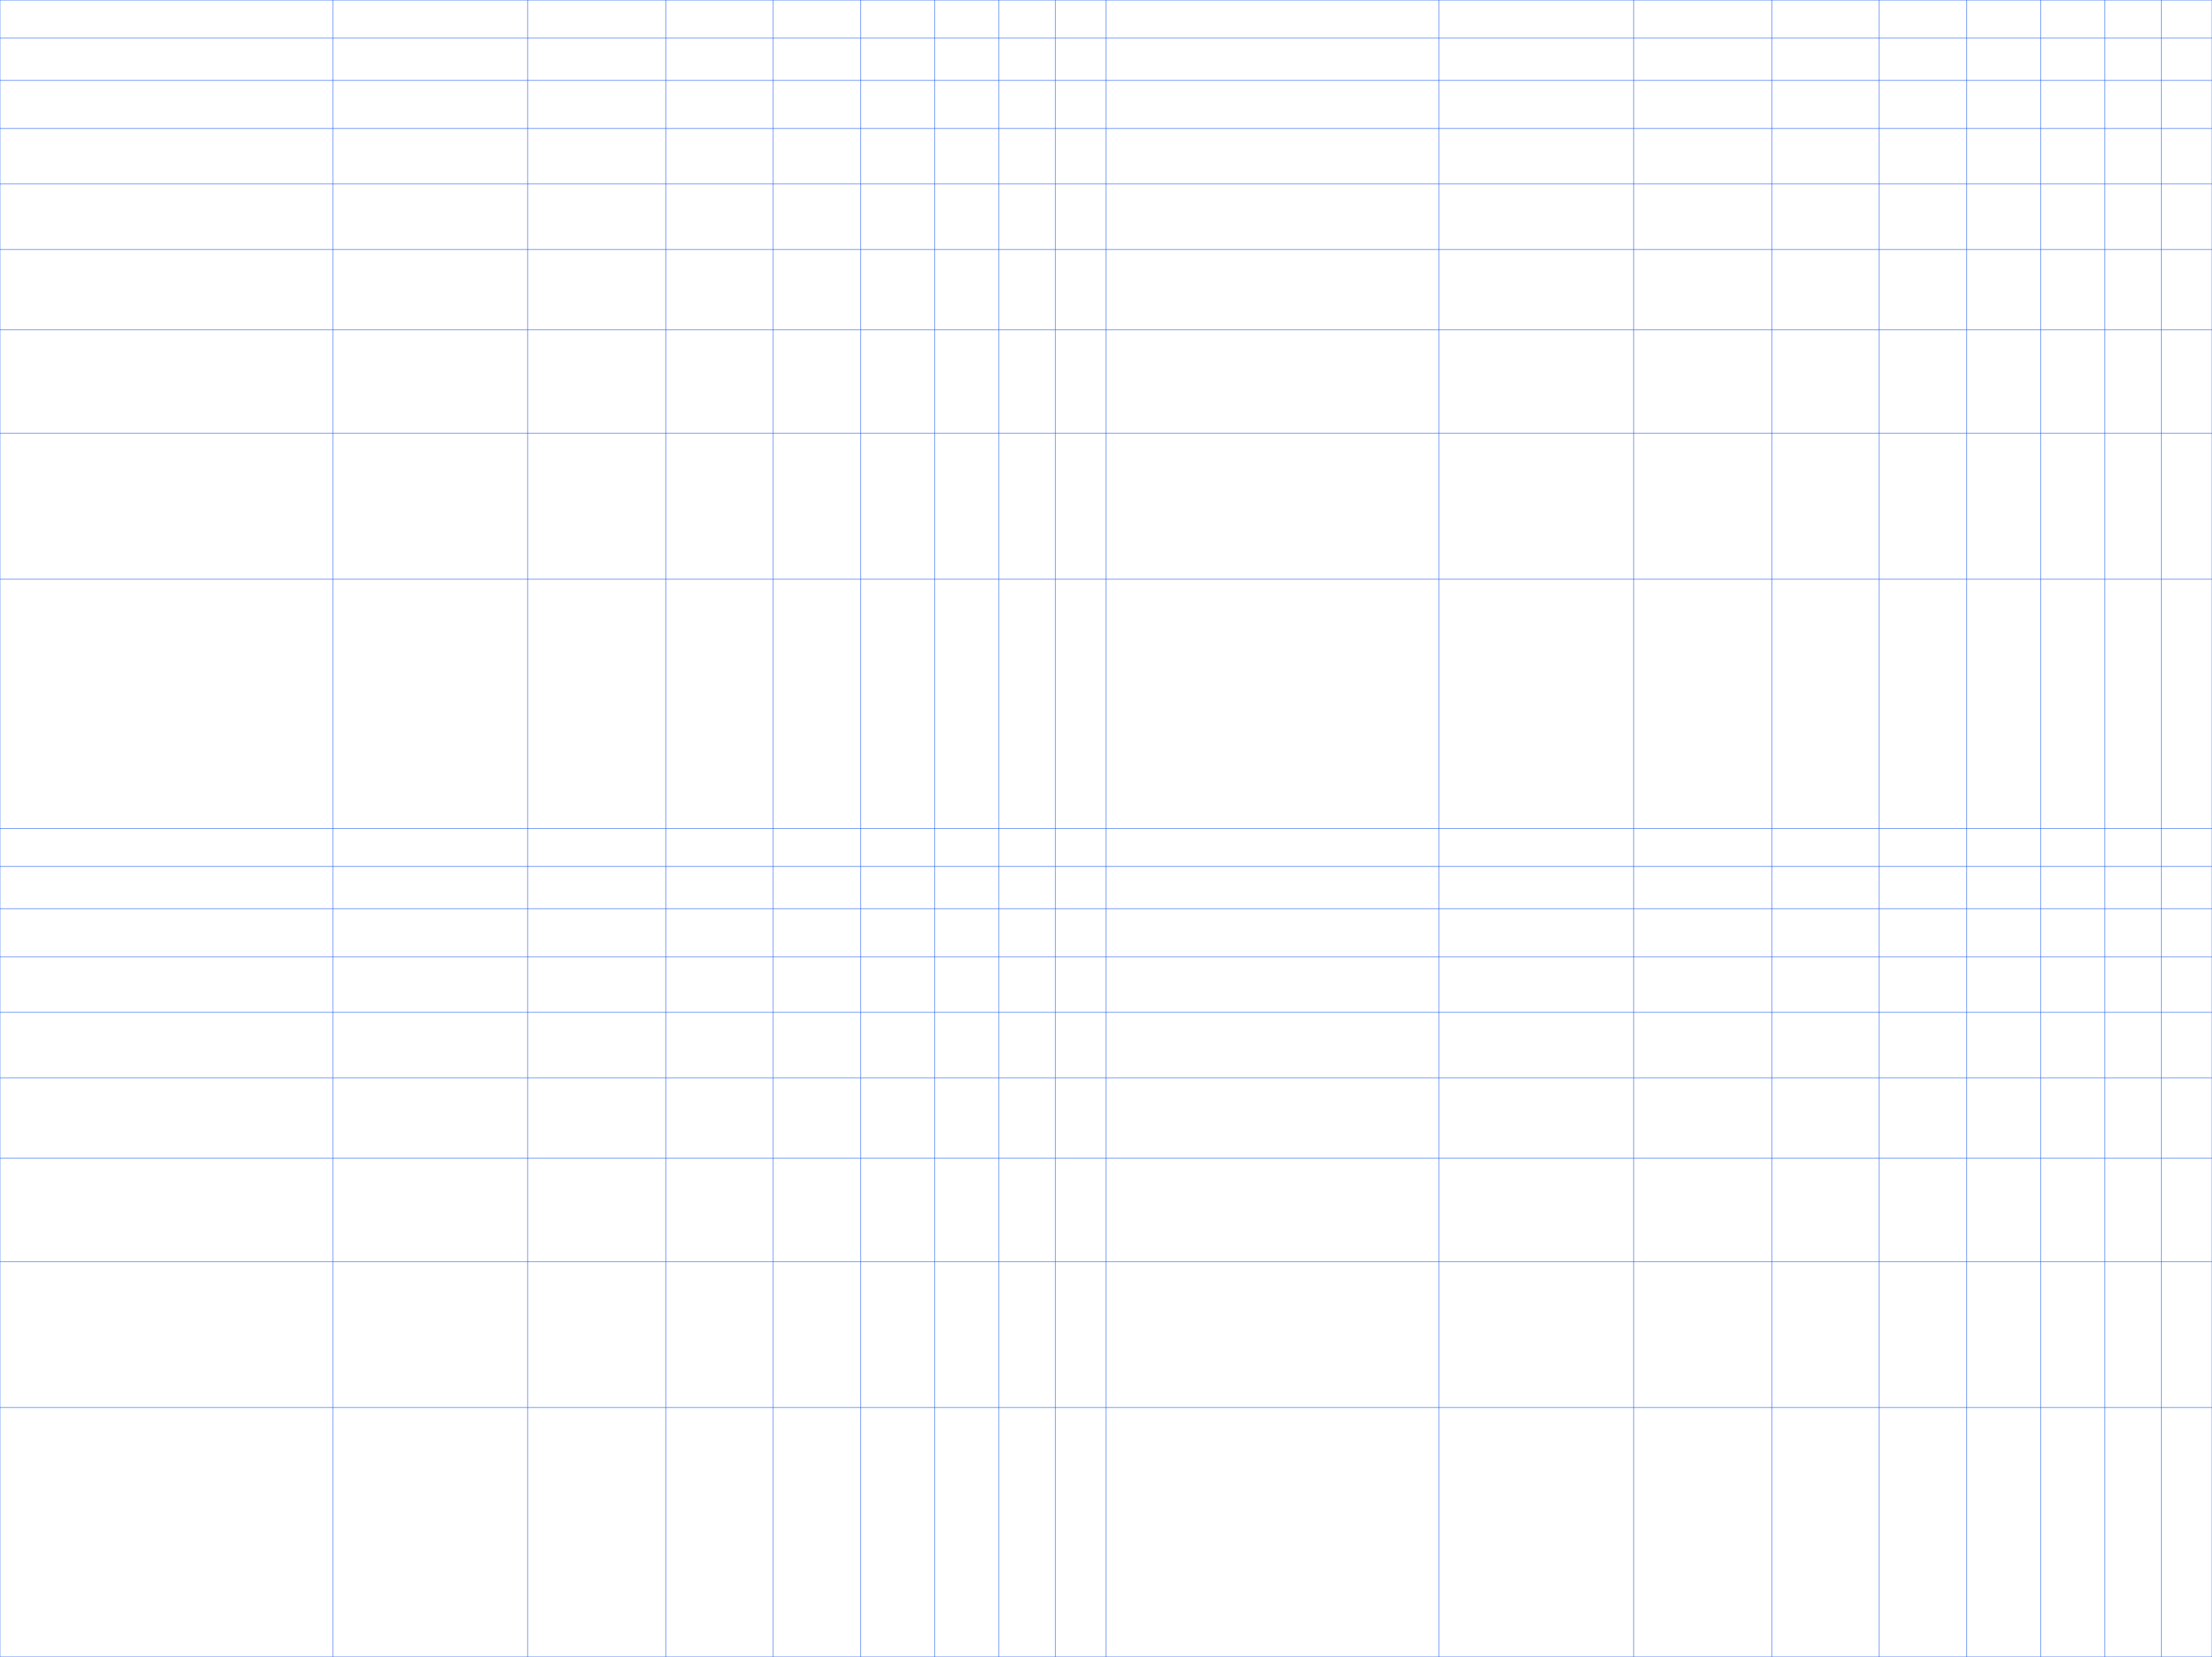
Log-log graph paper has logarithmic scales on both axes, so each axis stretches small values and compresses large ones. It is used to plot data that follows a power law, because a power relationship becomes a straight line on log-log paper. Engineers use it for circuit design and physics for scaling relationships.
How both axes use log scales
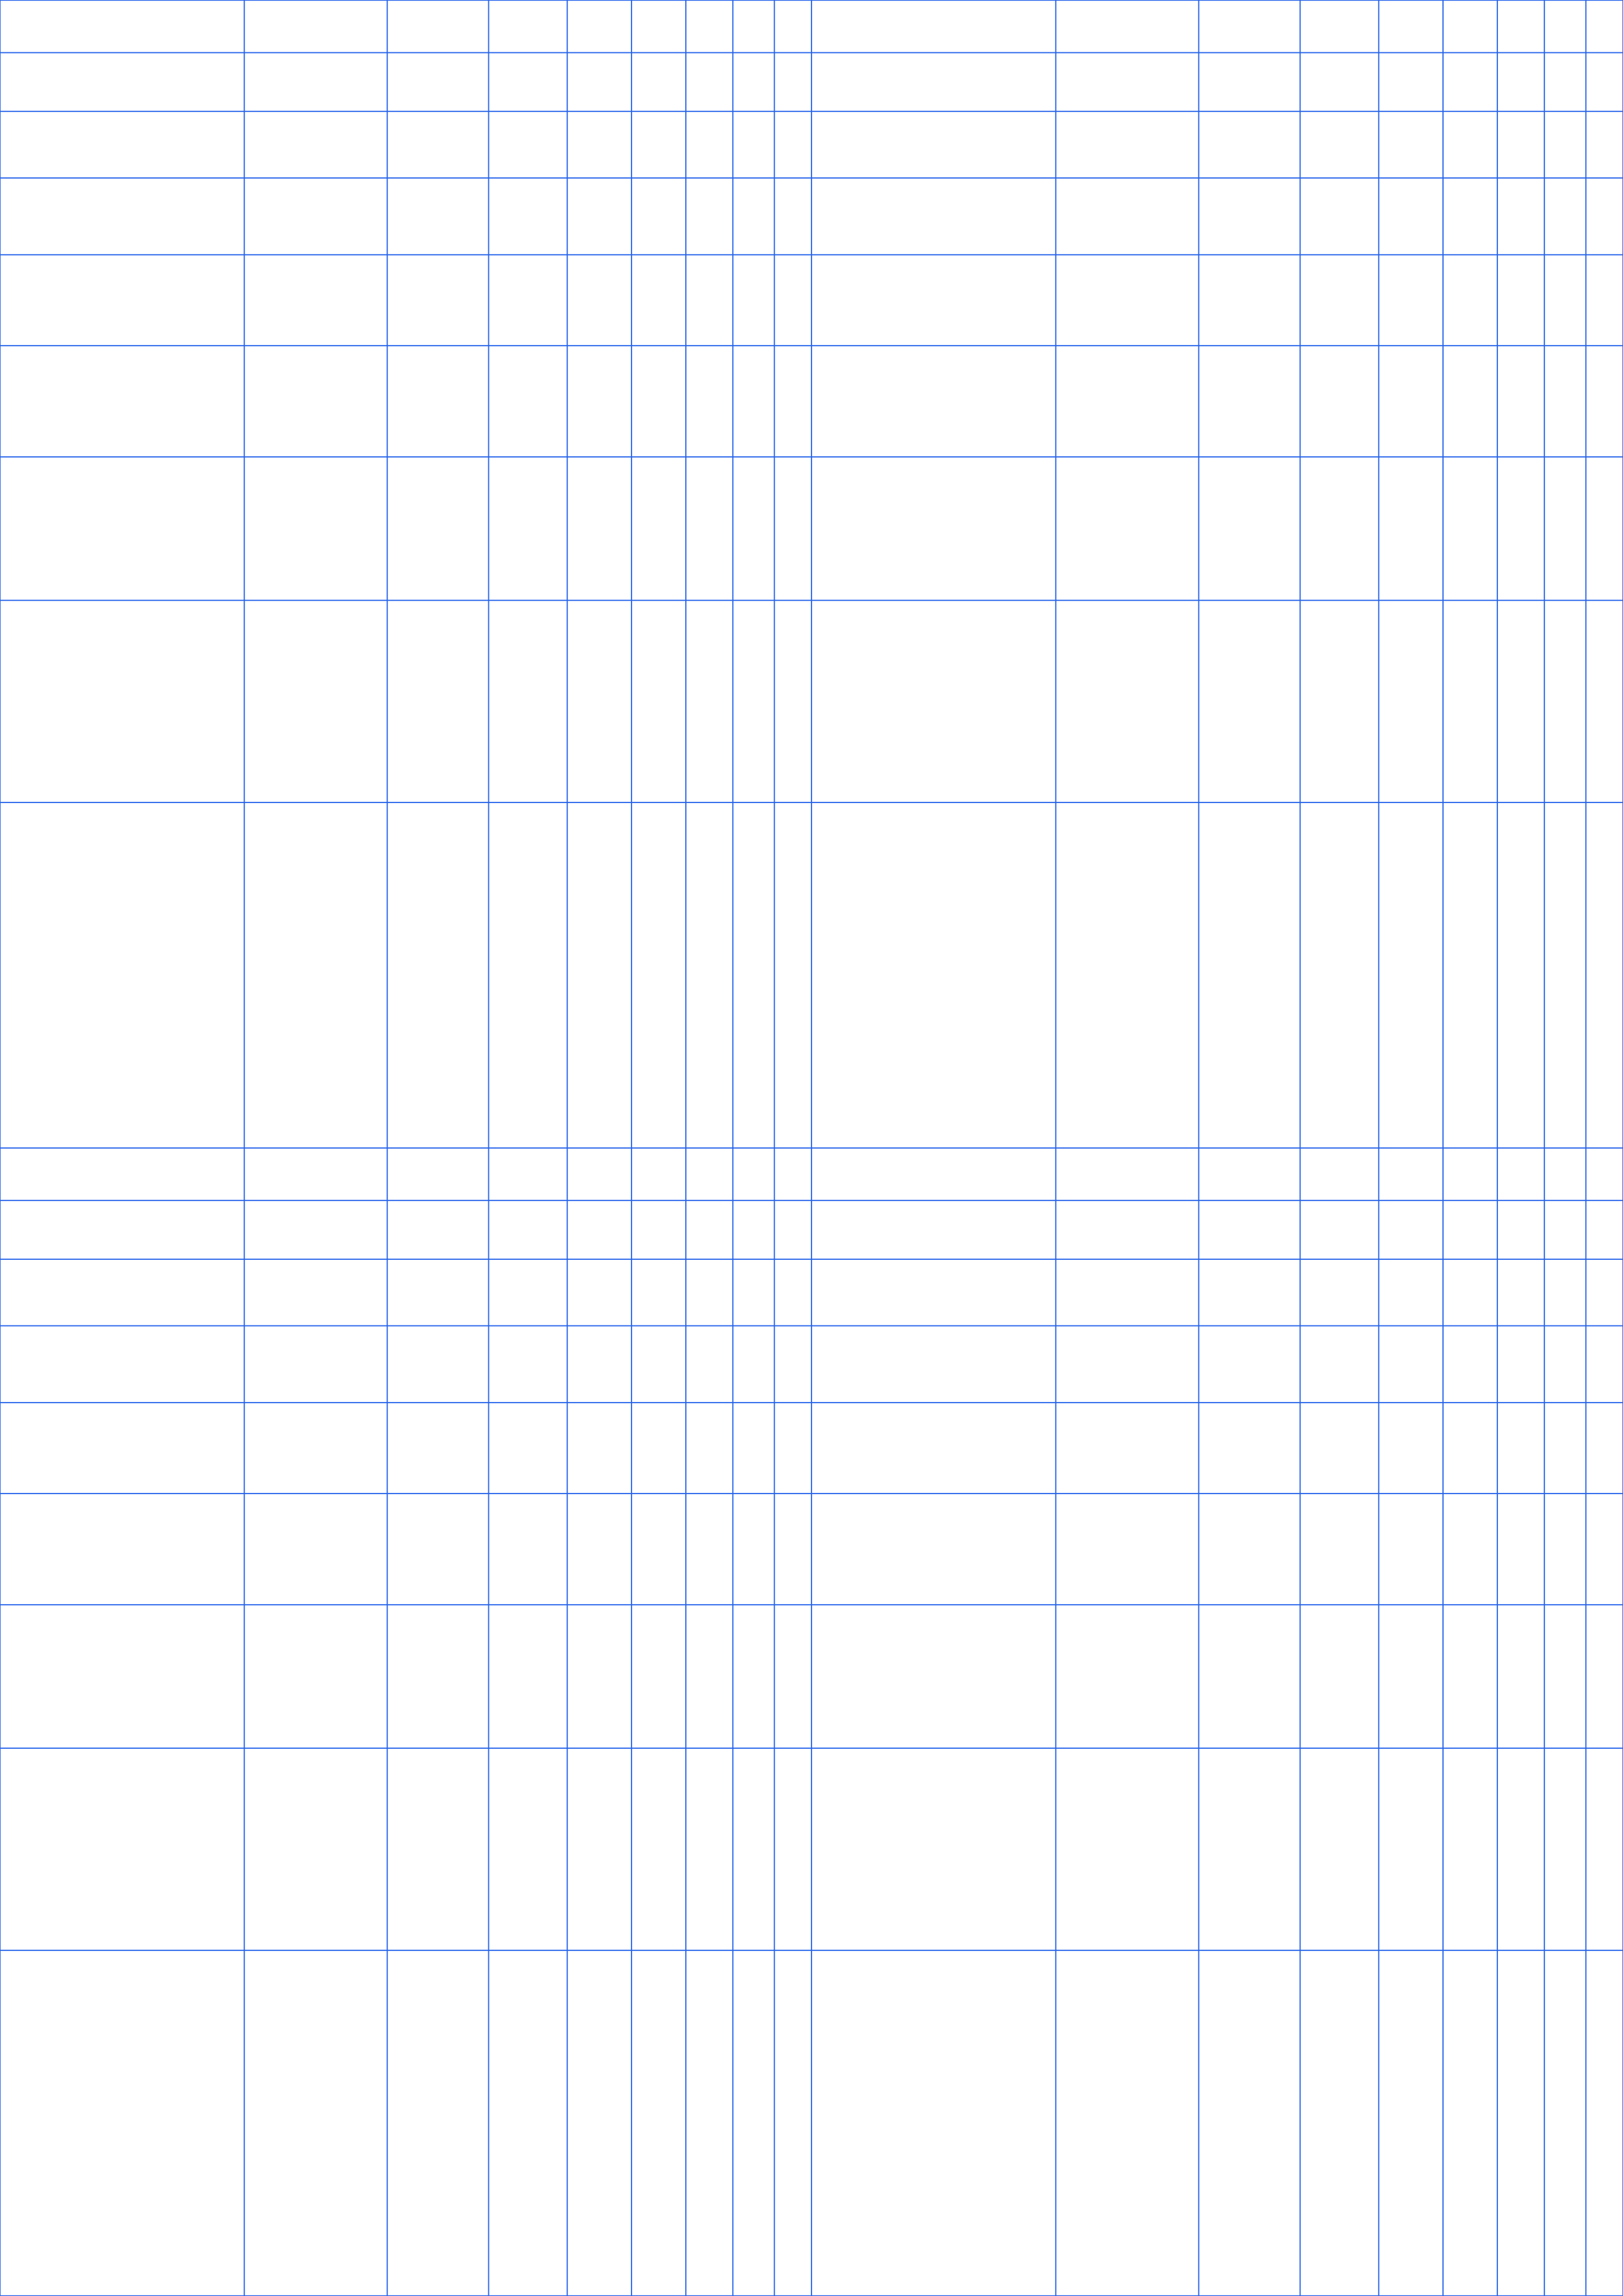
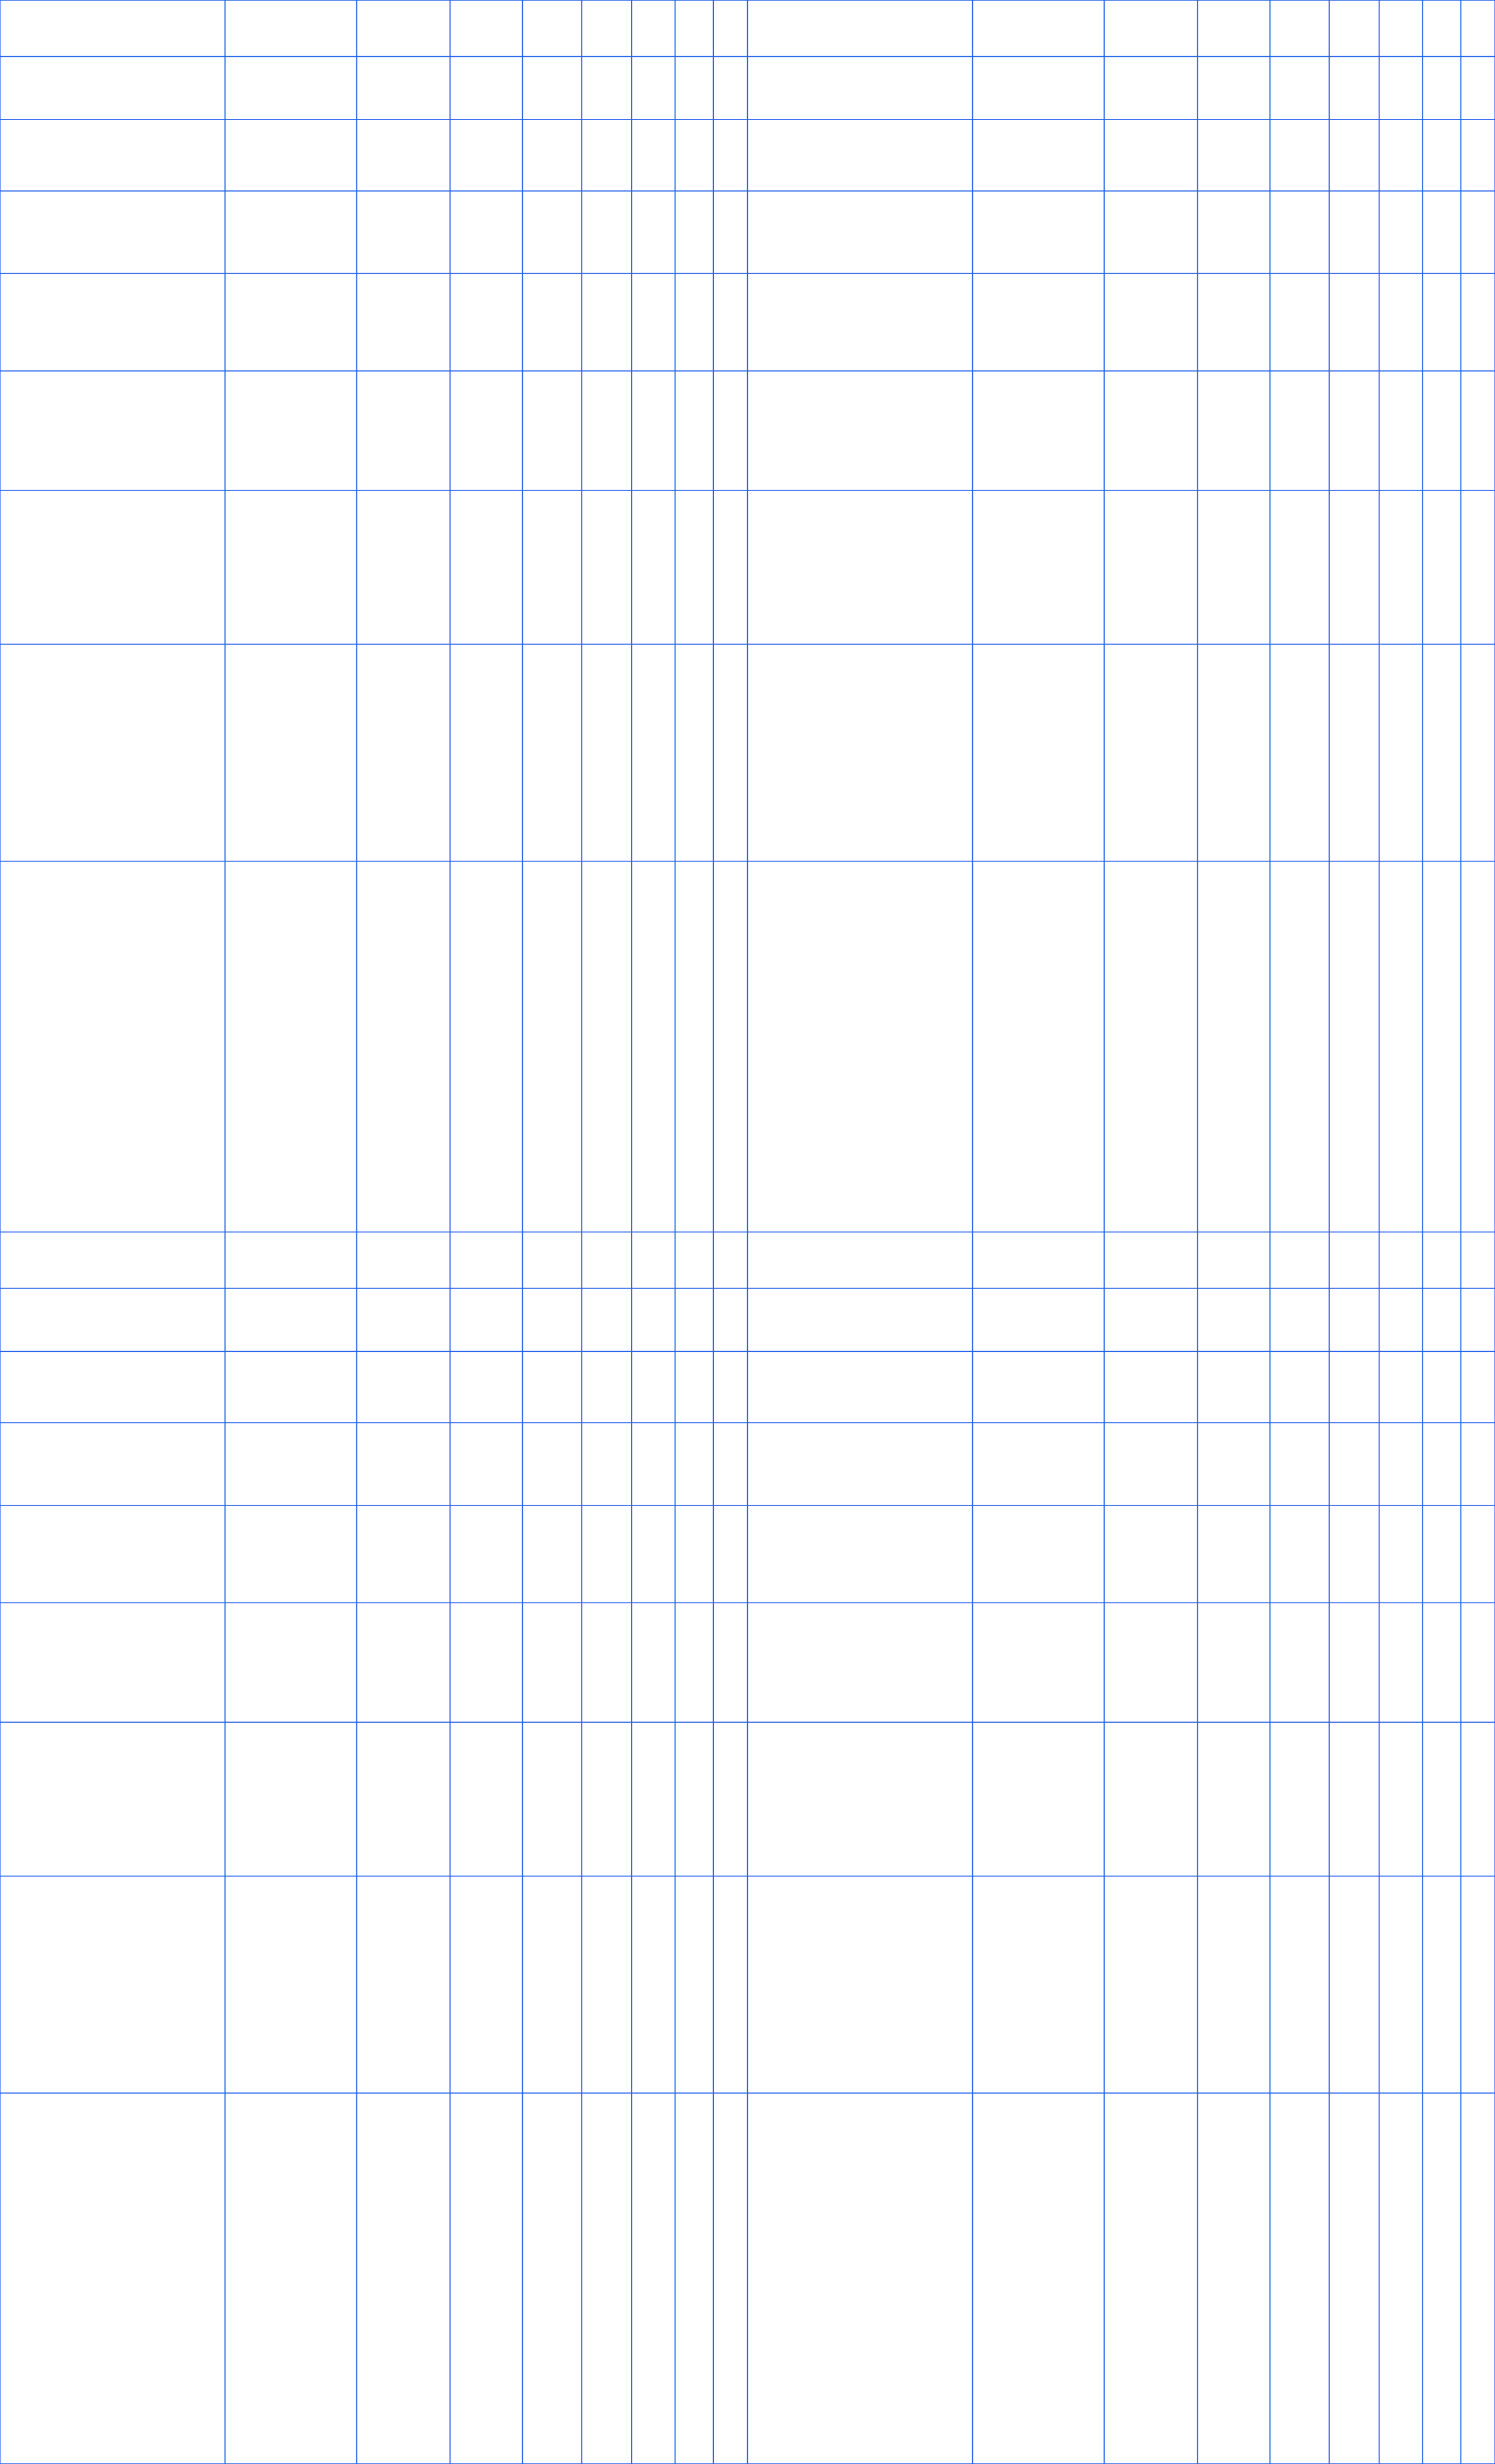
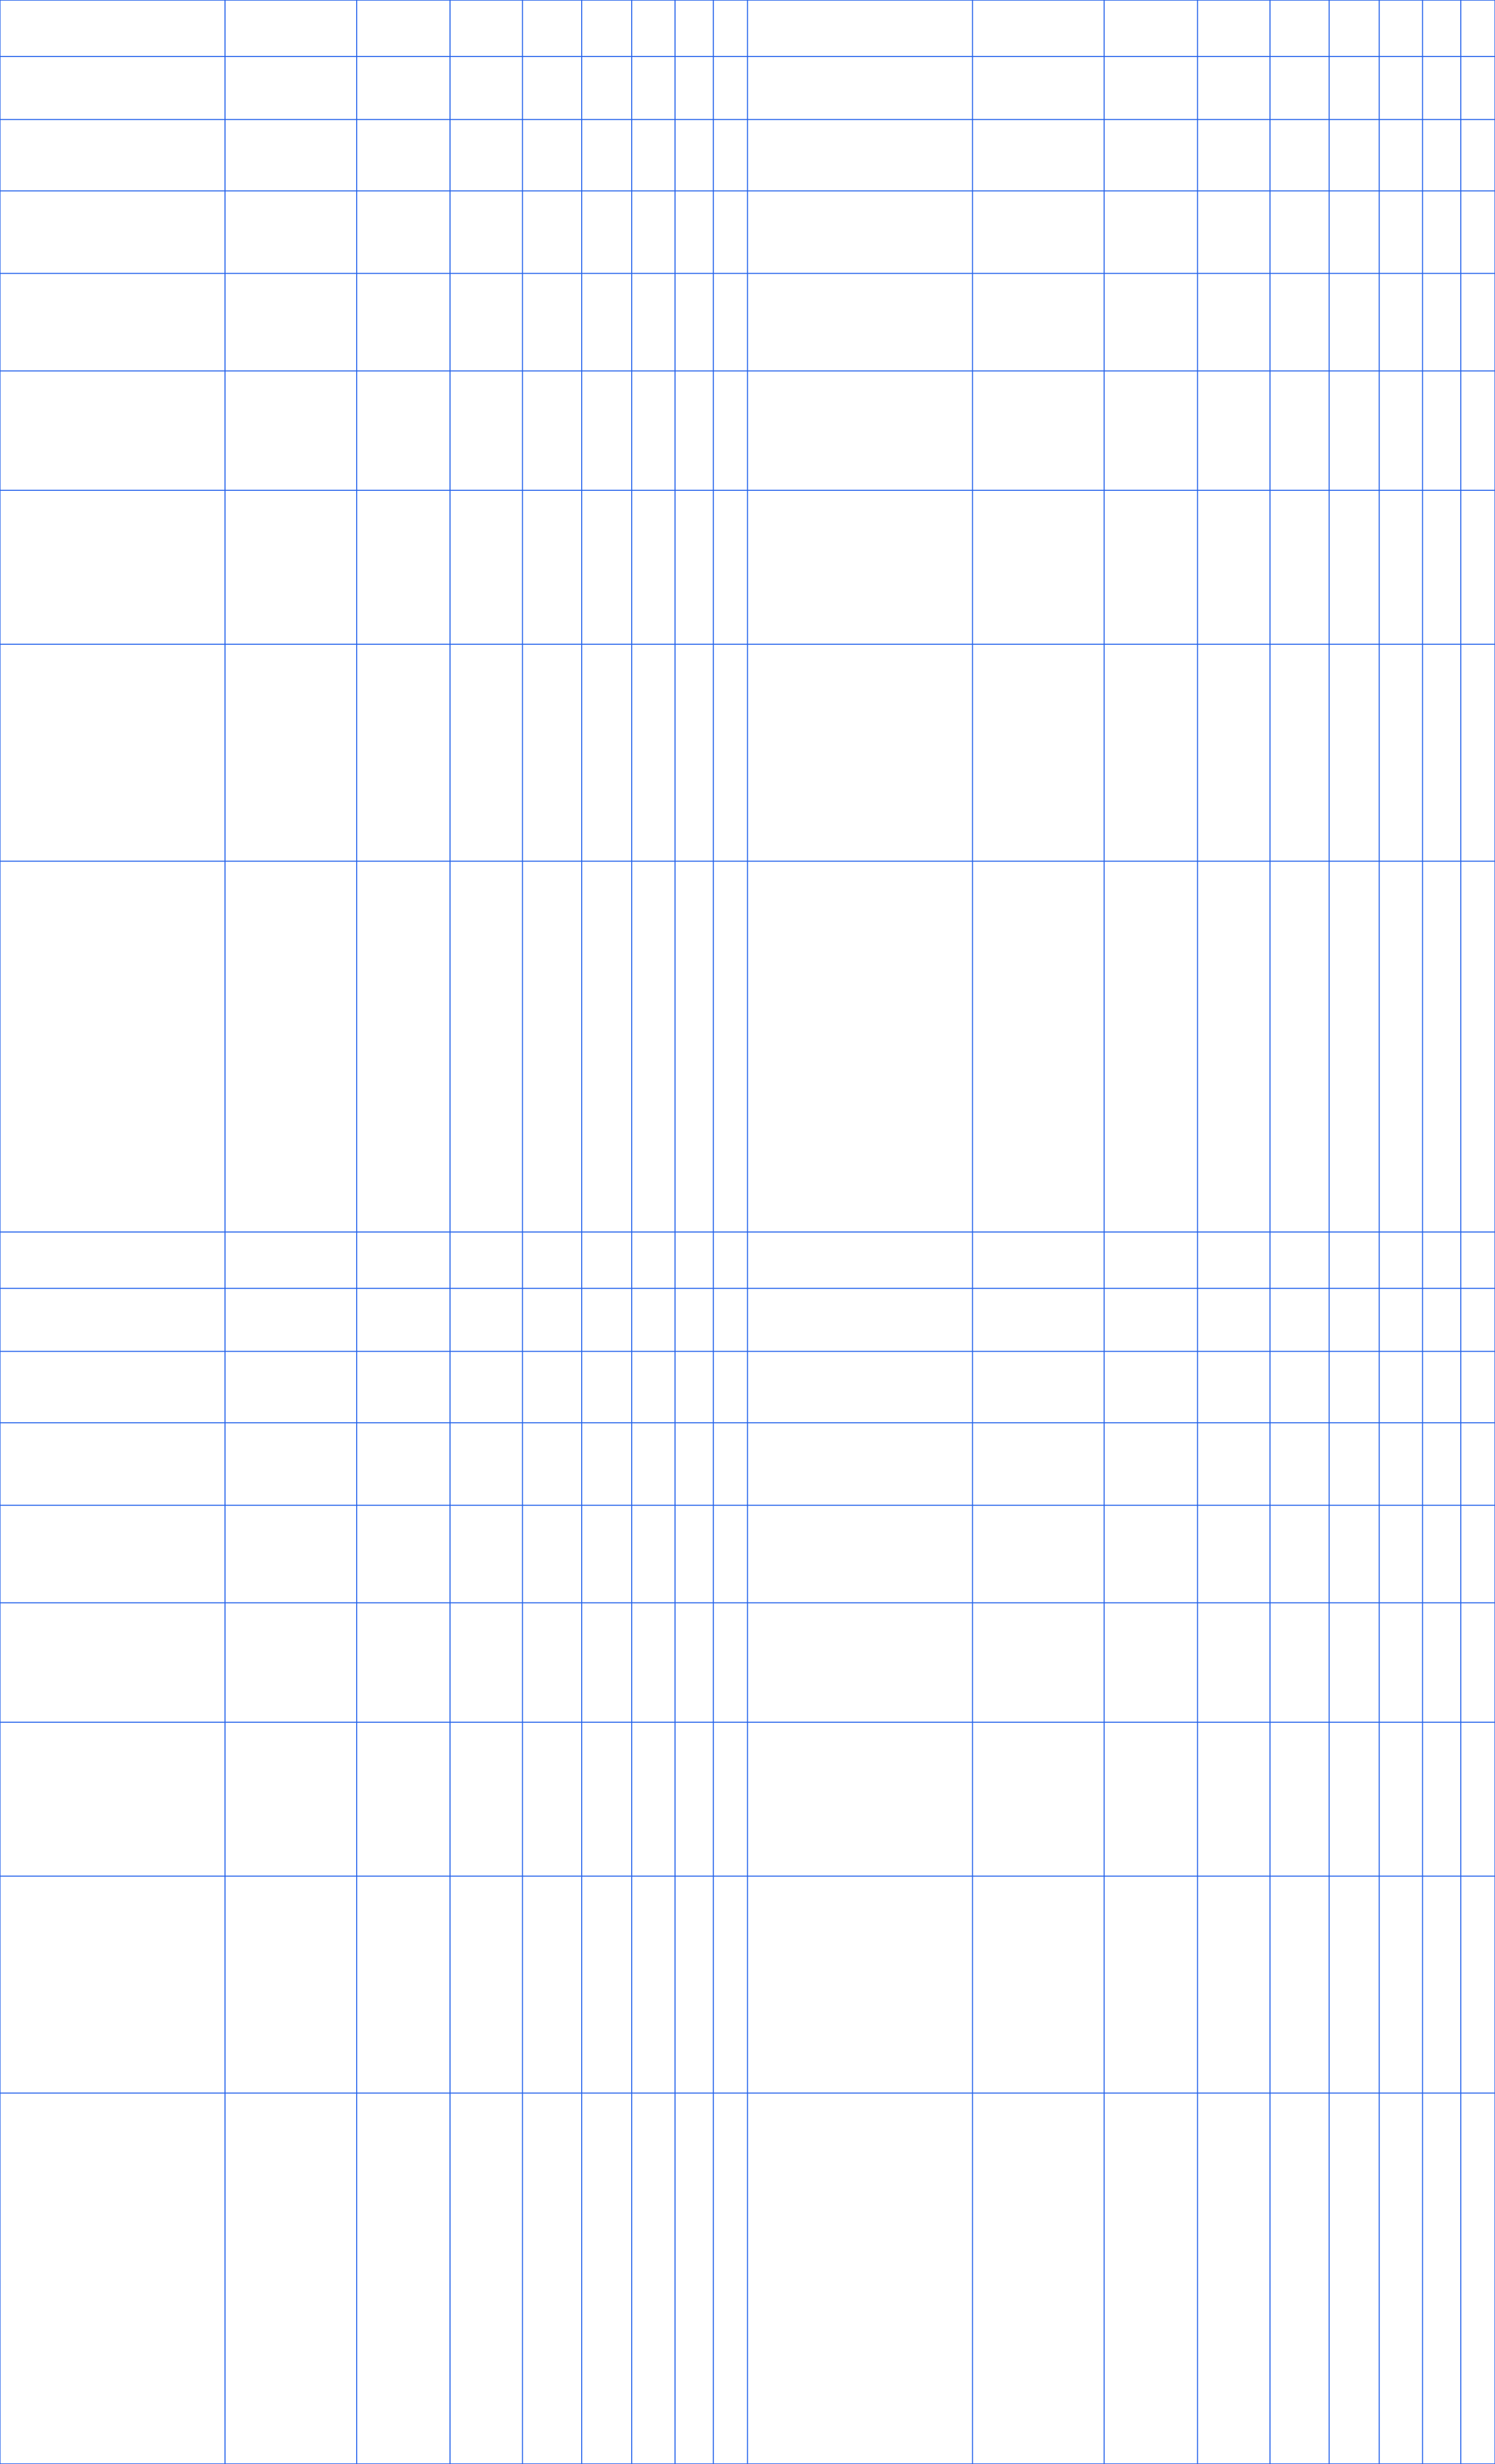
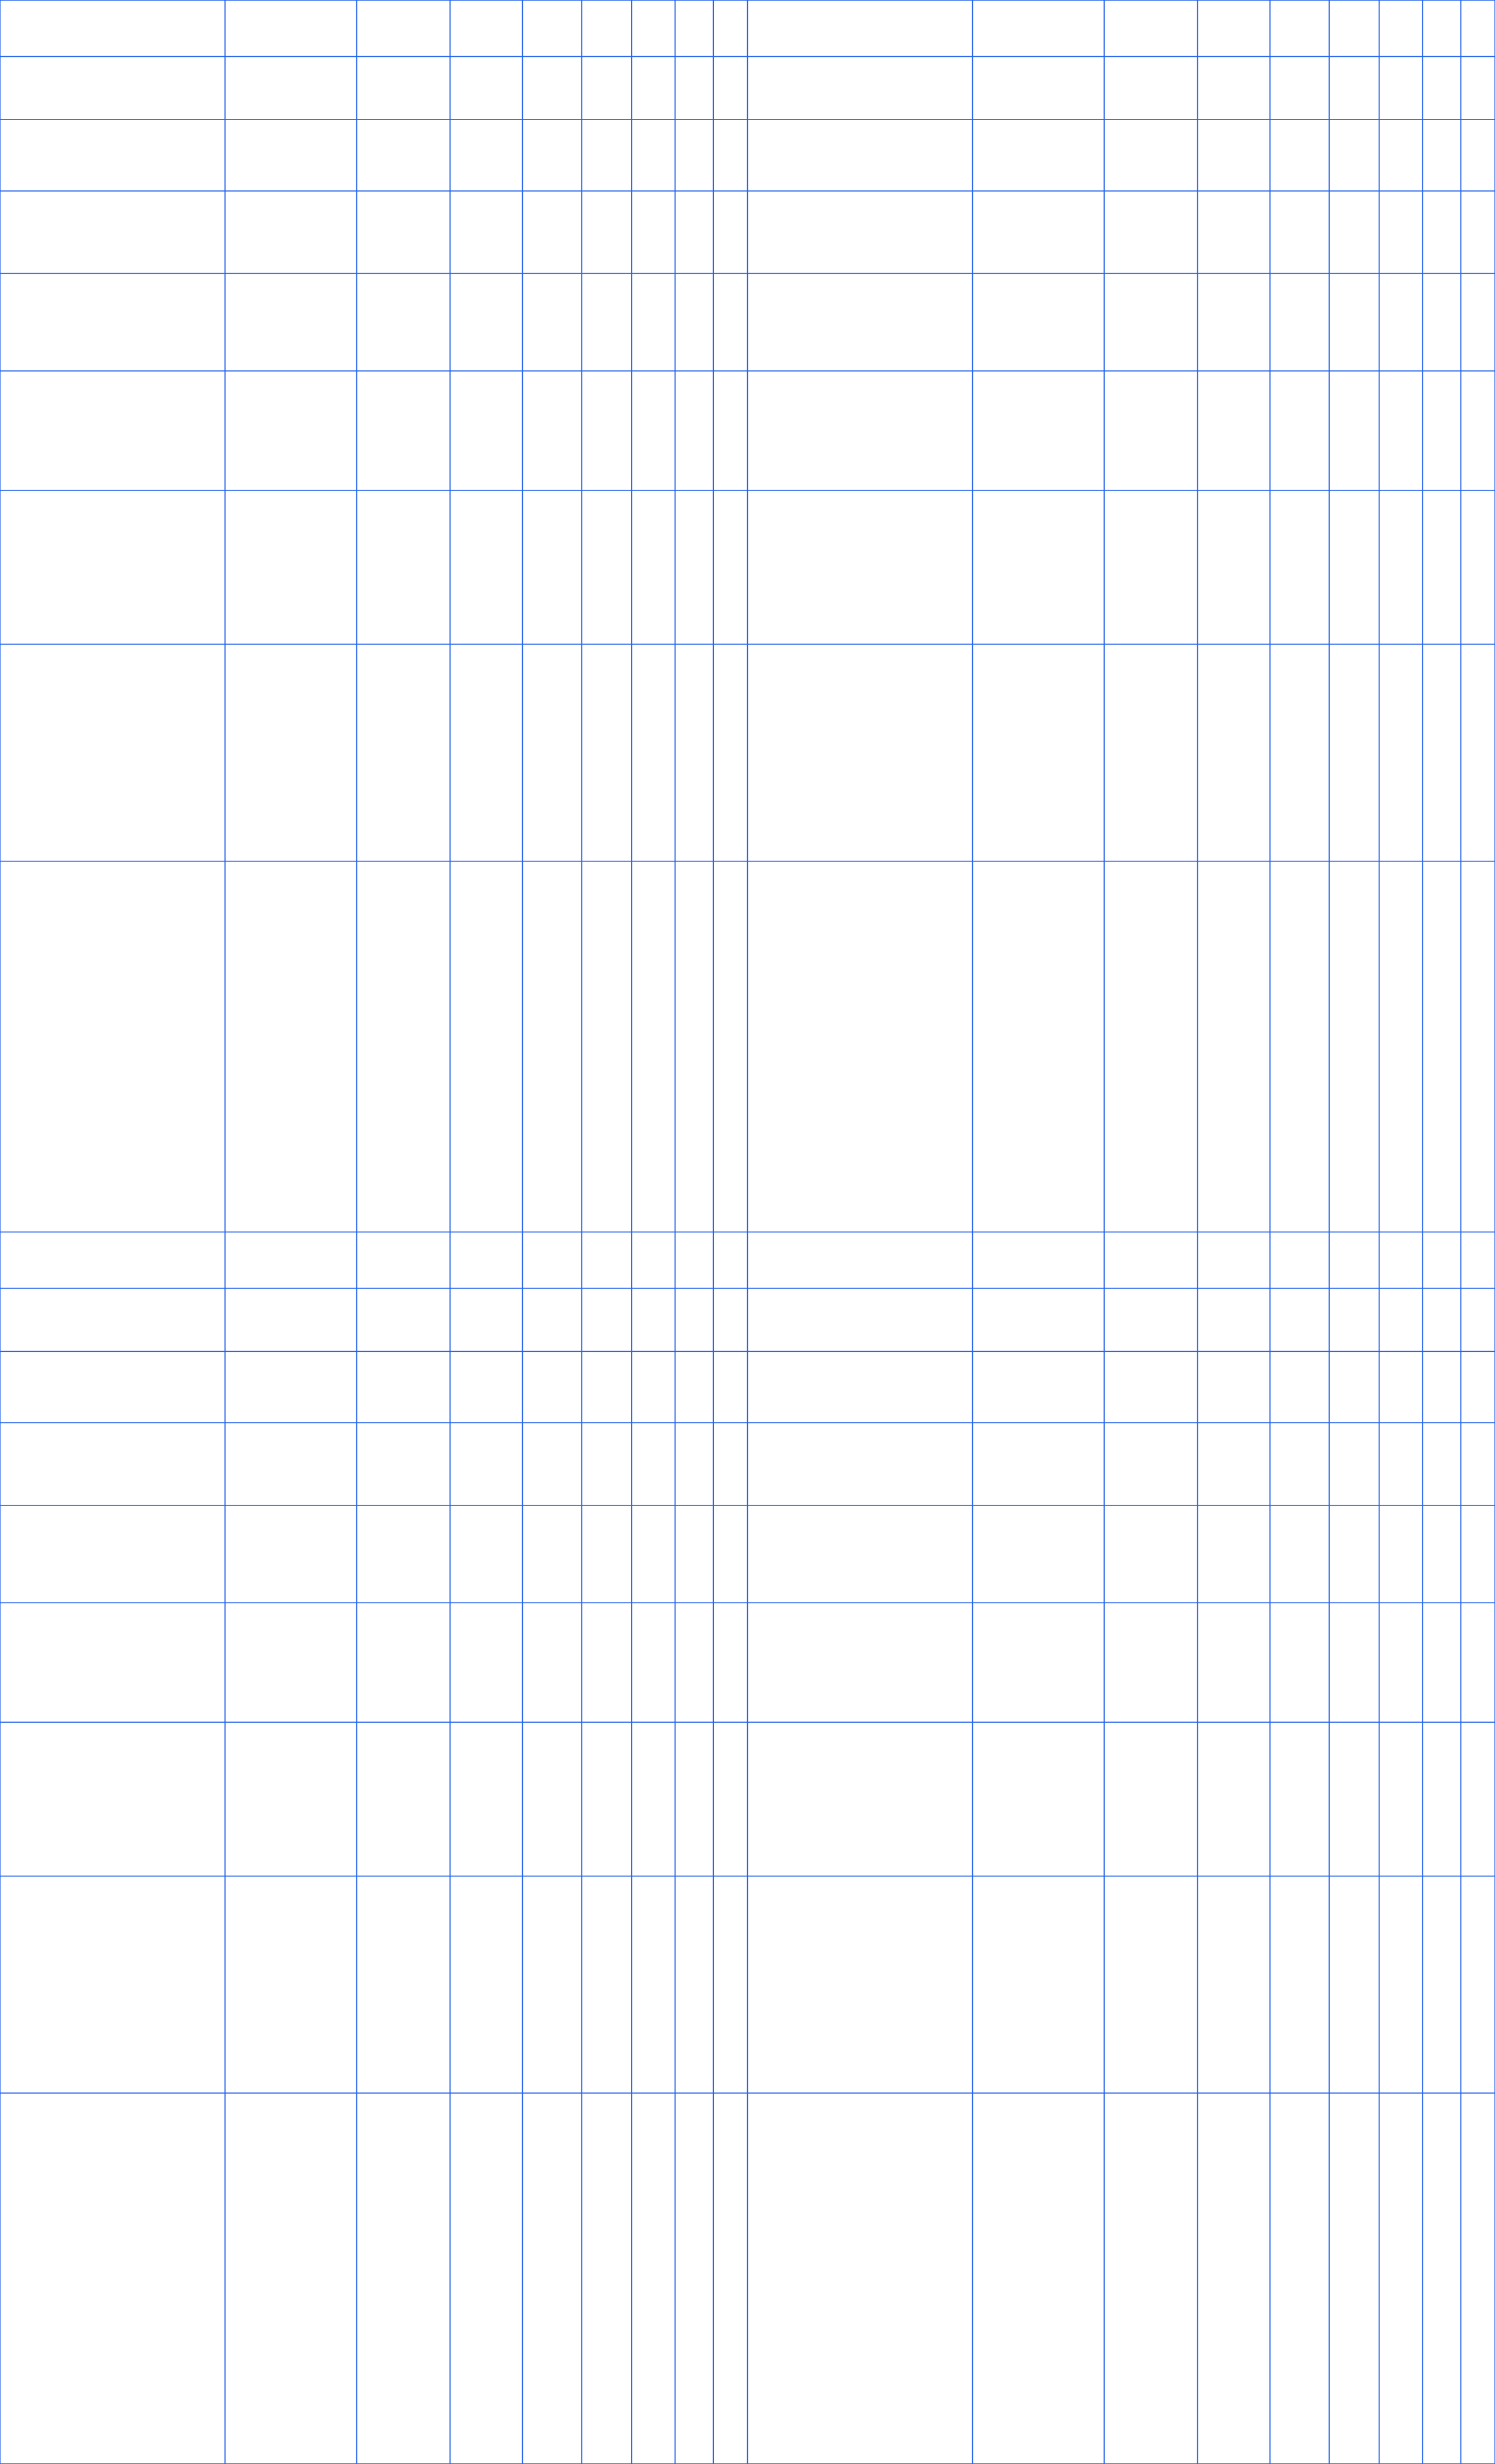
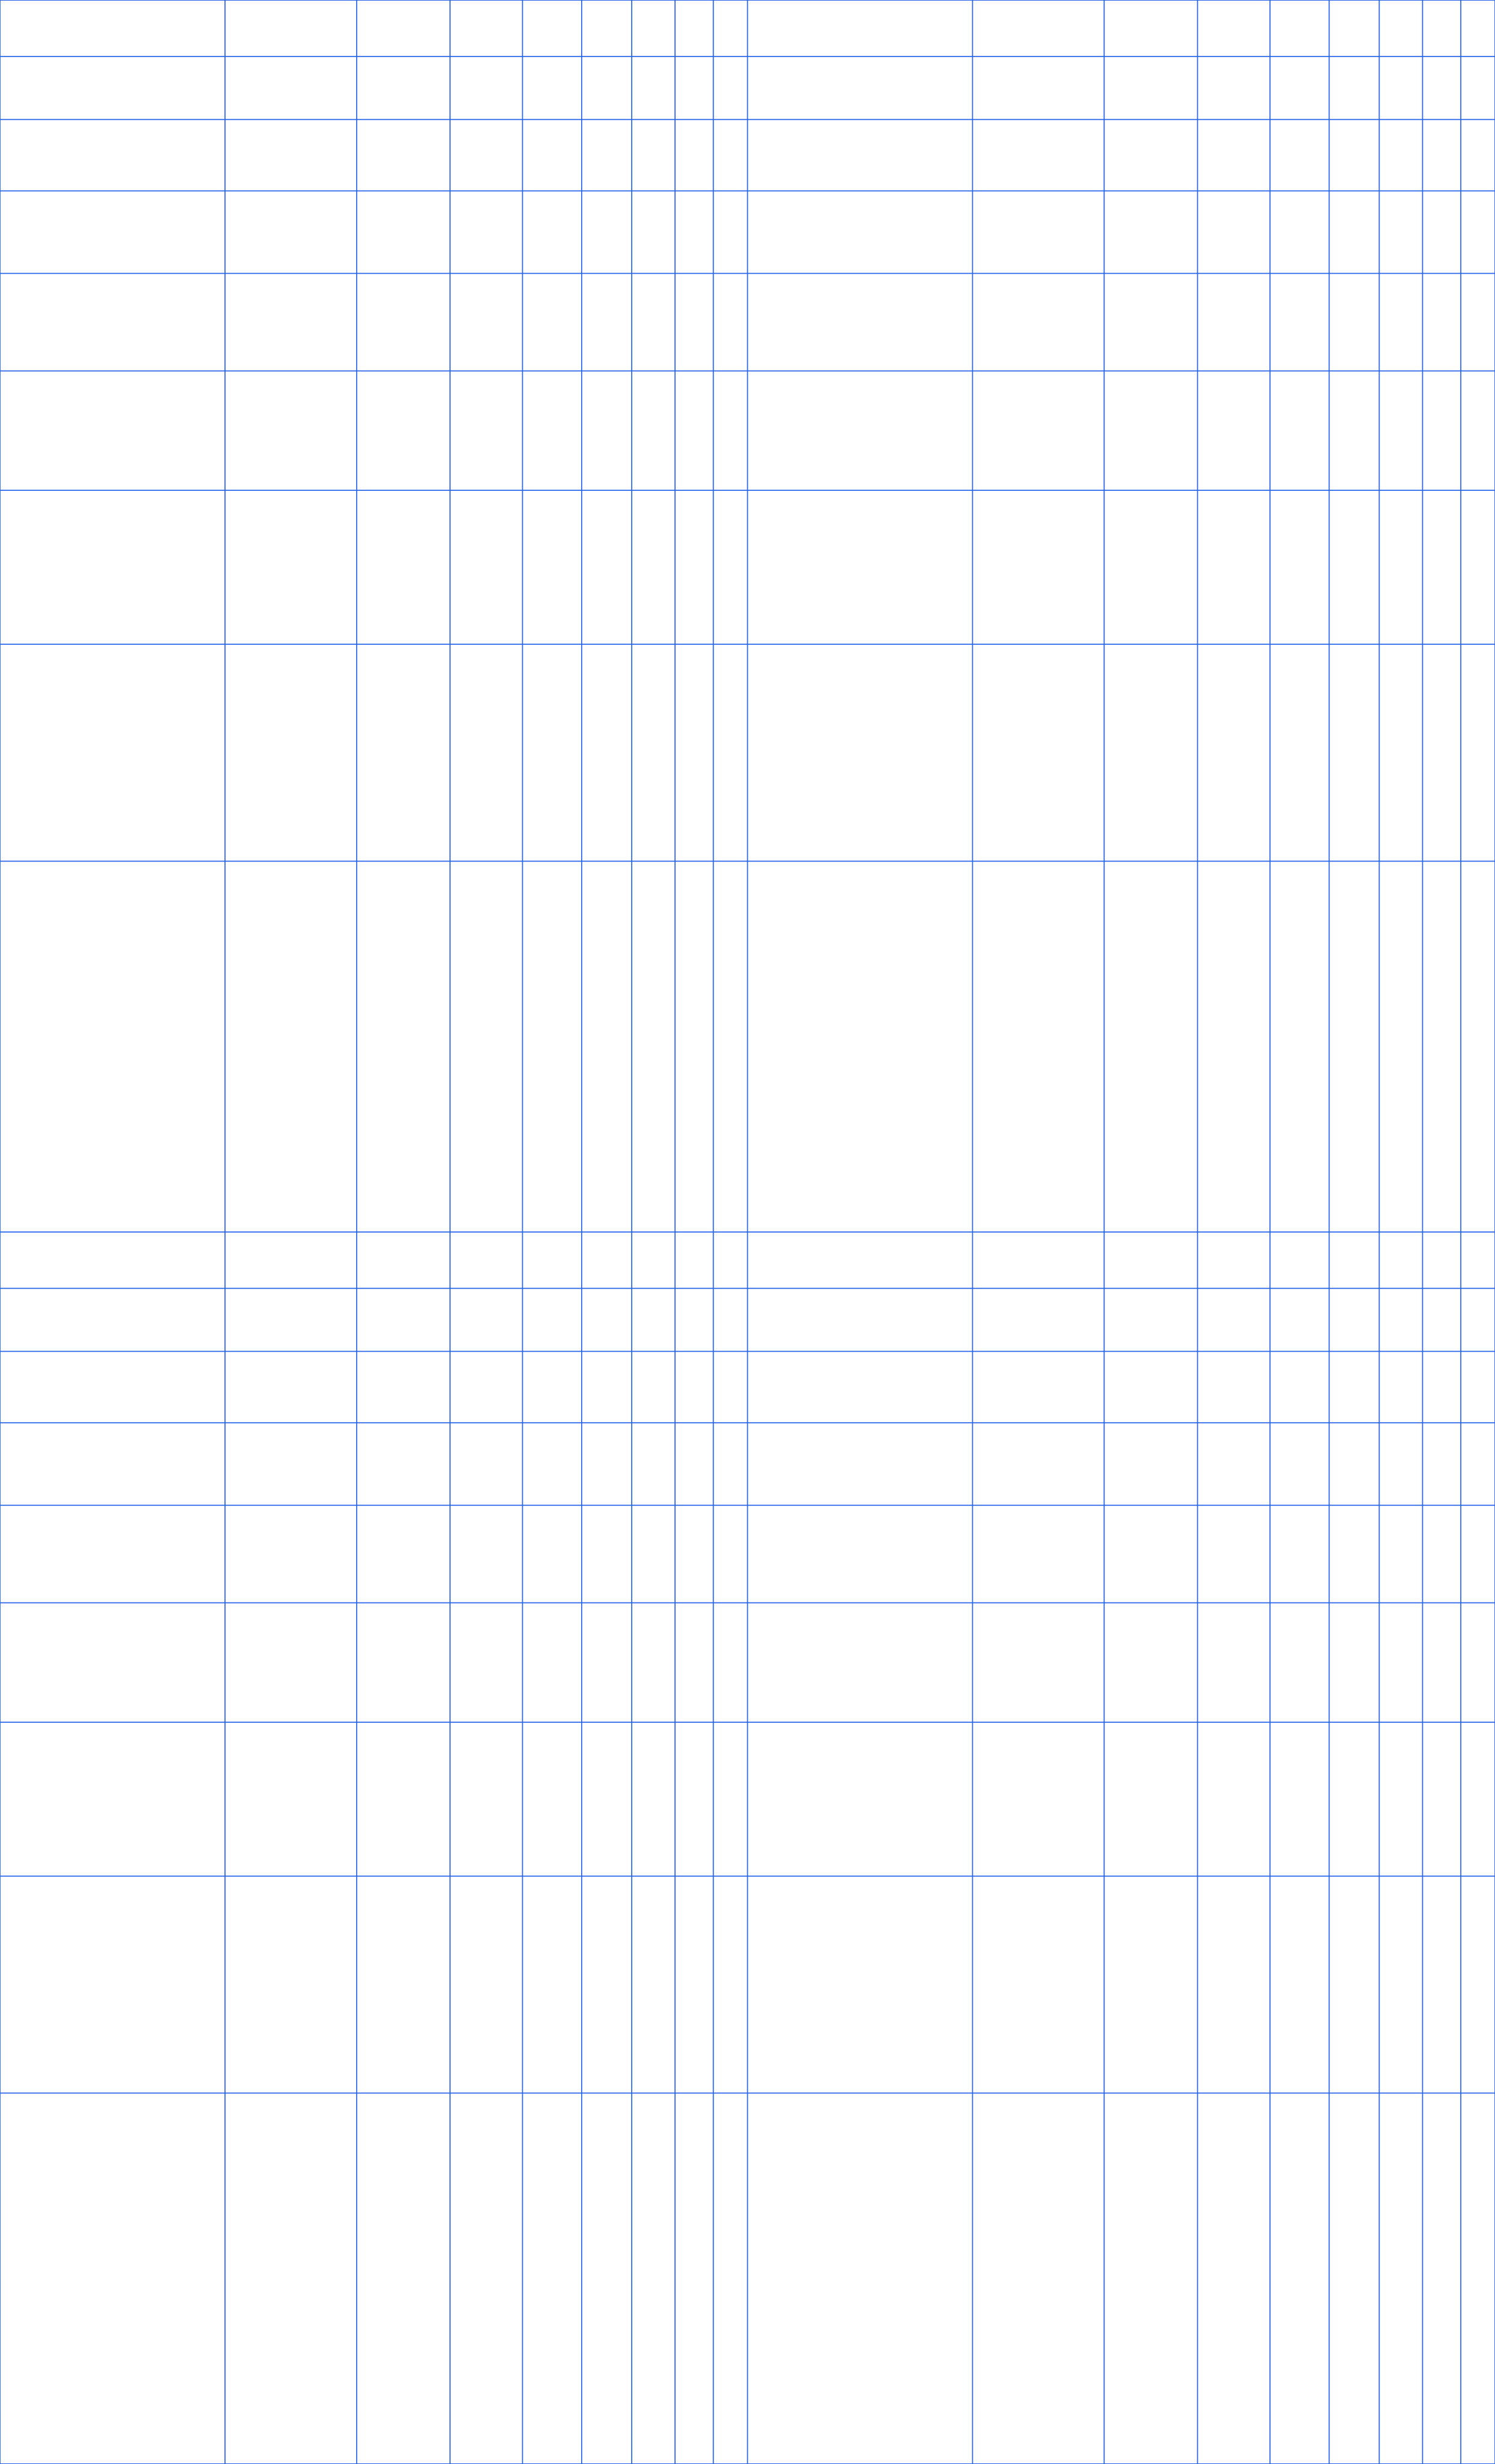
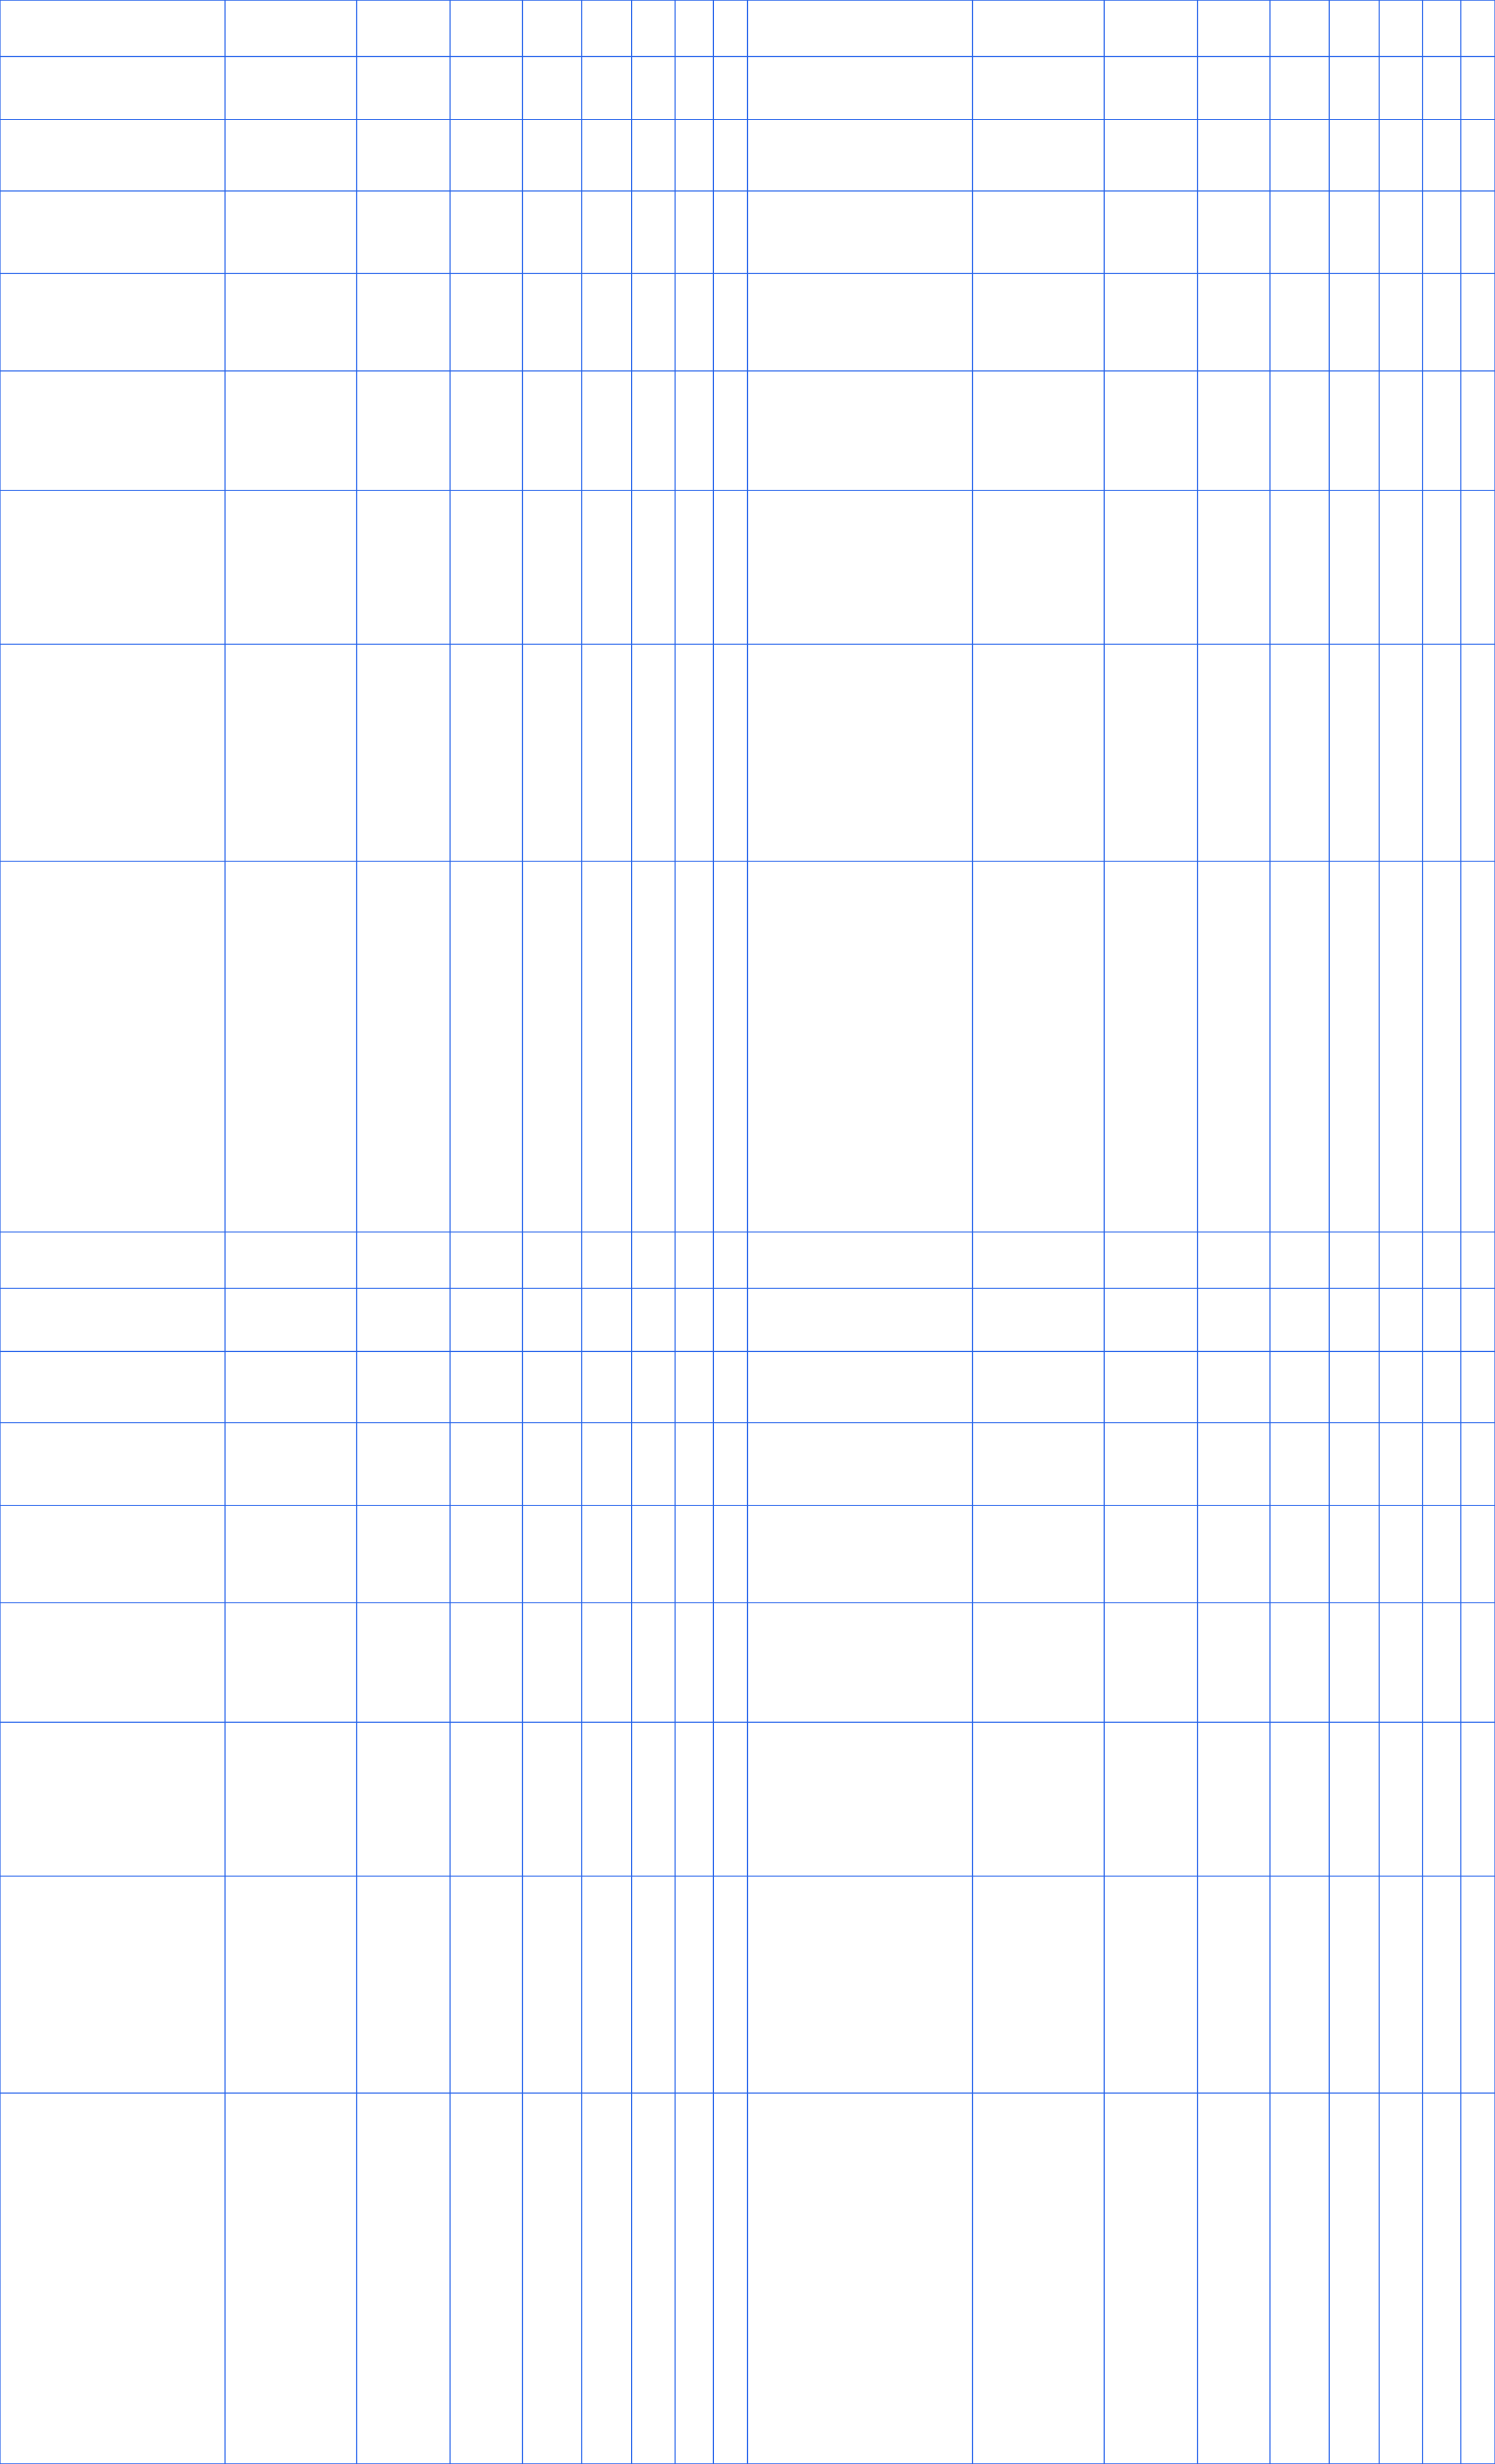
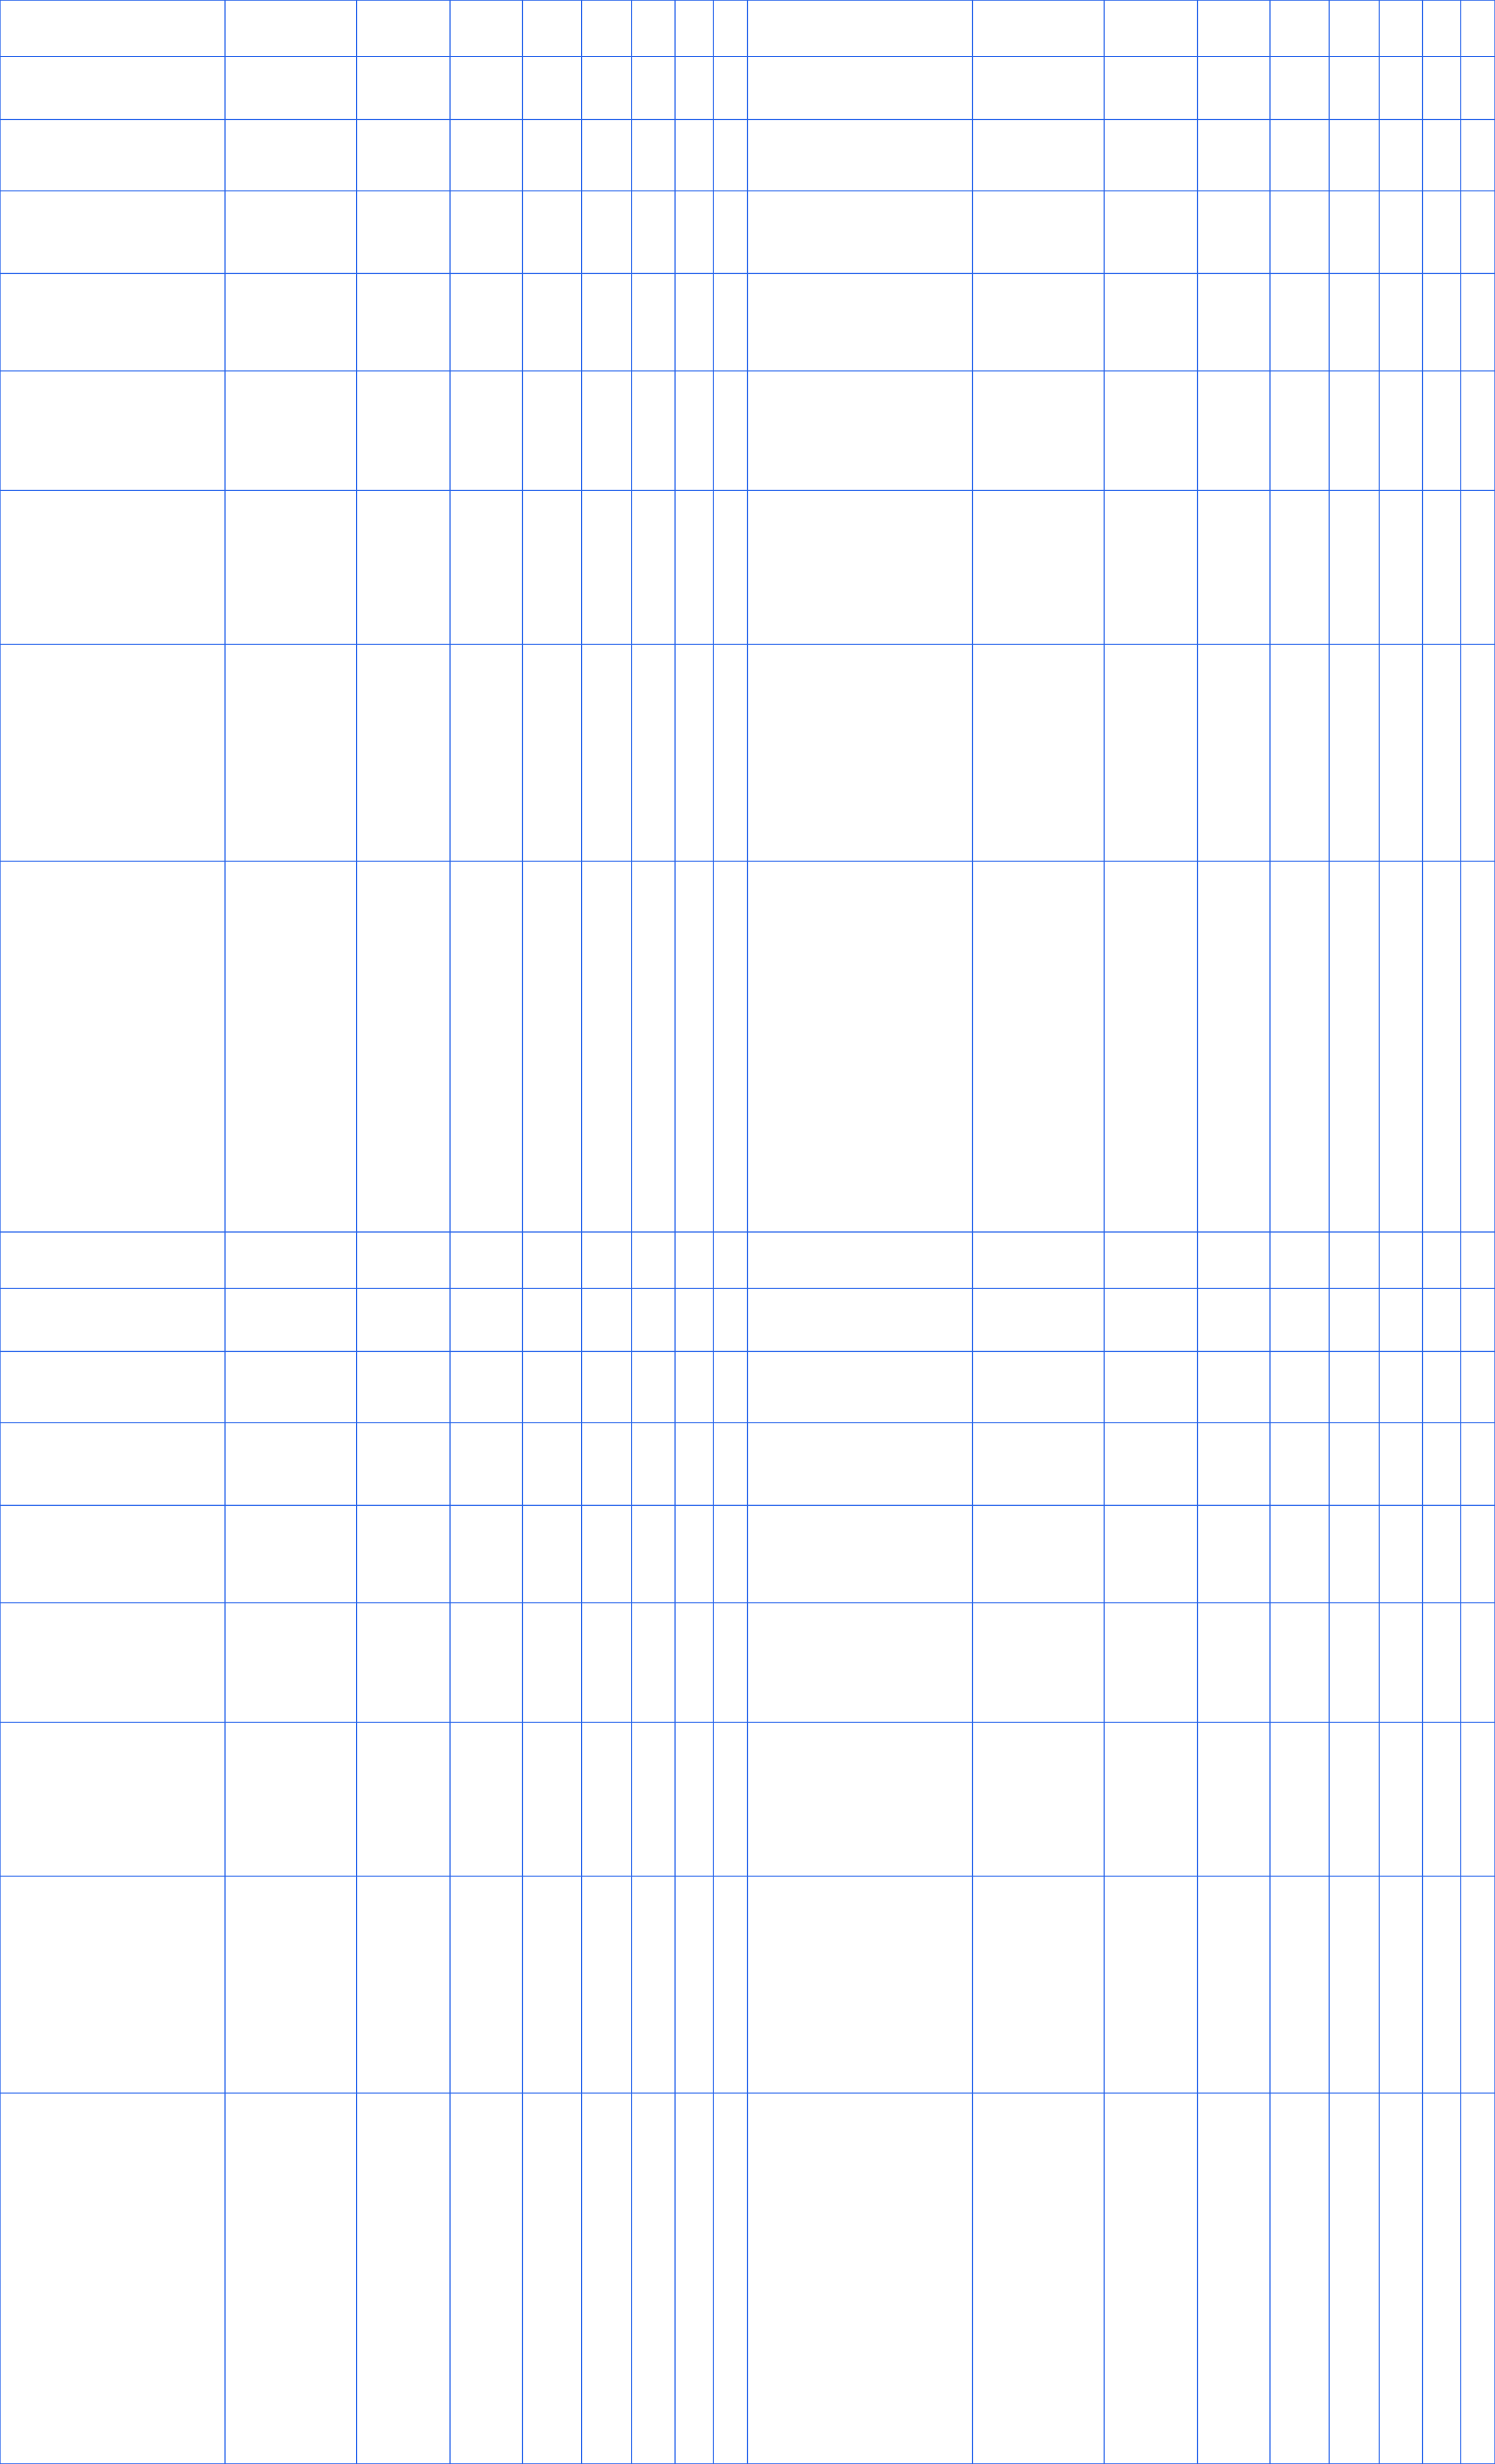
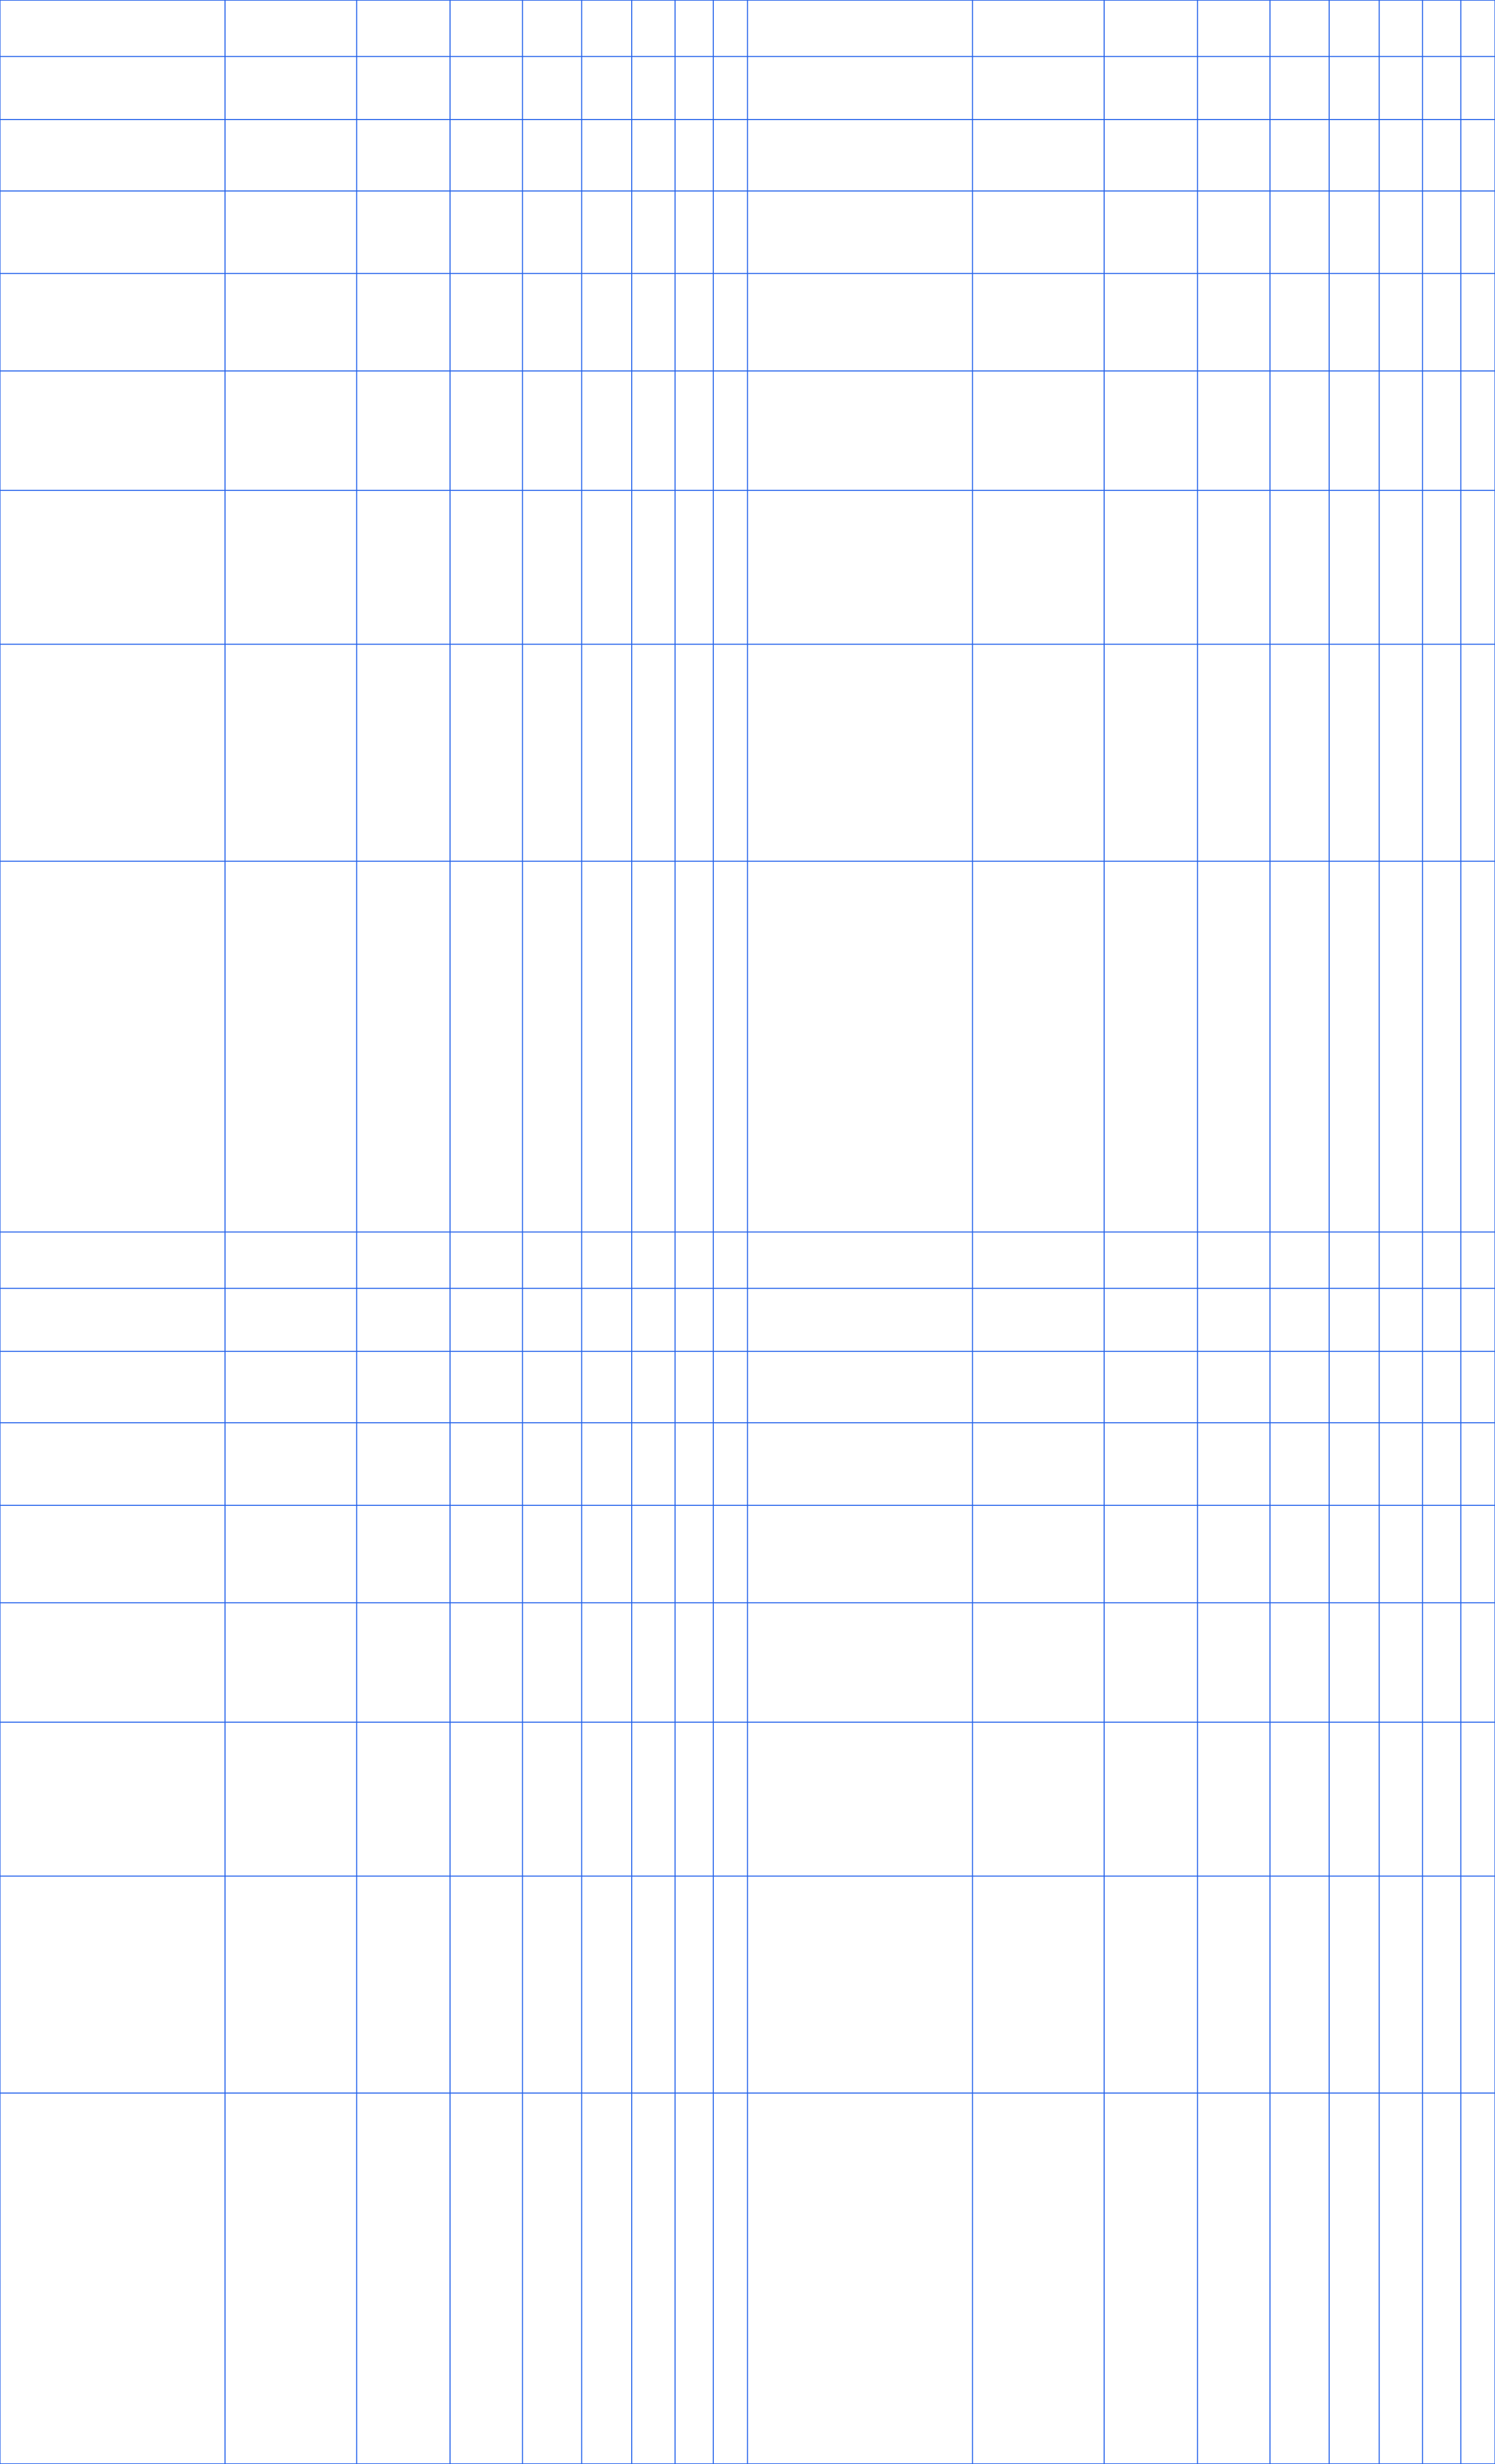
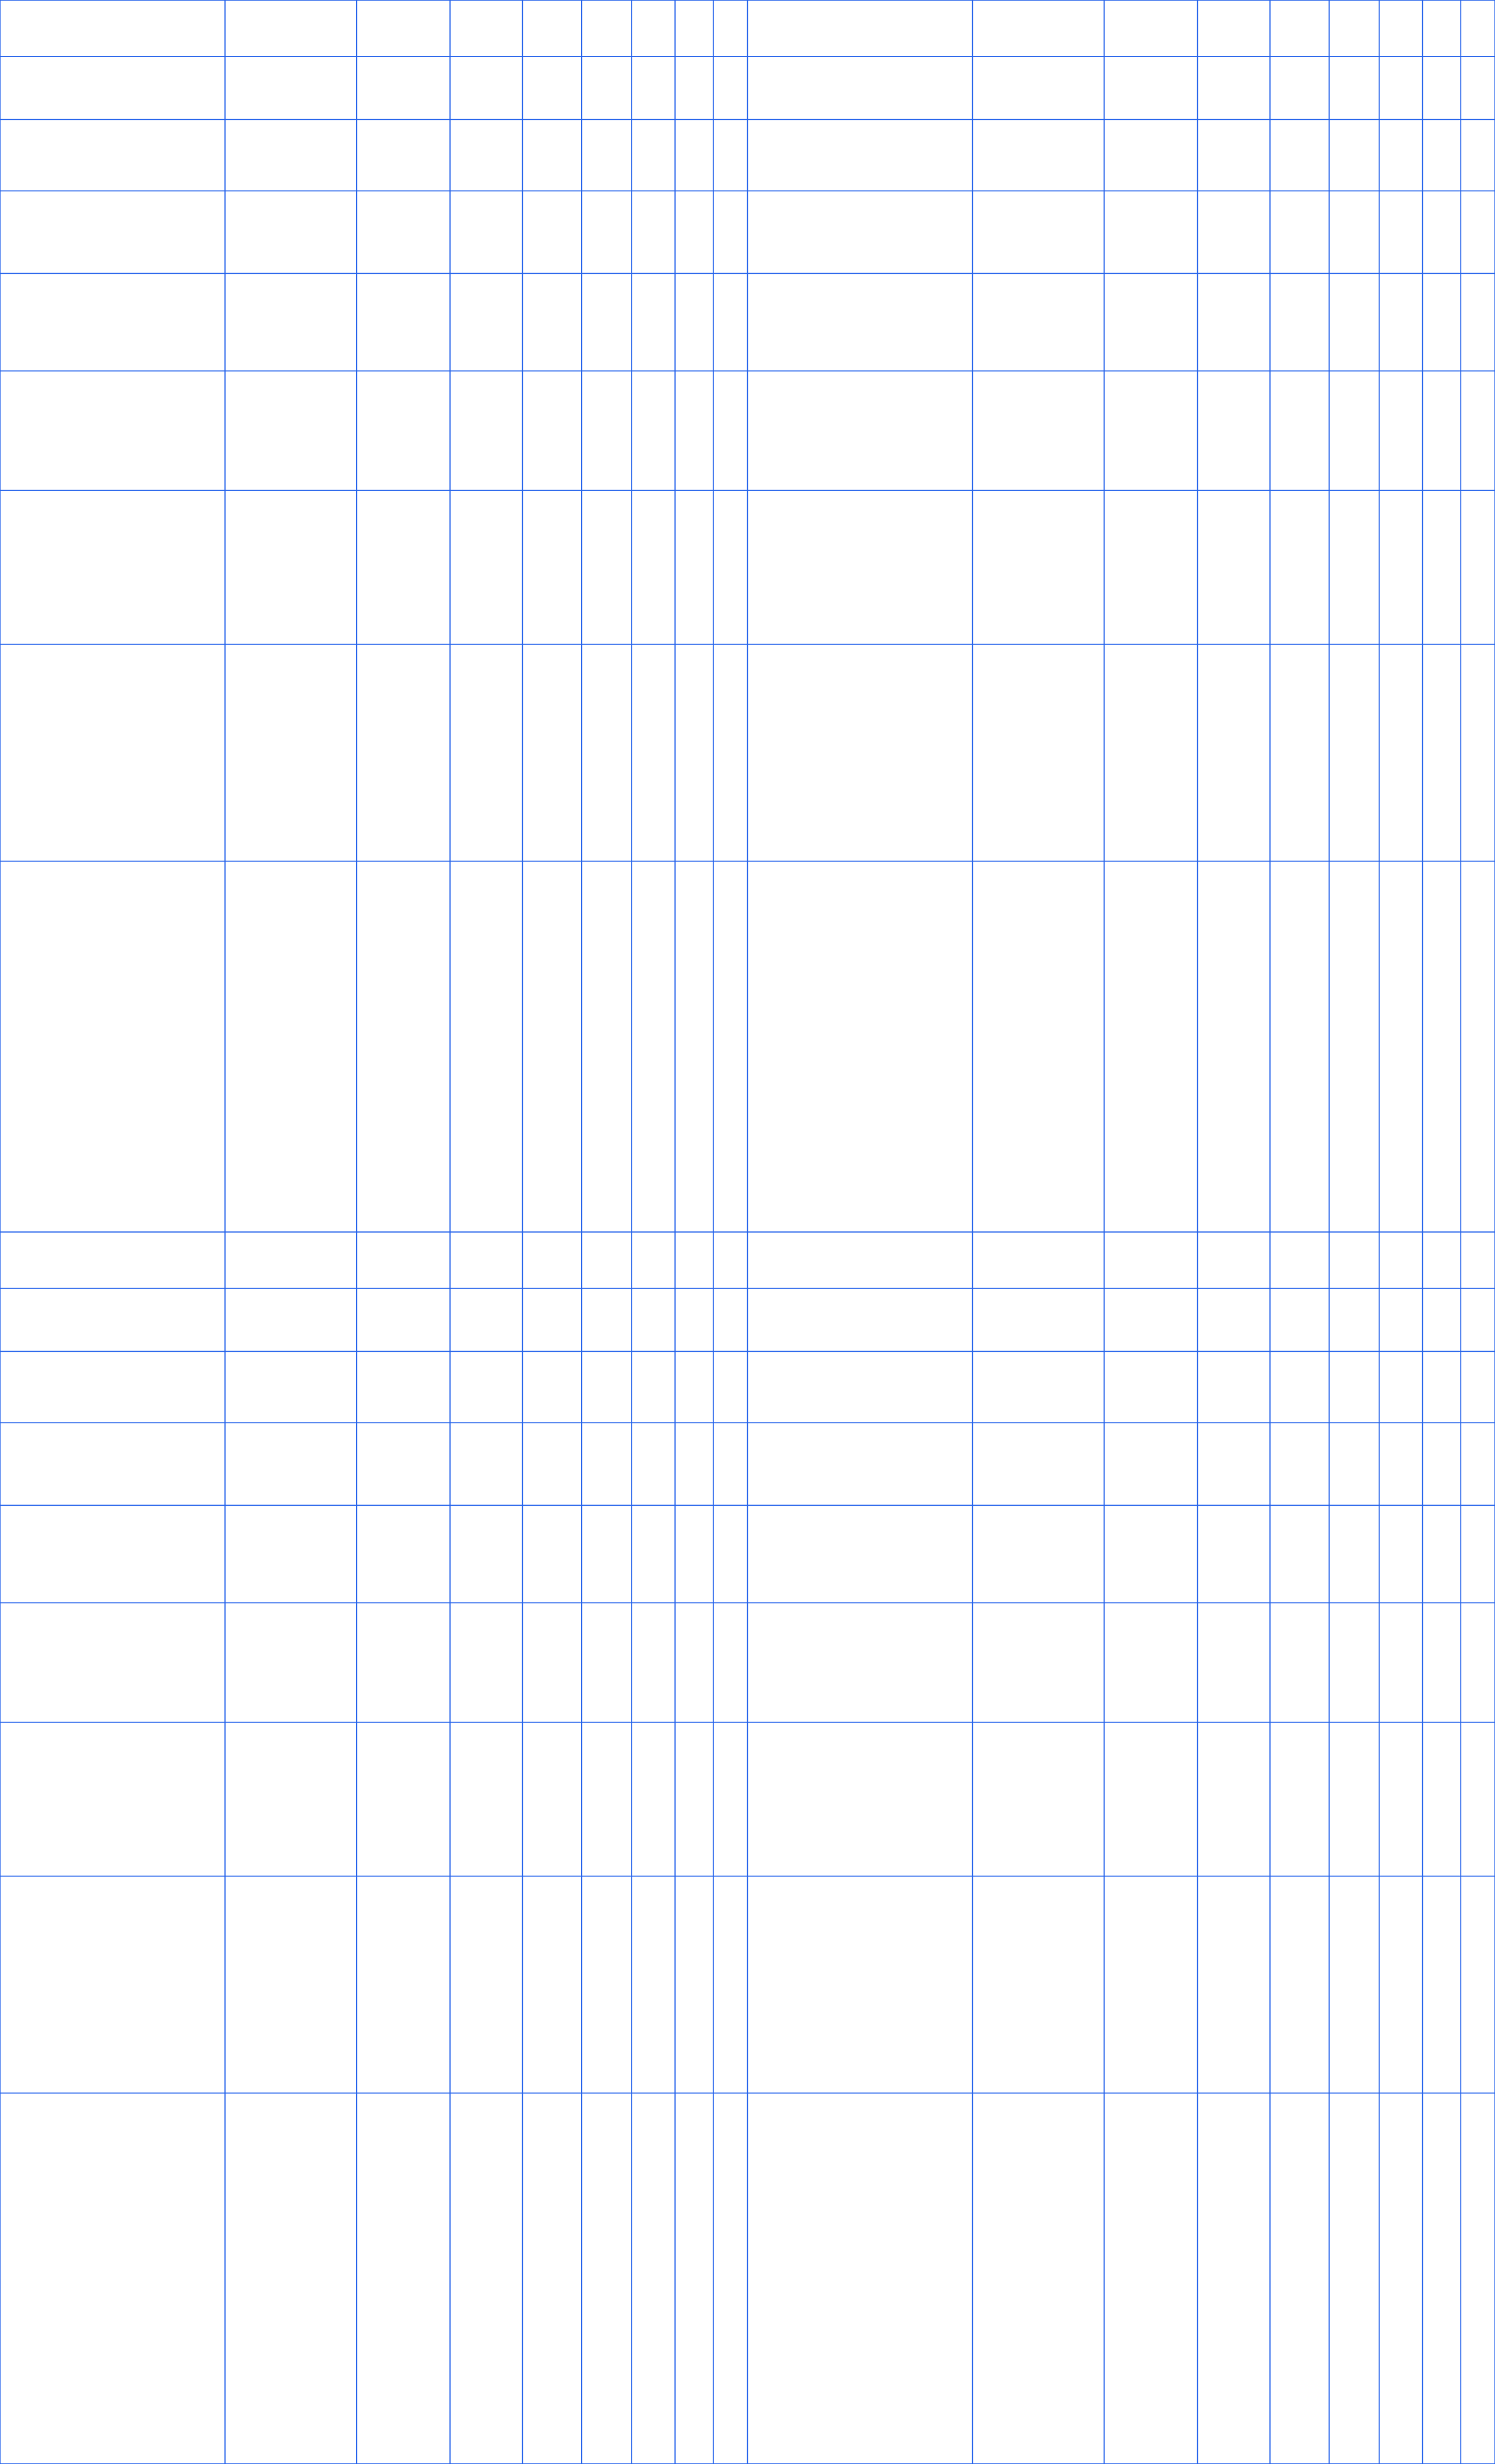
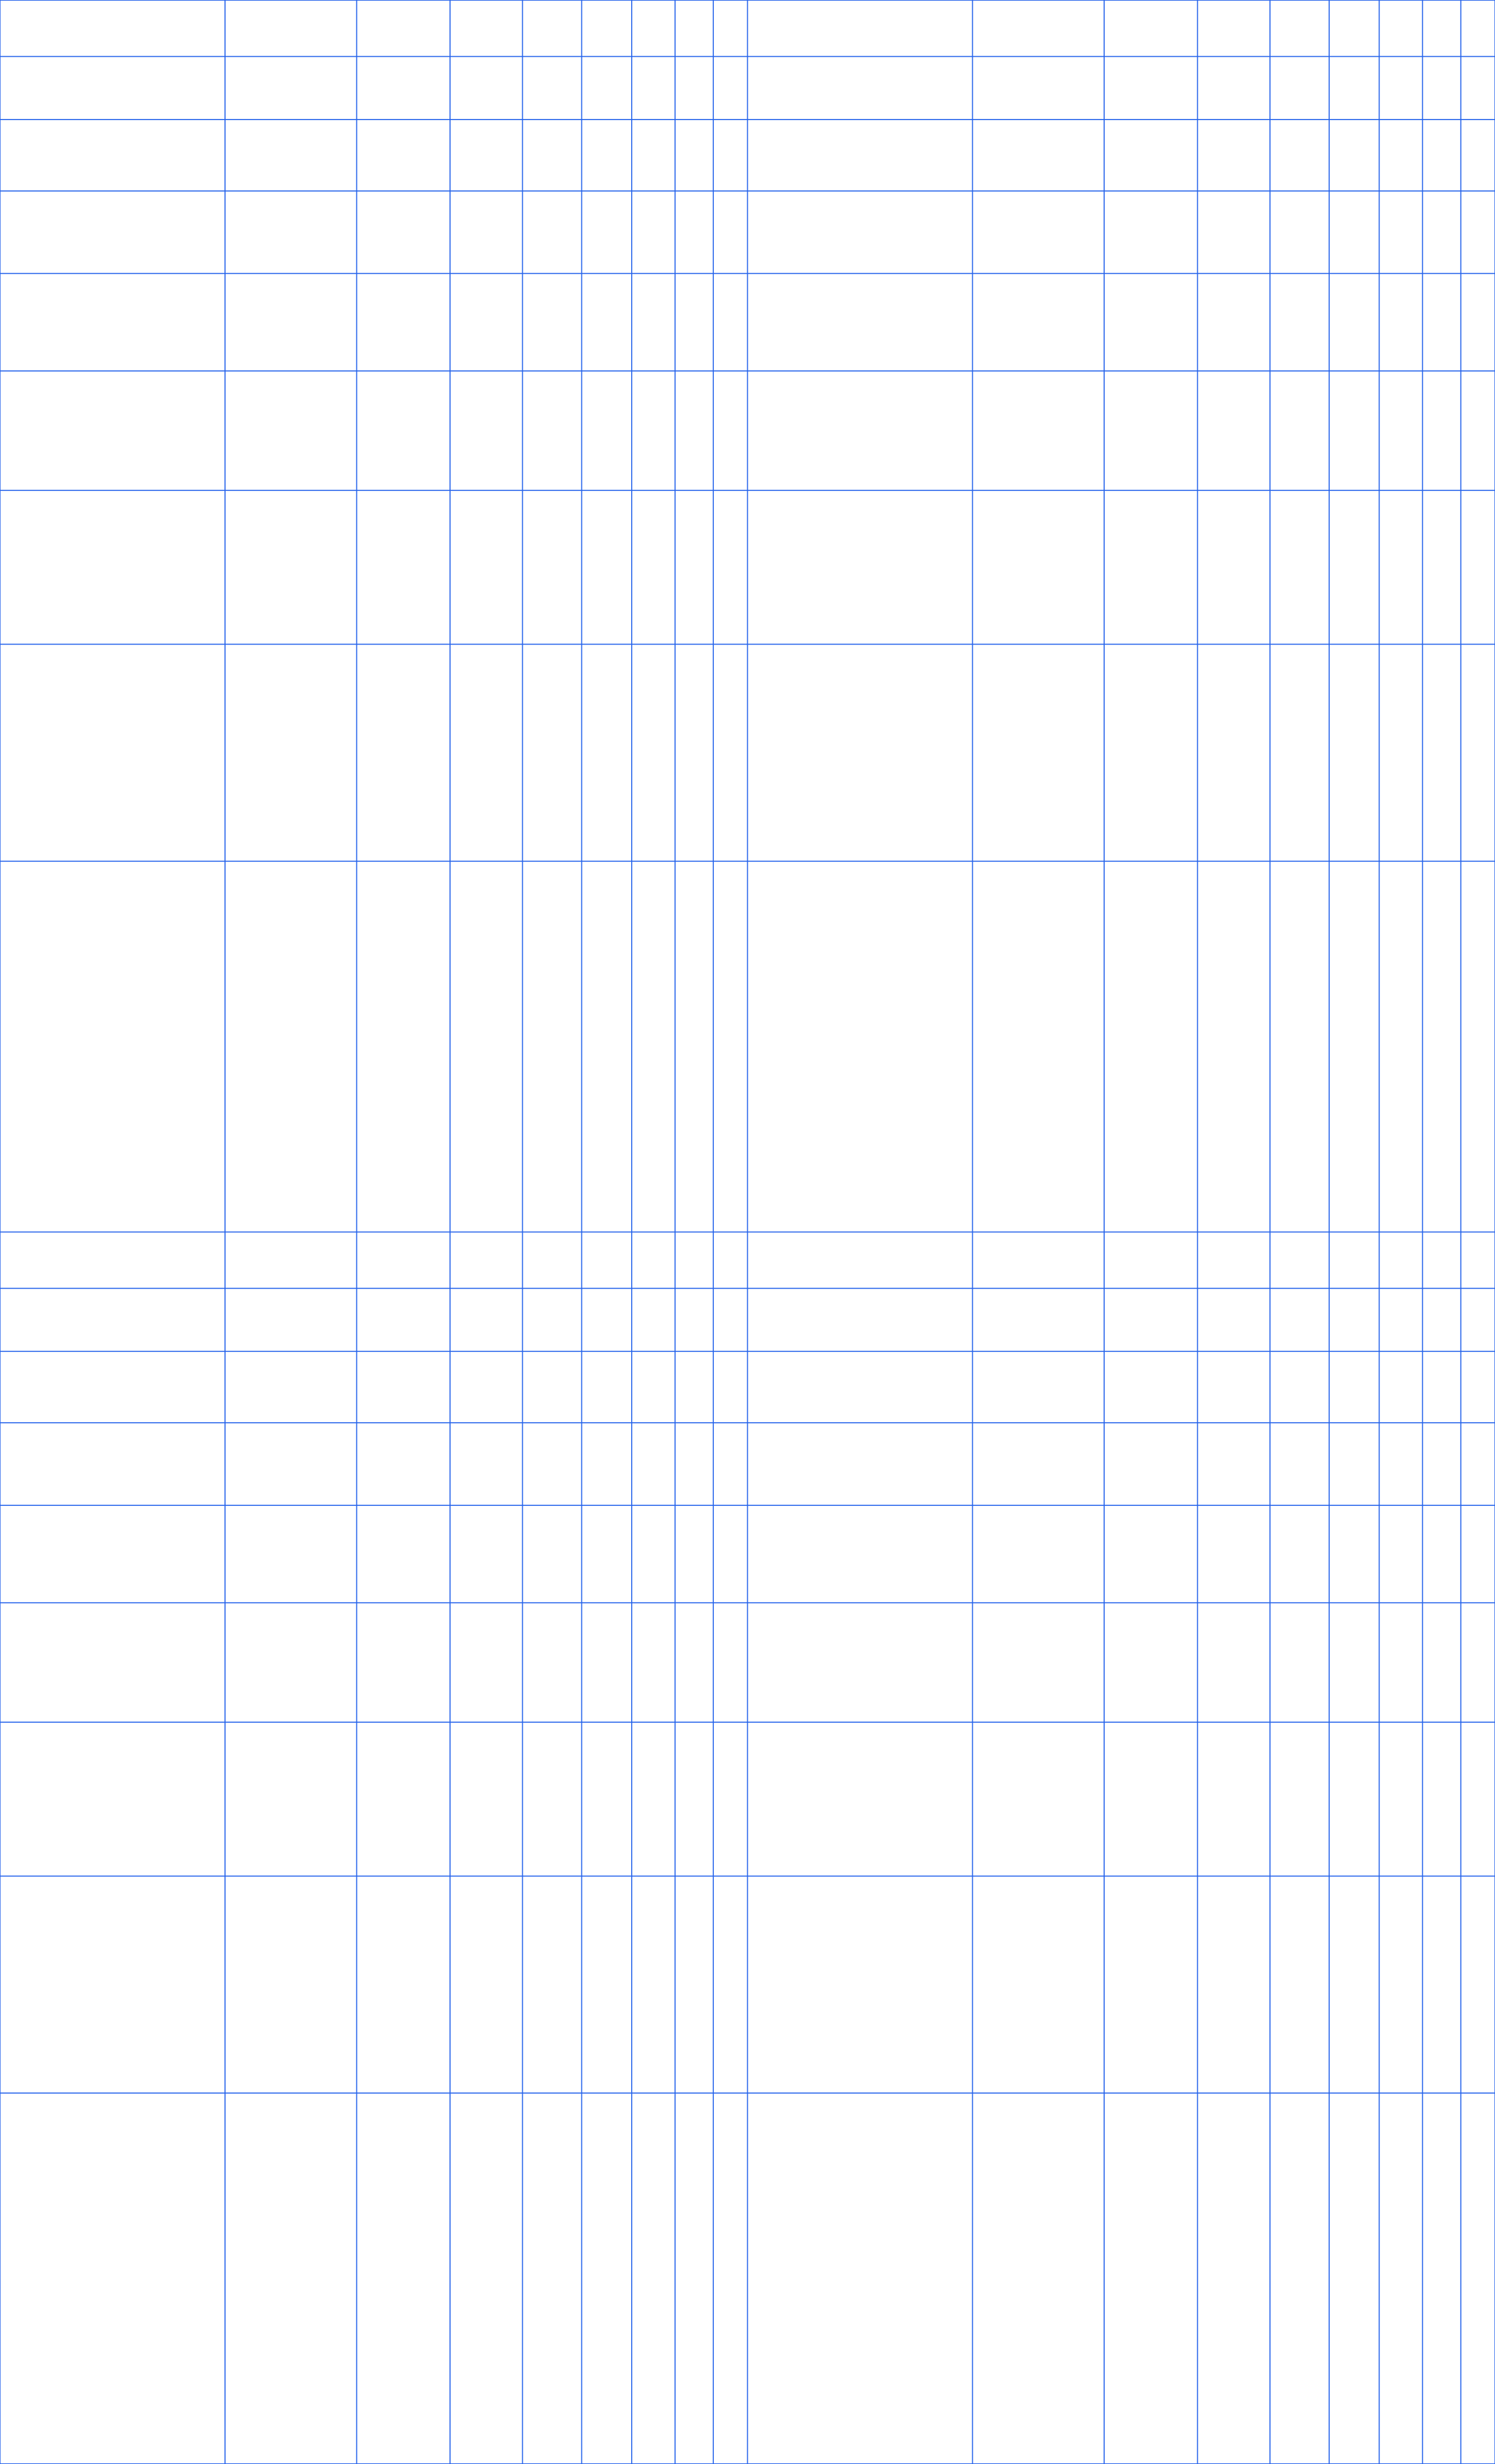
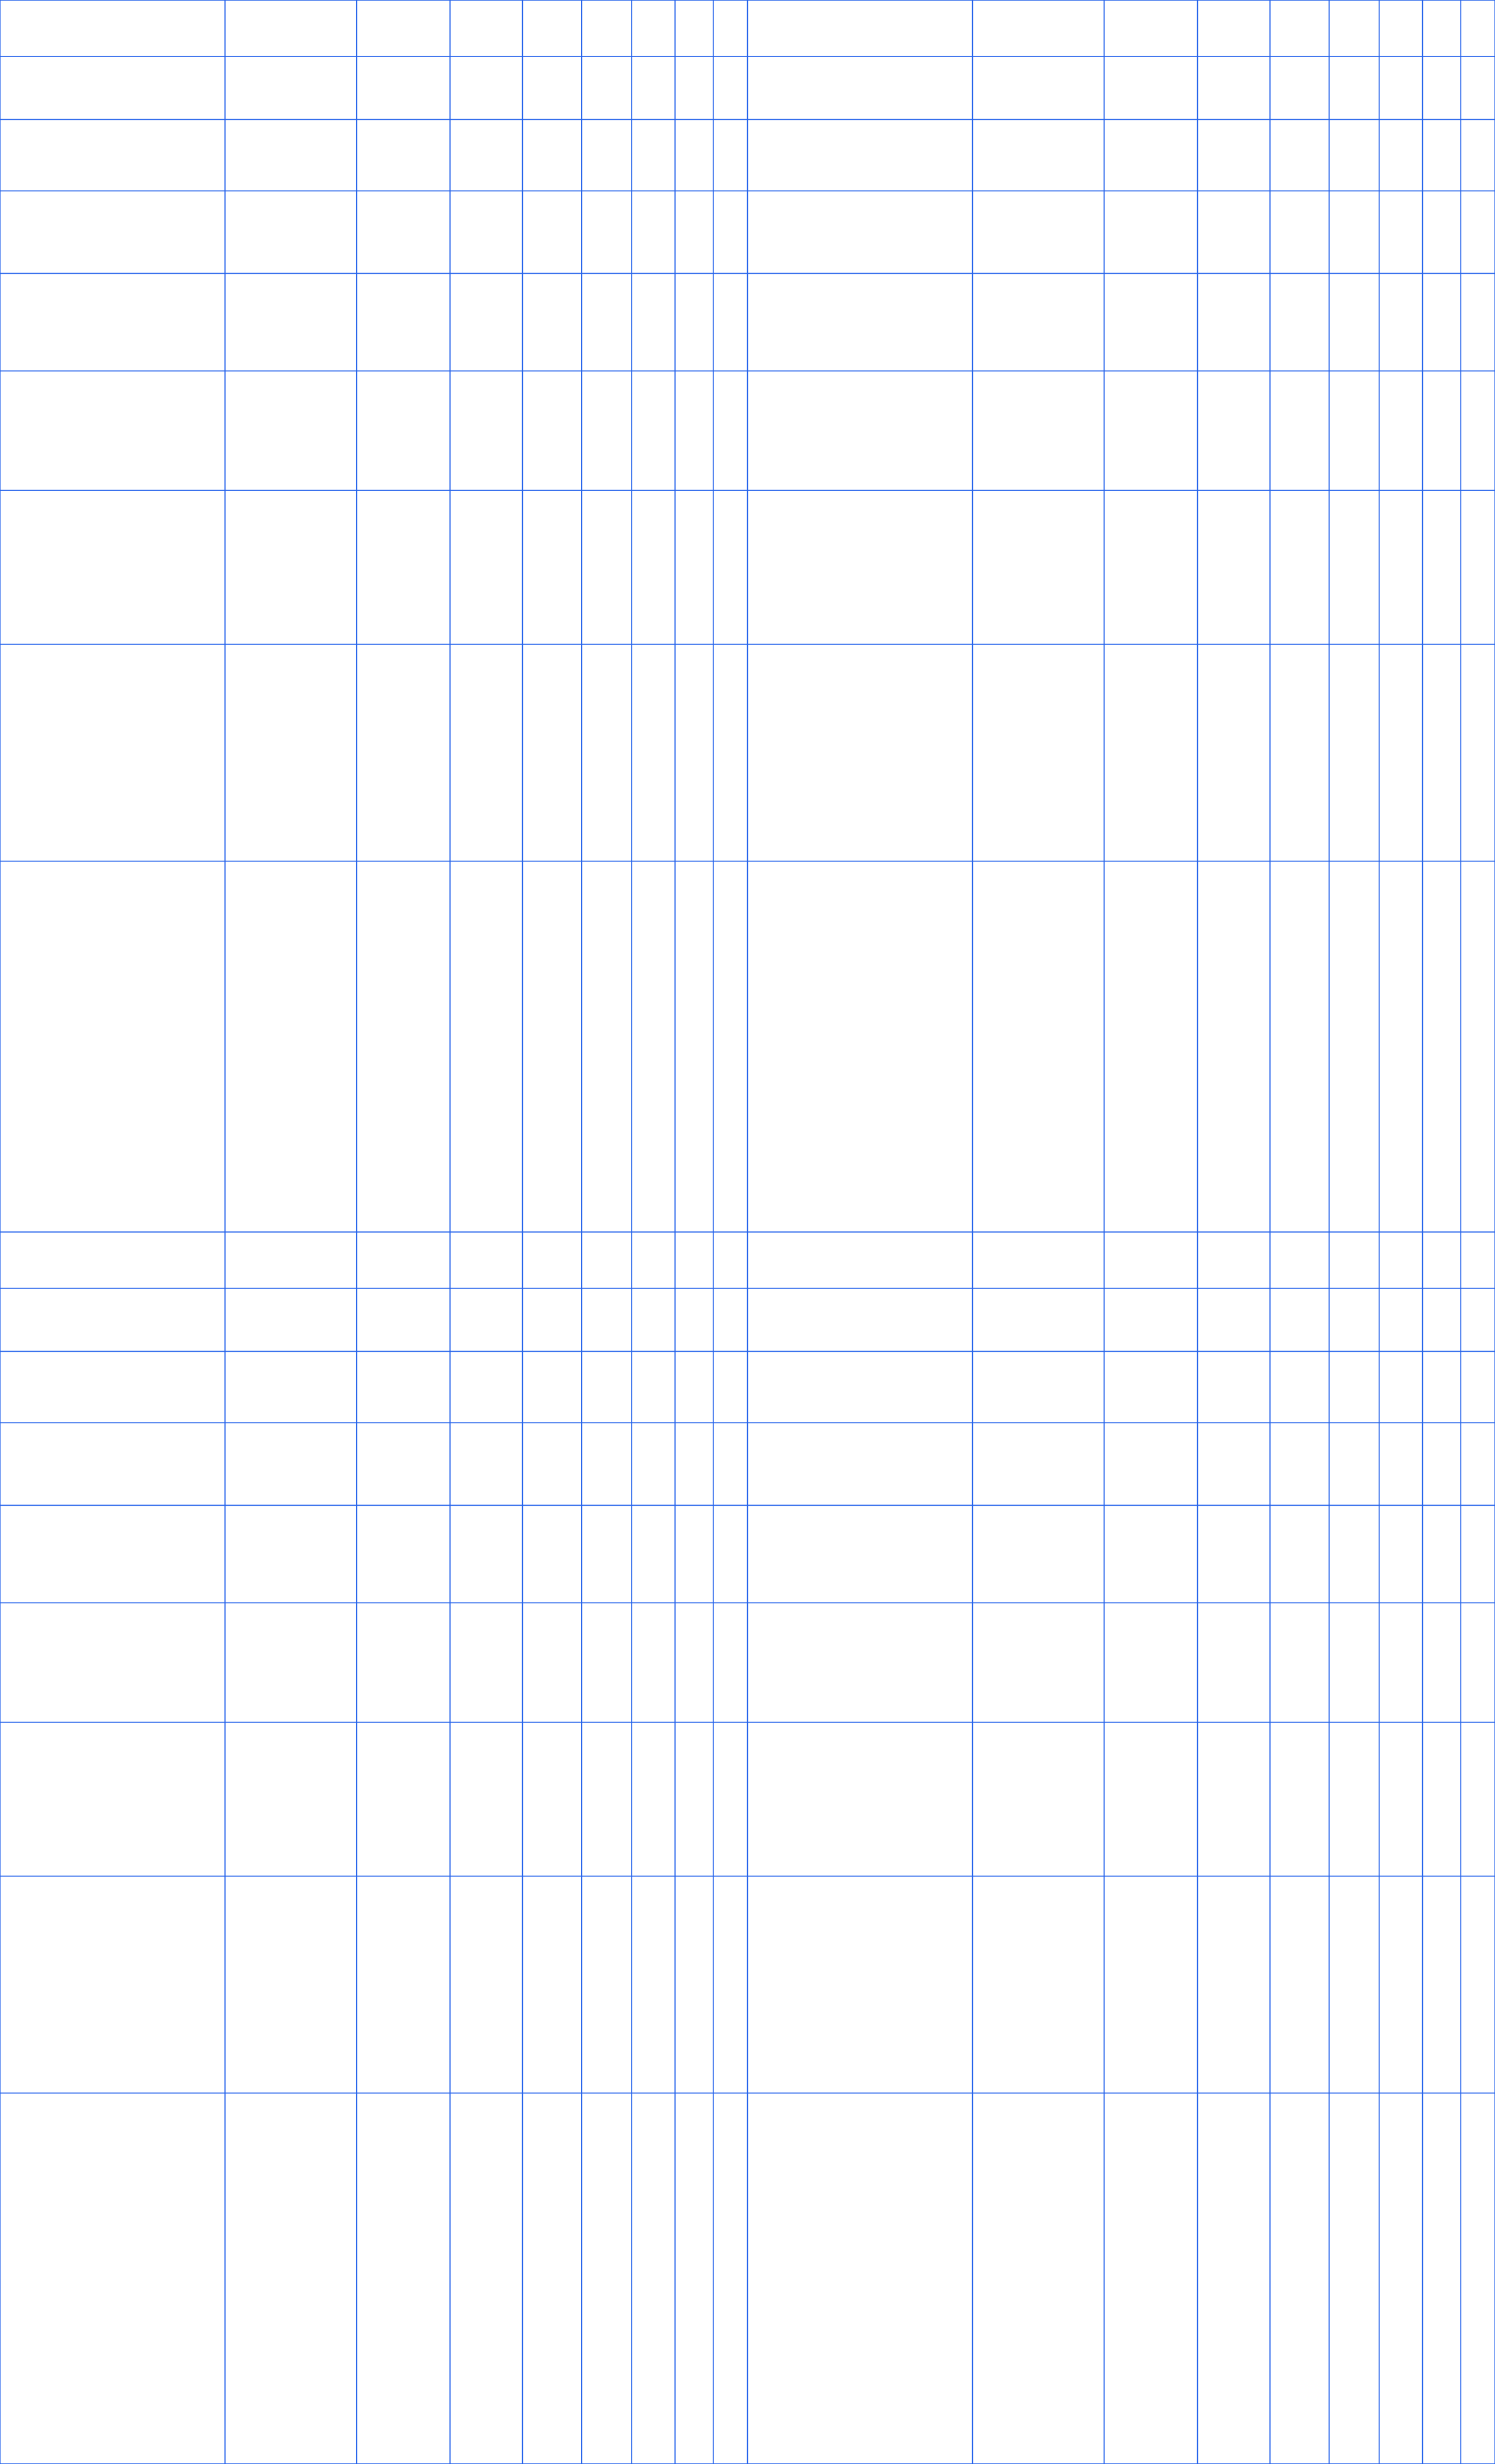
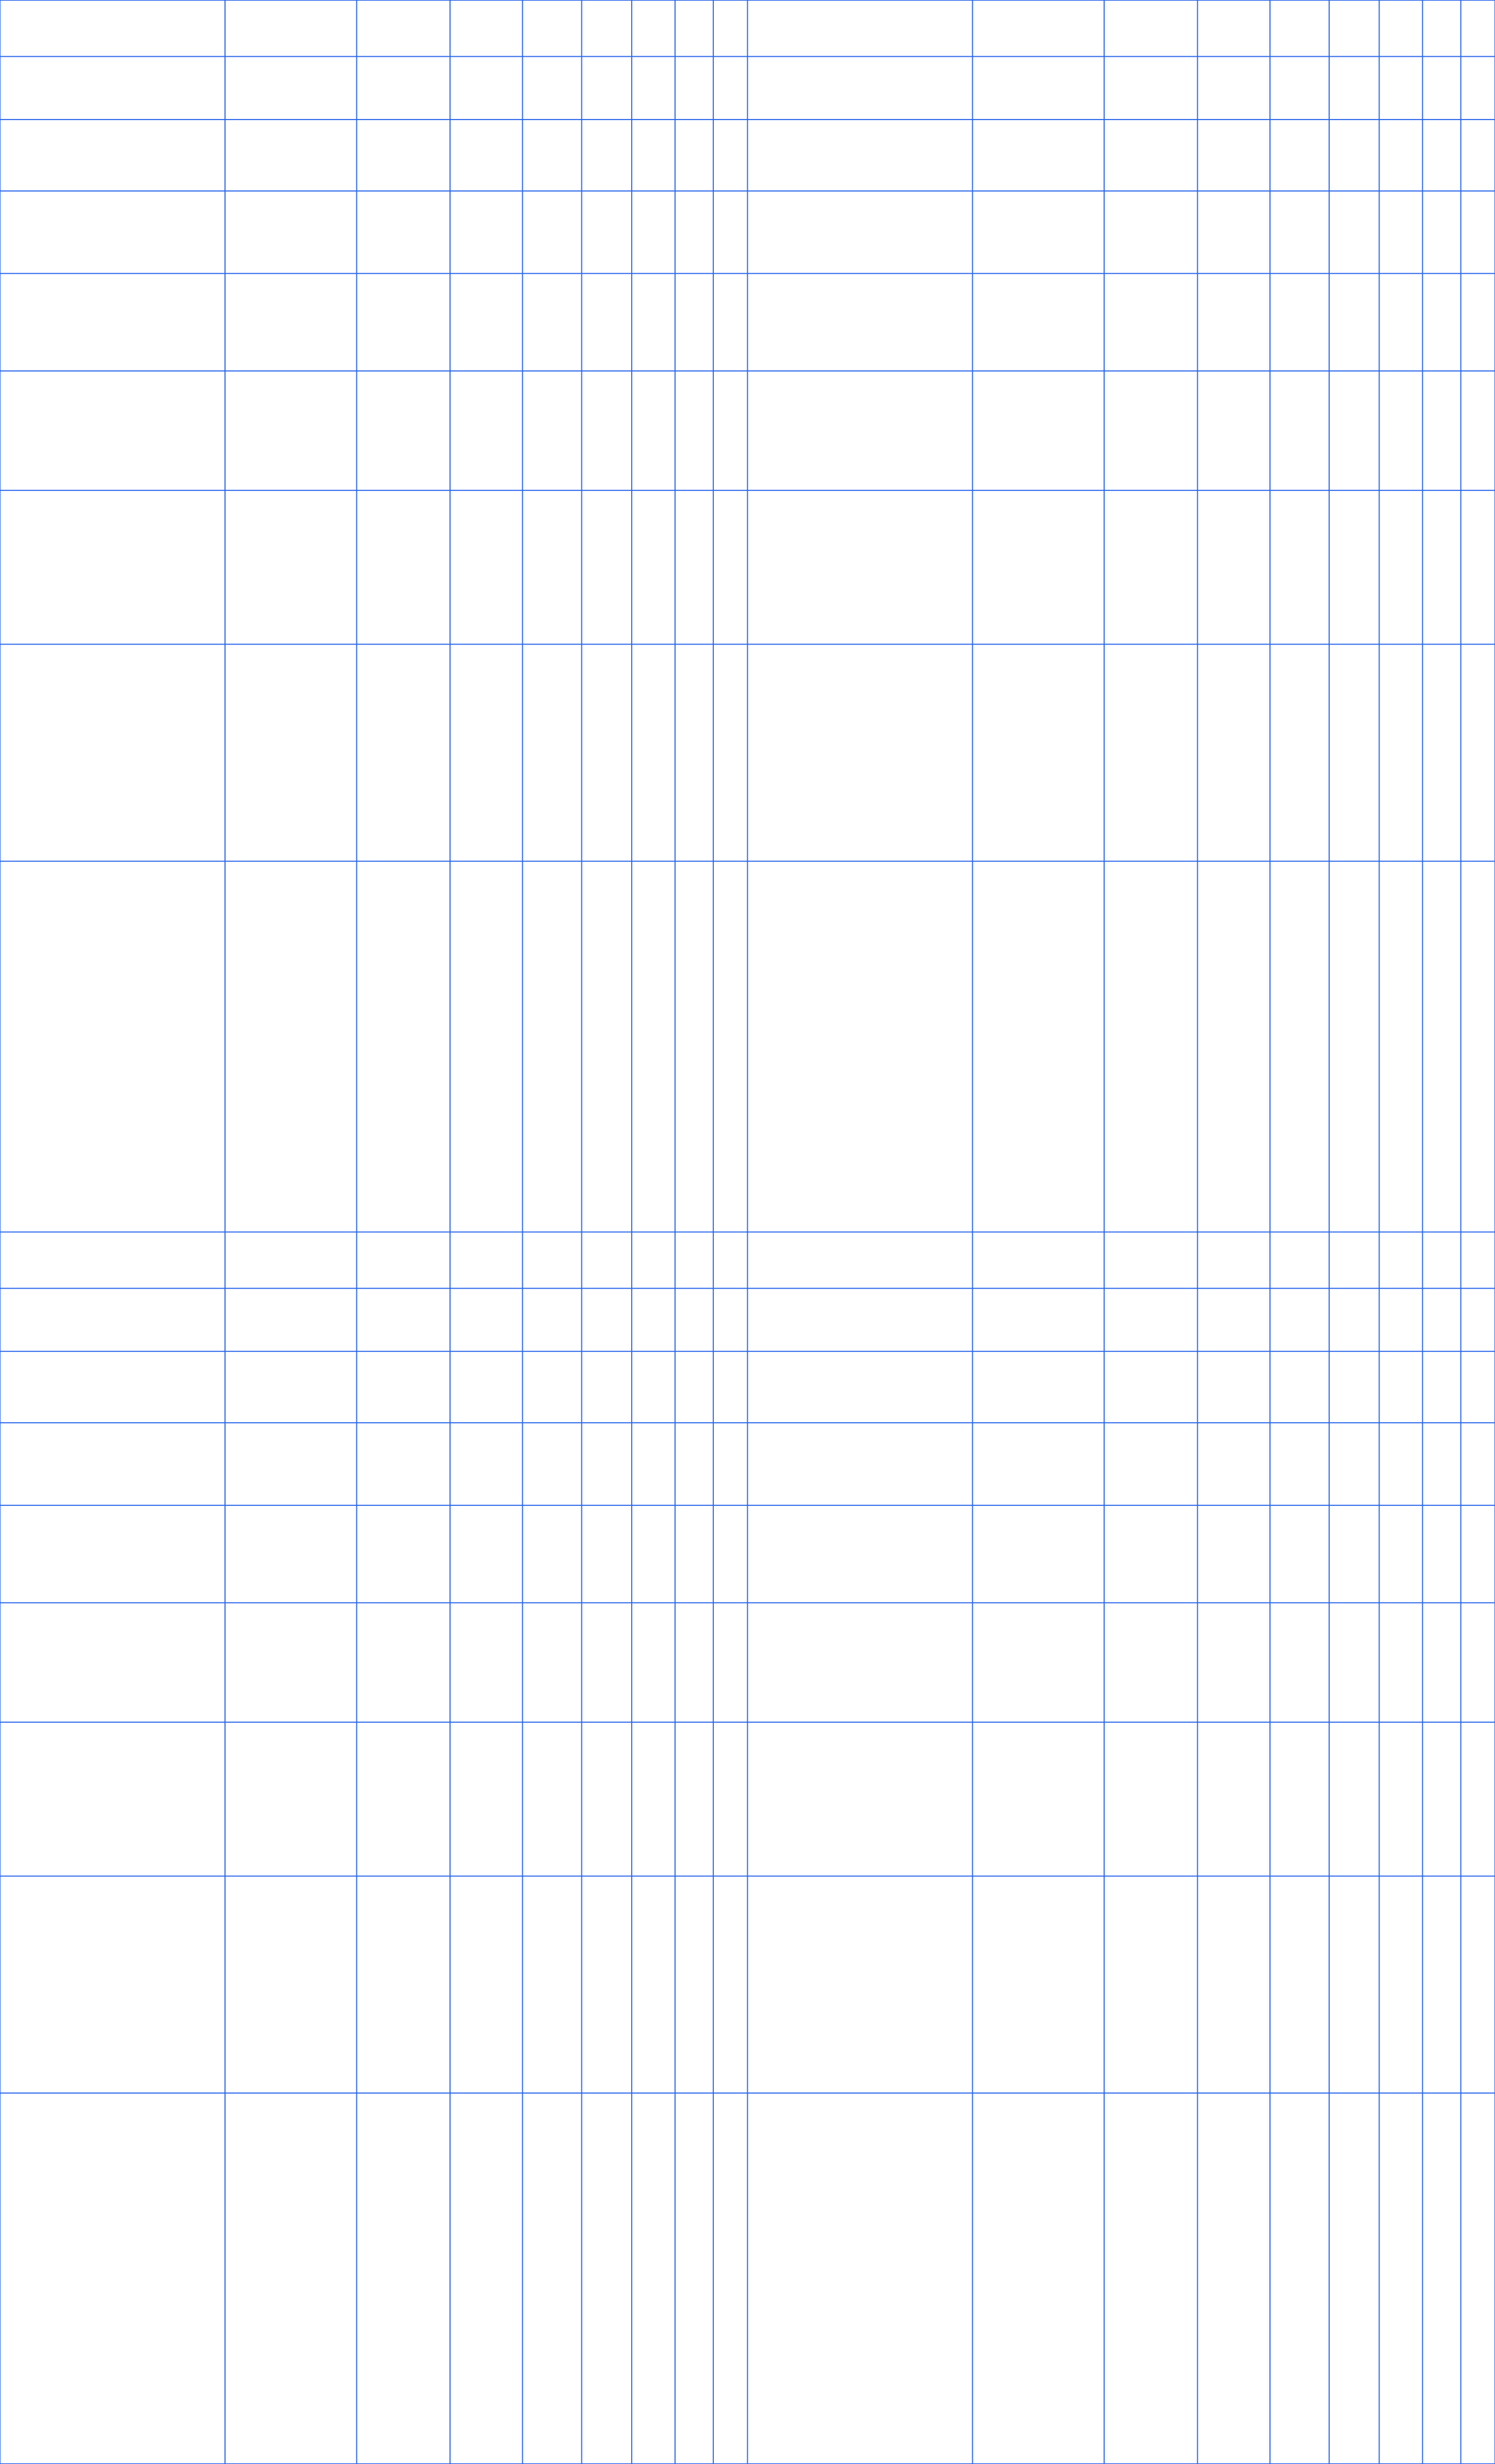
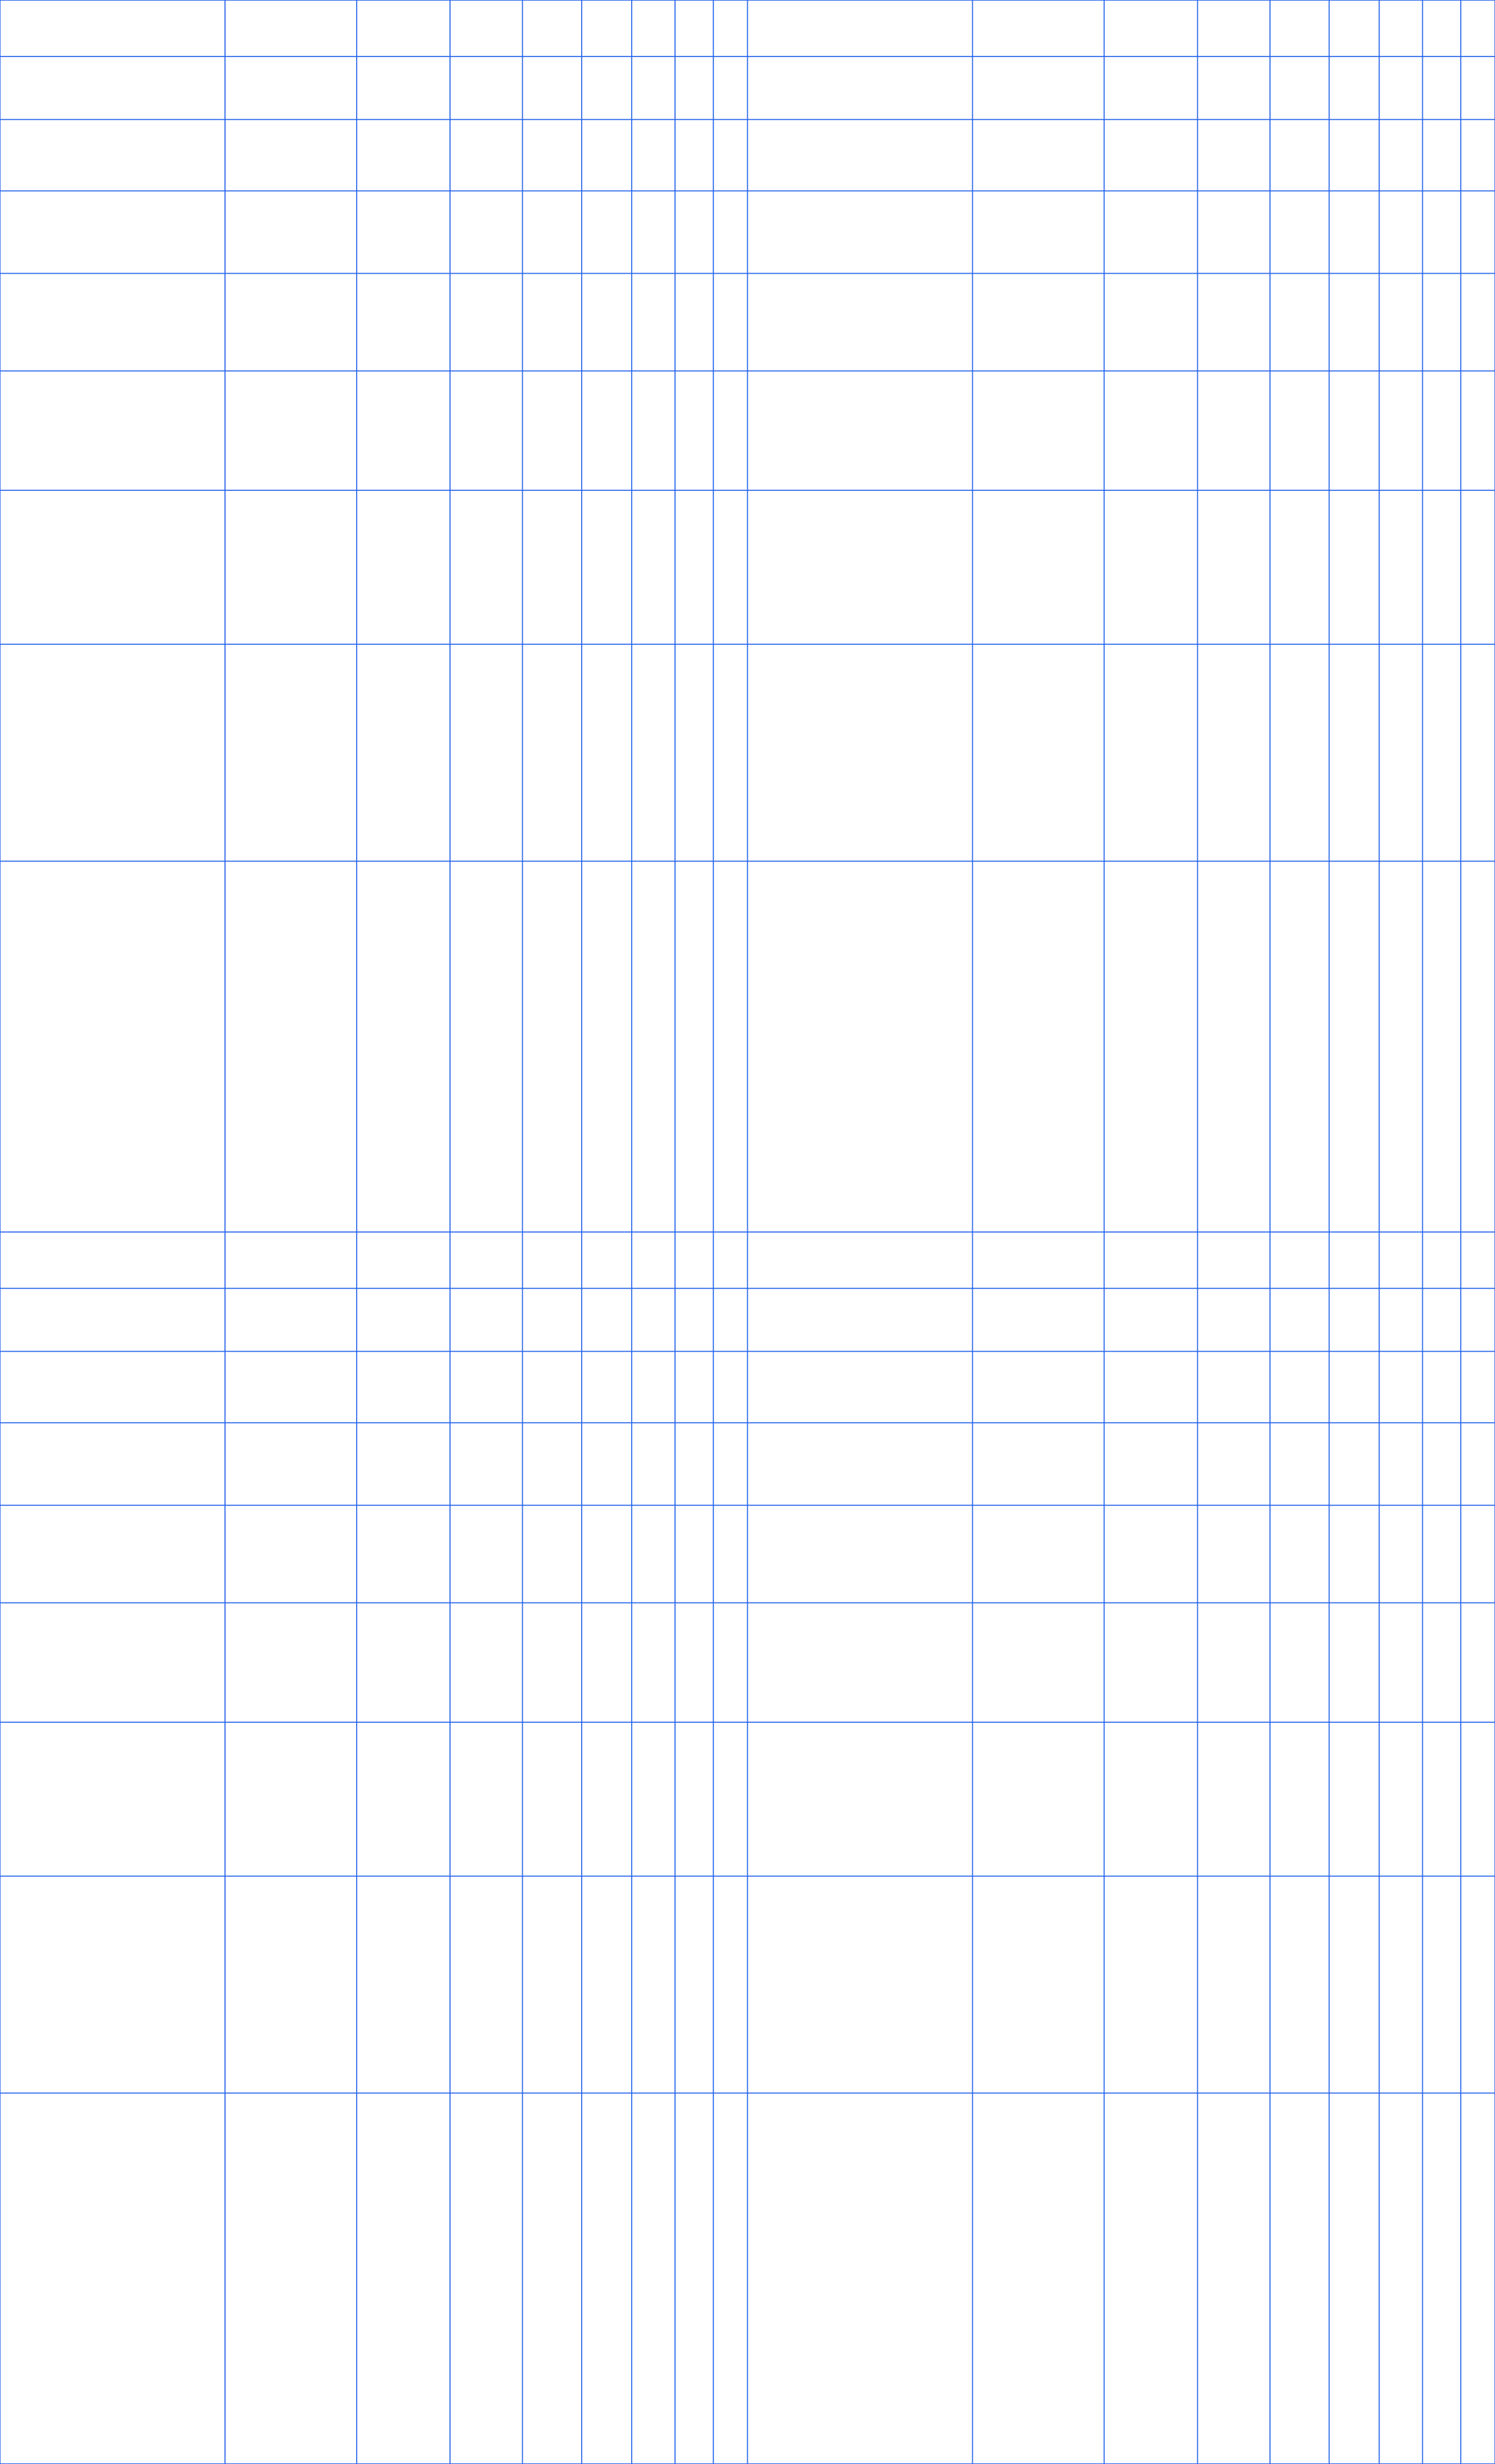
Each axis is divided into decades — equal steps of tenfold change. The distance from 1 to 10 matches the distance from 10 to 100 on both axes, so the page covers several orders of magnitude in a compact space.
Reading power laws
A relationship of the form y equals a power of x becomes a straight line on log-log paper, and the slope of that line is the exponent. This makes it easy to spot and measure scaling behaviour in experimental data.
Log-log vs semi-log
Use log-log when both variables span orders of magnitude and you suspect a power law. Use semi-log when only one variable is exponential and the other is linear.
Log-Log Graph Paper sizes and spacing
| Option | What it gives you | Best for |
|---|---|---|
| 1 decade per axis | One order of magnitude each way | Narrow scaling ranges |
| 2 decades per axis | Two orders of magnitude each way | Typical engineering data |
| 3 decades per axis | Three orders of magnitude each way | Wide-ranging physics data |
Where log-log graph paper is used
Physics
- Plot power laws and scaling relationships
- Measure the exponent of a data fit
- Study metabolic scaling across animals
Engineering
- Draw frequency-response curves
- Plot filter gain over decades — Semi-Log Graph Paper
- Analyse fluid flow and turbulence
Science
- Graph earthquake magnitude versus frequency
- Plot reaction rates and kinetics
- Compare widely separated magnitudes — Polar Graph Paper
Log-log paper vs Semi-log paper
| Feature | Log-log paper | Semi-log paper |
|---|---|---|
| Logarithmic axes | Both axes | One axis |
| Straightens | Power laws | Exponential growth |
| Slope means | Exponent | Growth rate |
Log-Log Graph Paper examples
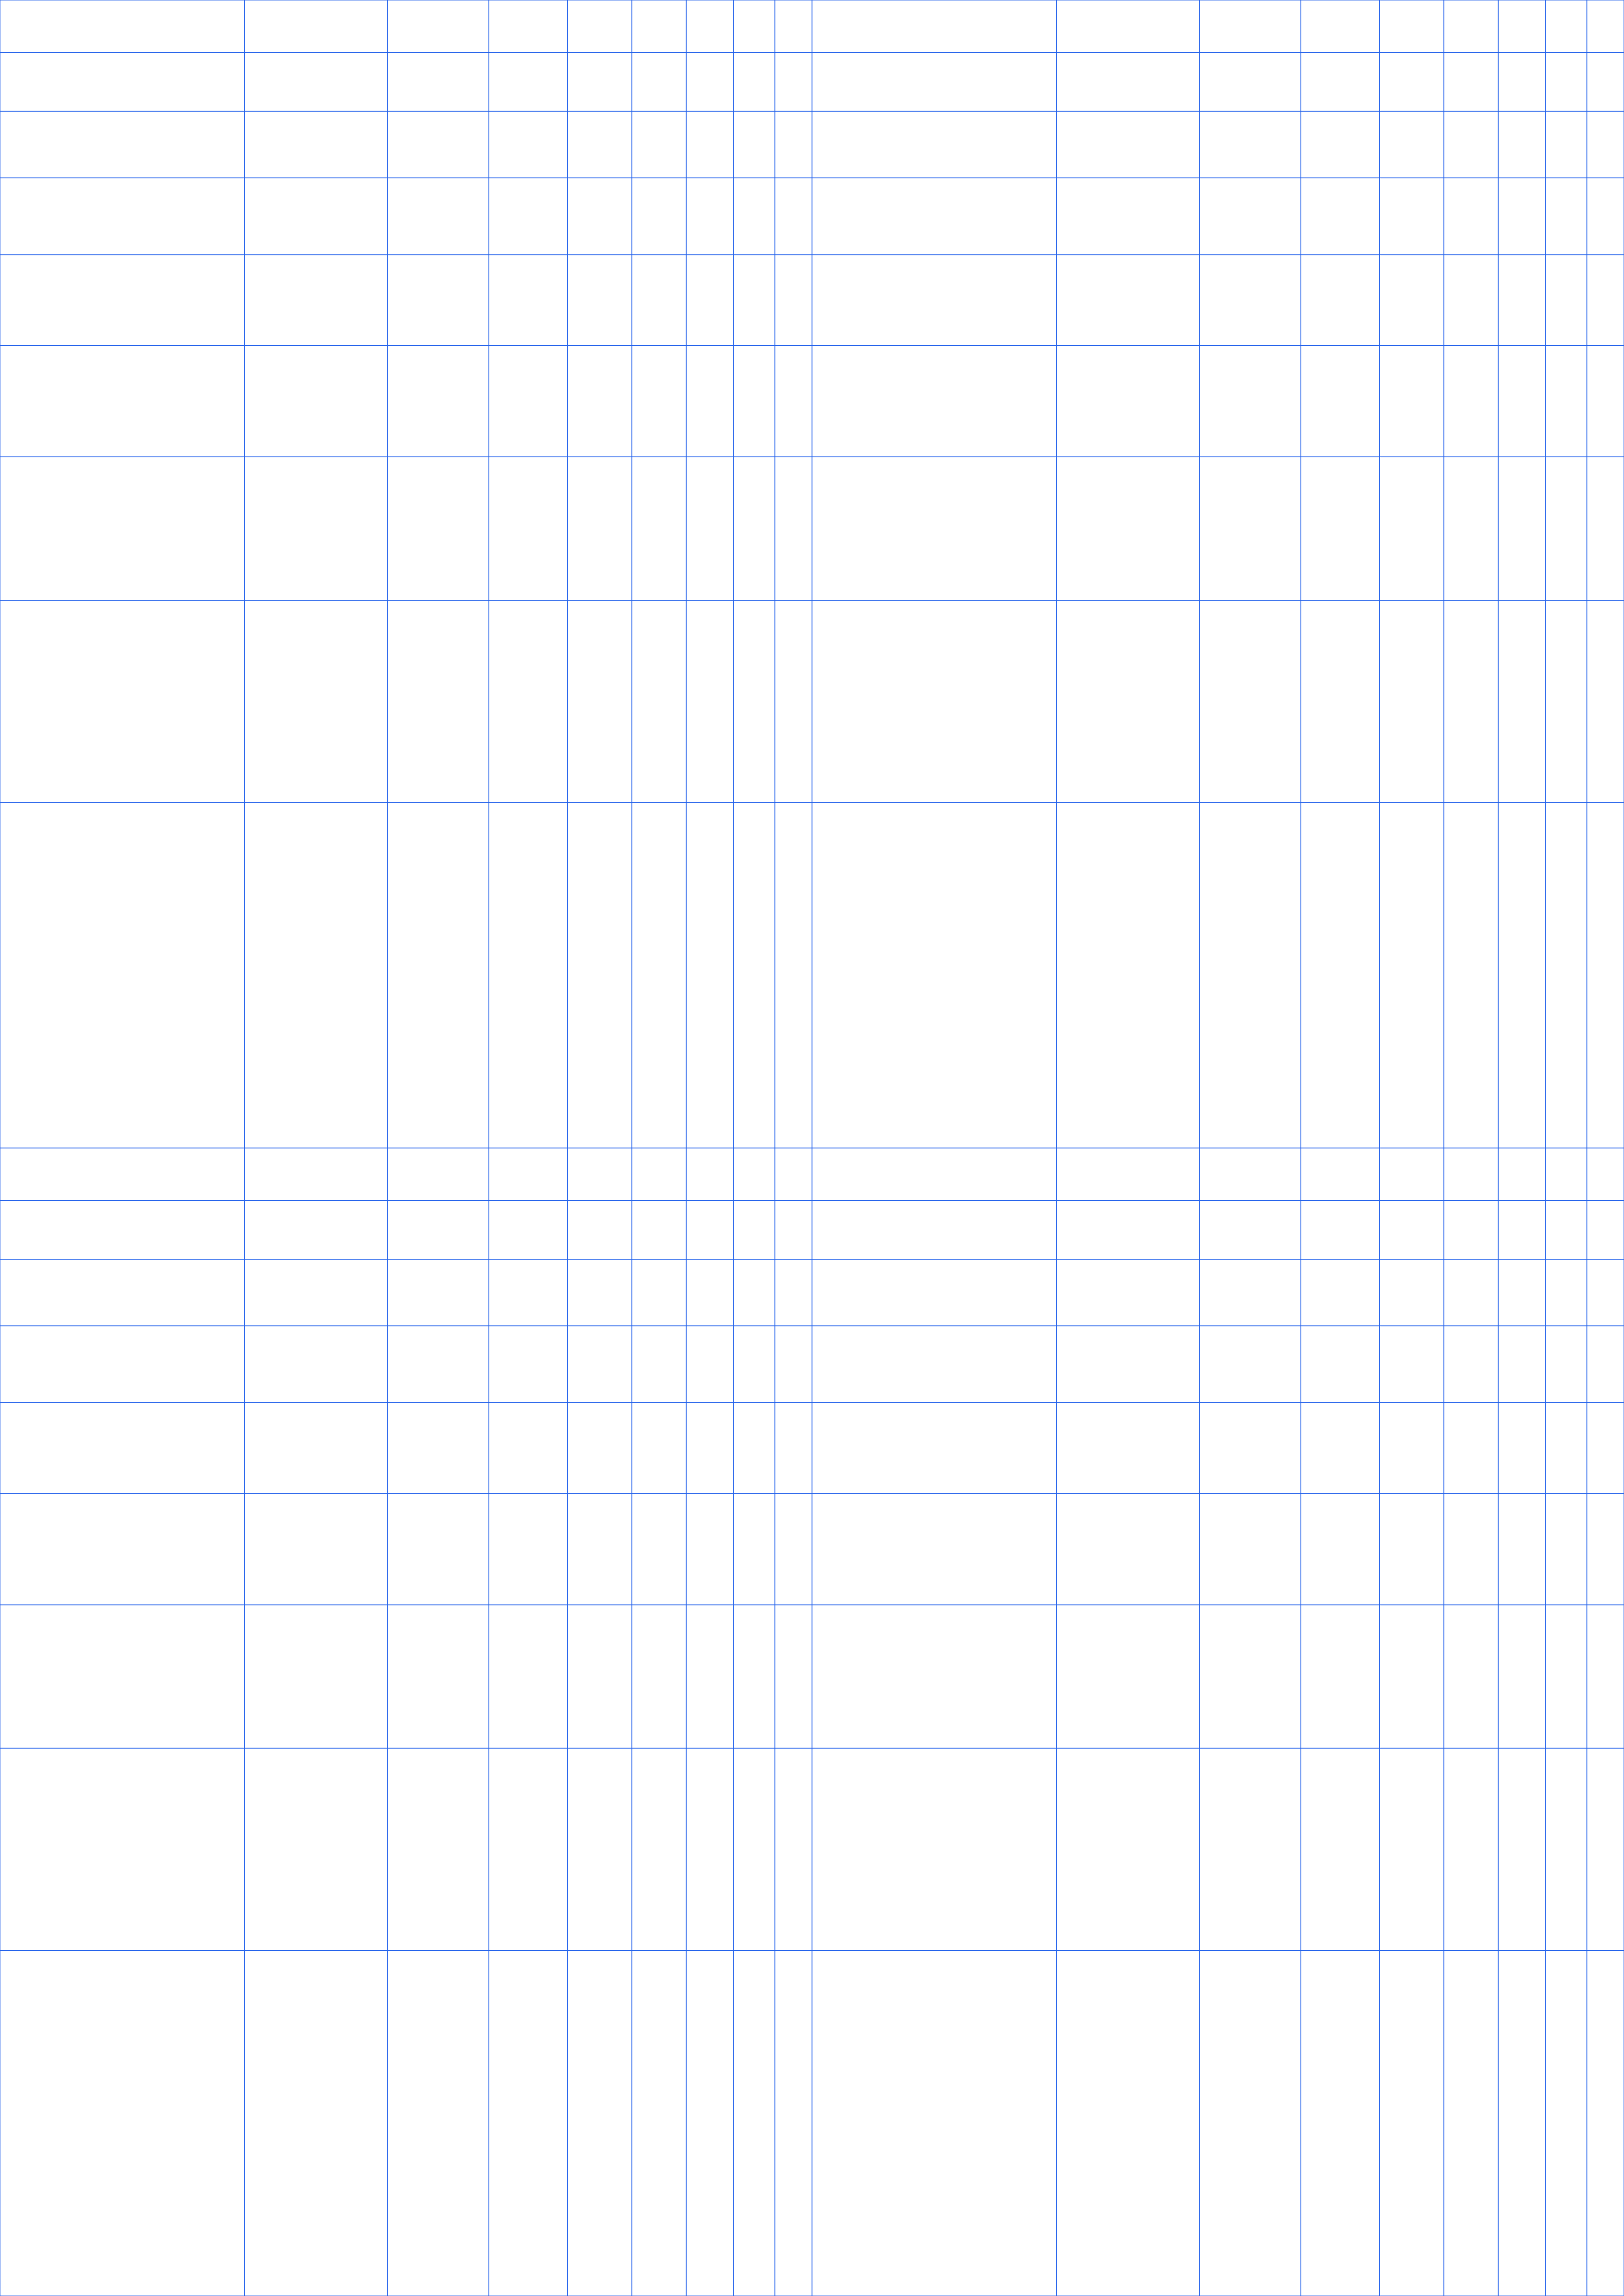
Log-Log Graph Paper Downloads
84 templates across 7 paper sizes and 6 spacings. Each card links the PDF, PNG and SVG for that exact grid.
A4 — 210 × 297 mm (8.27 × 11.69 in)
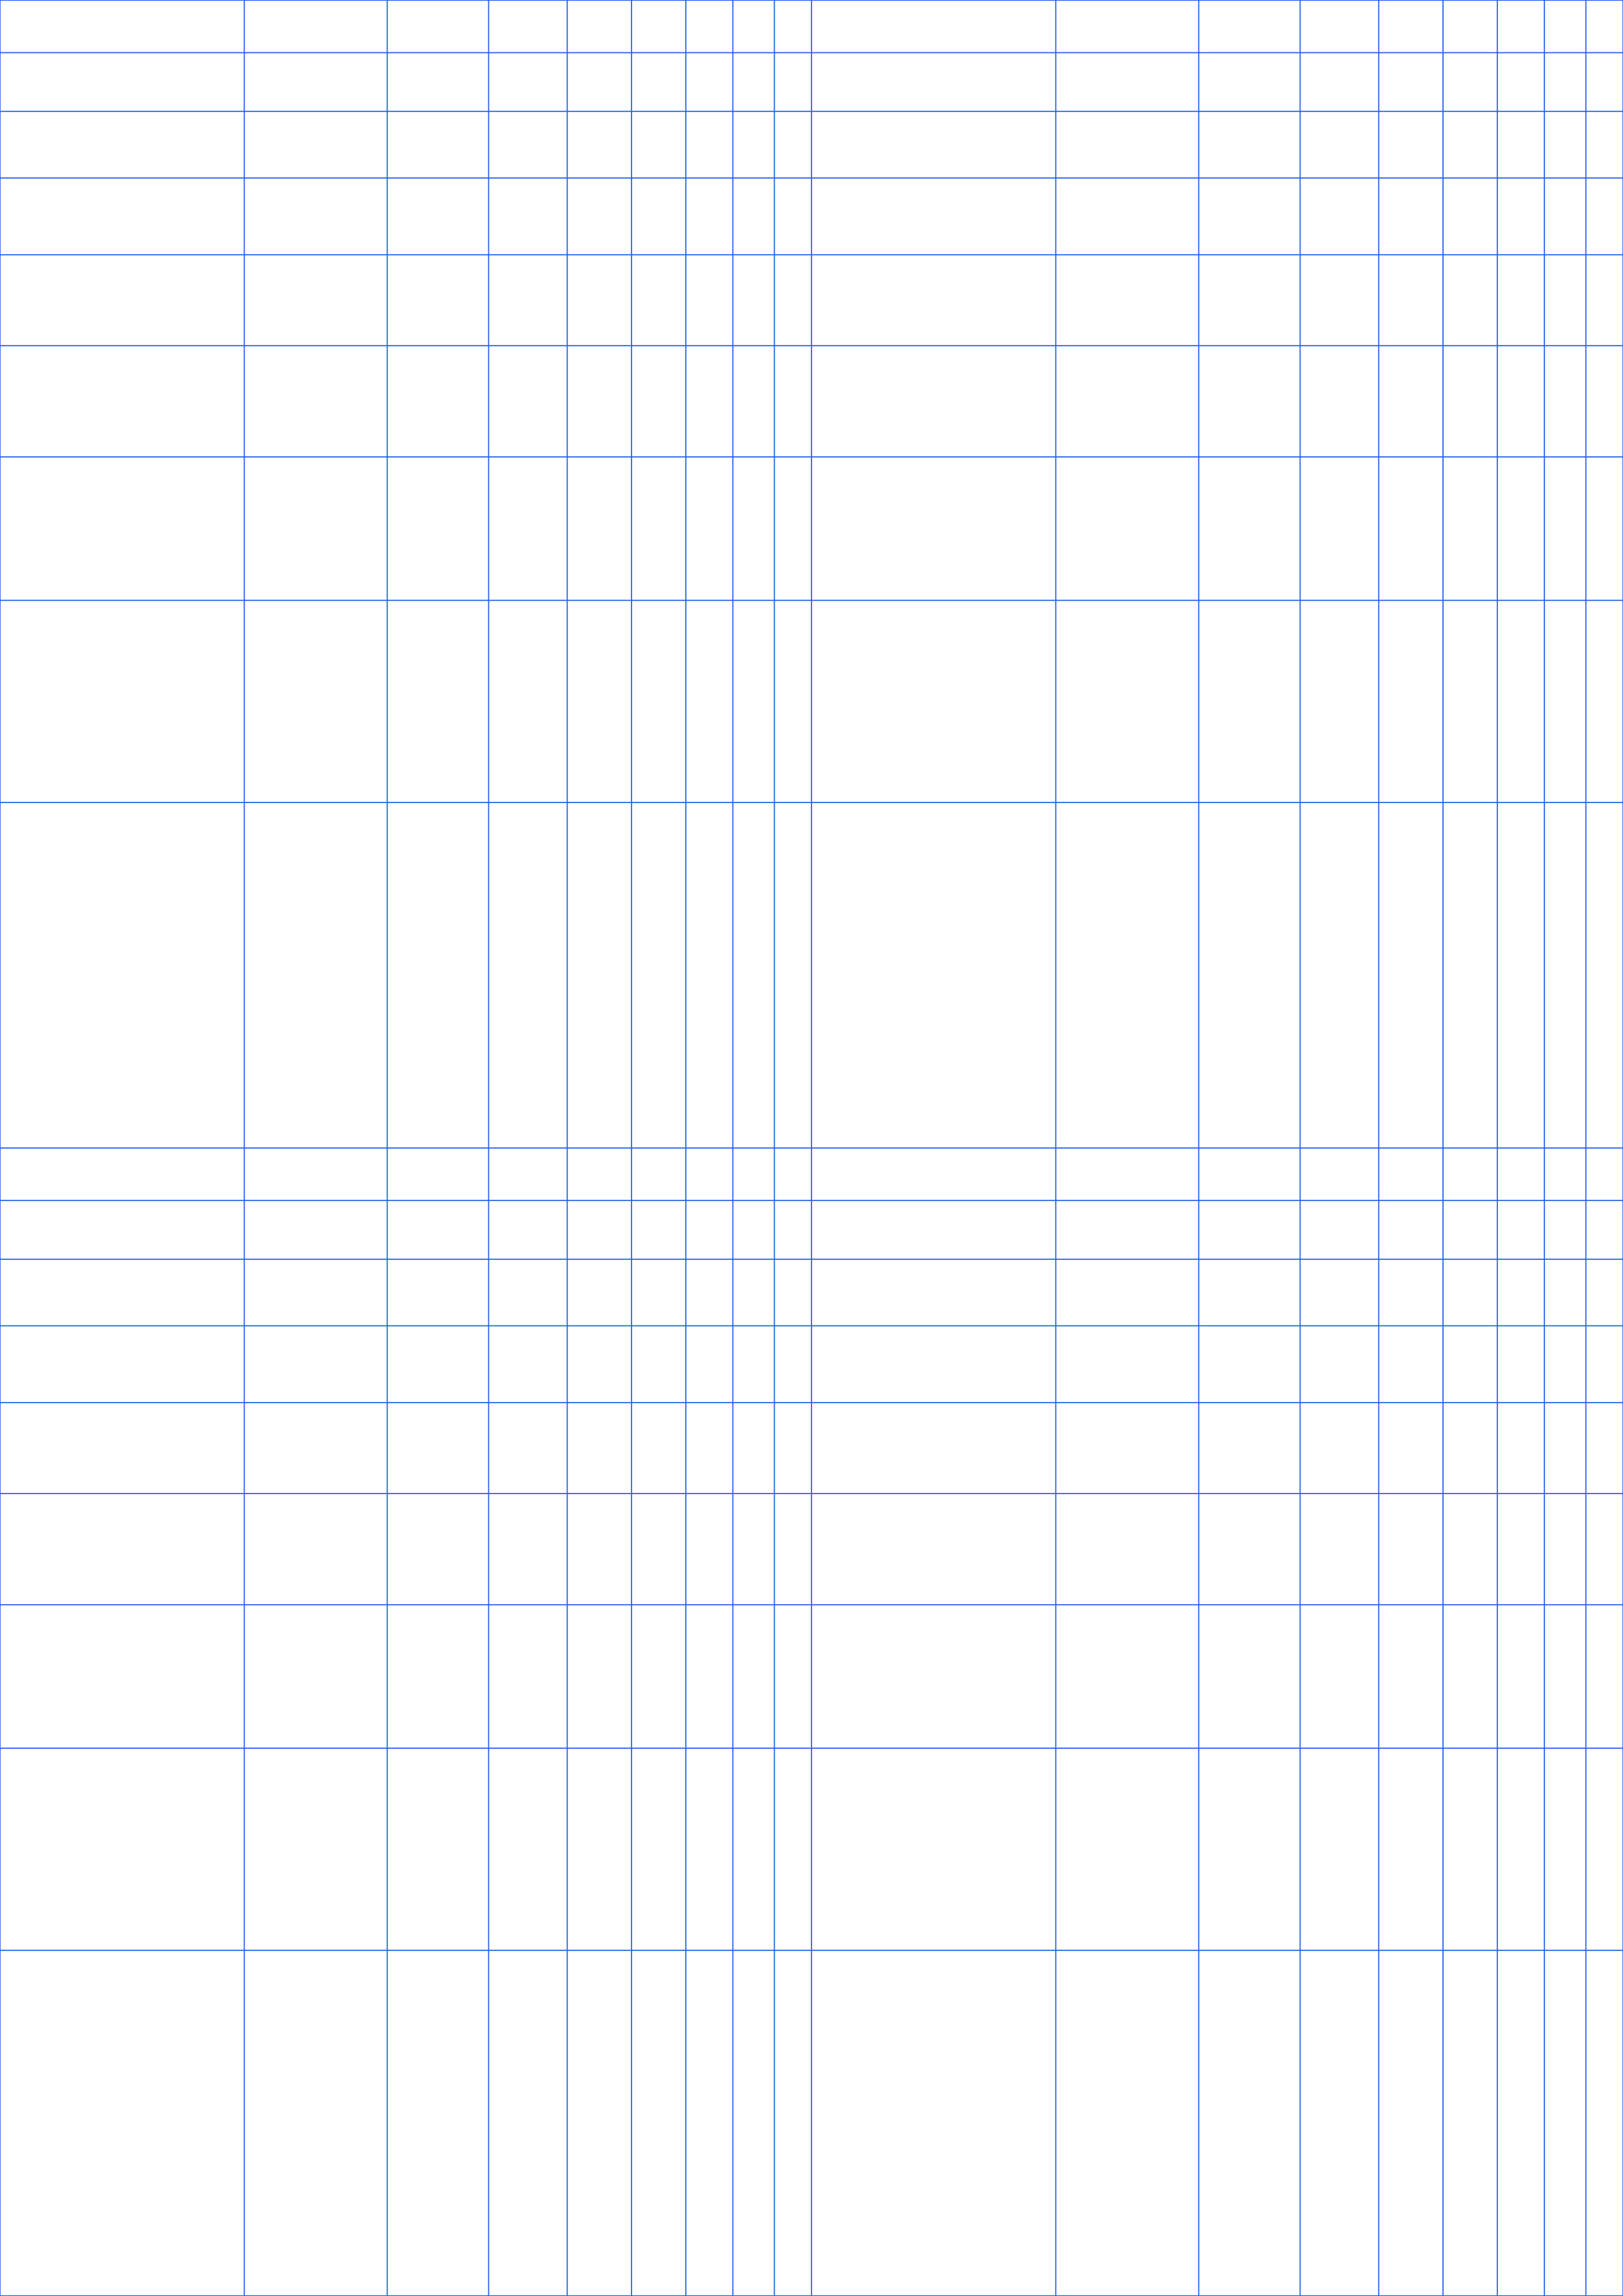
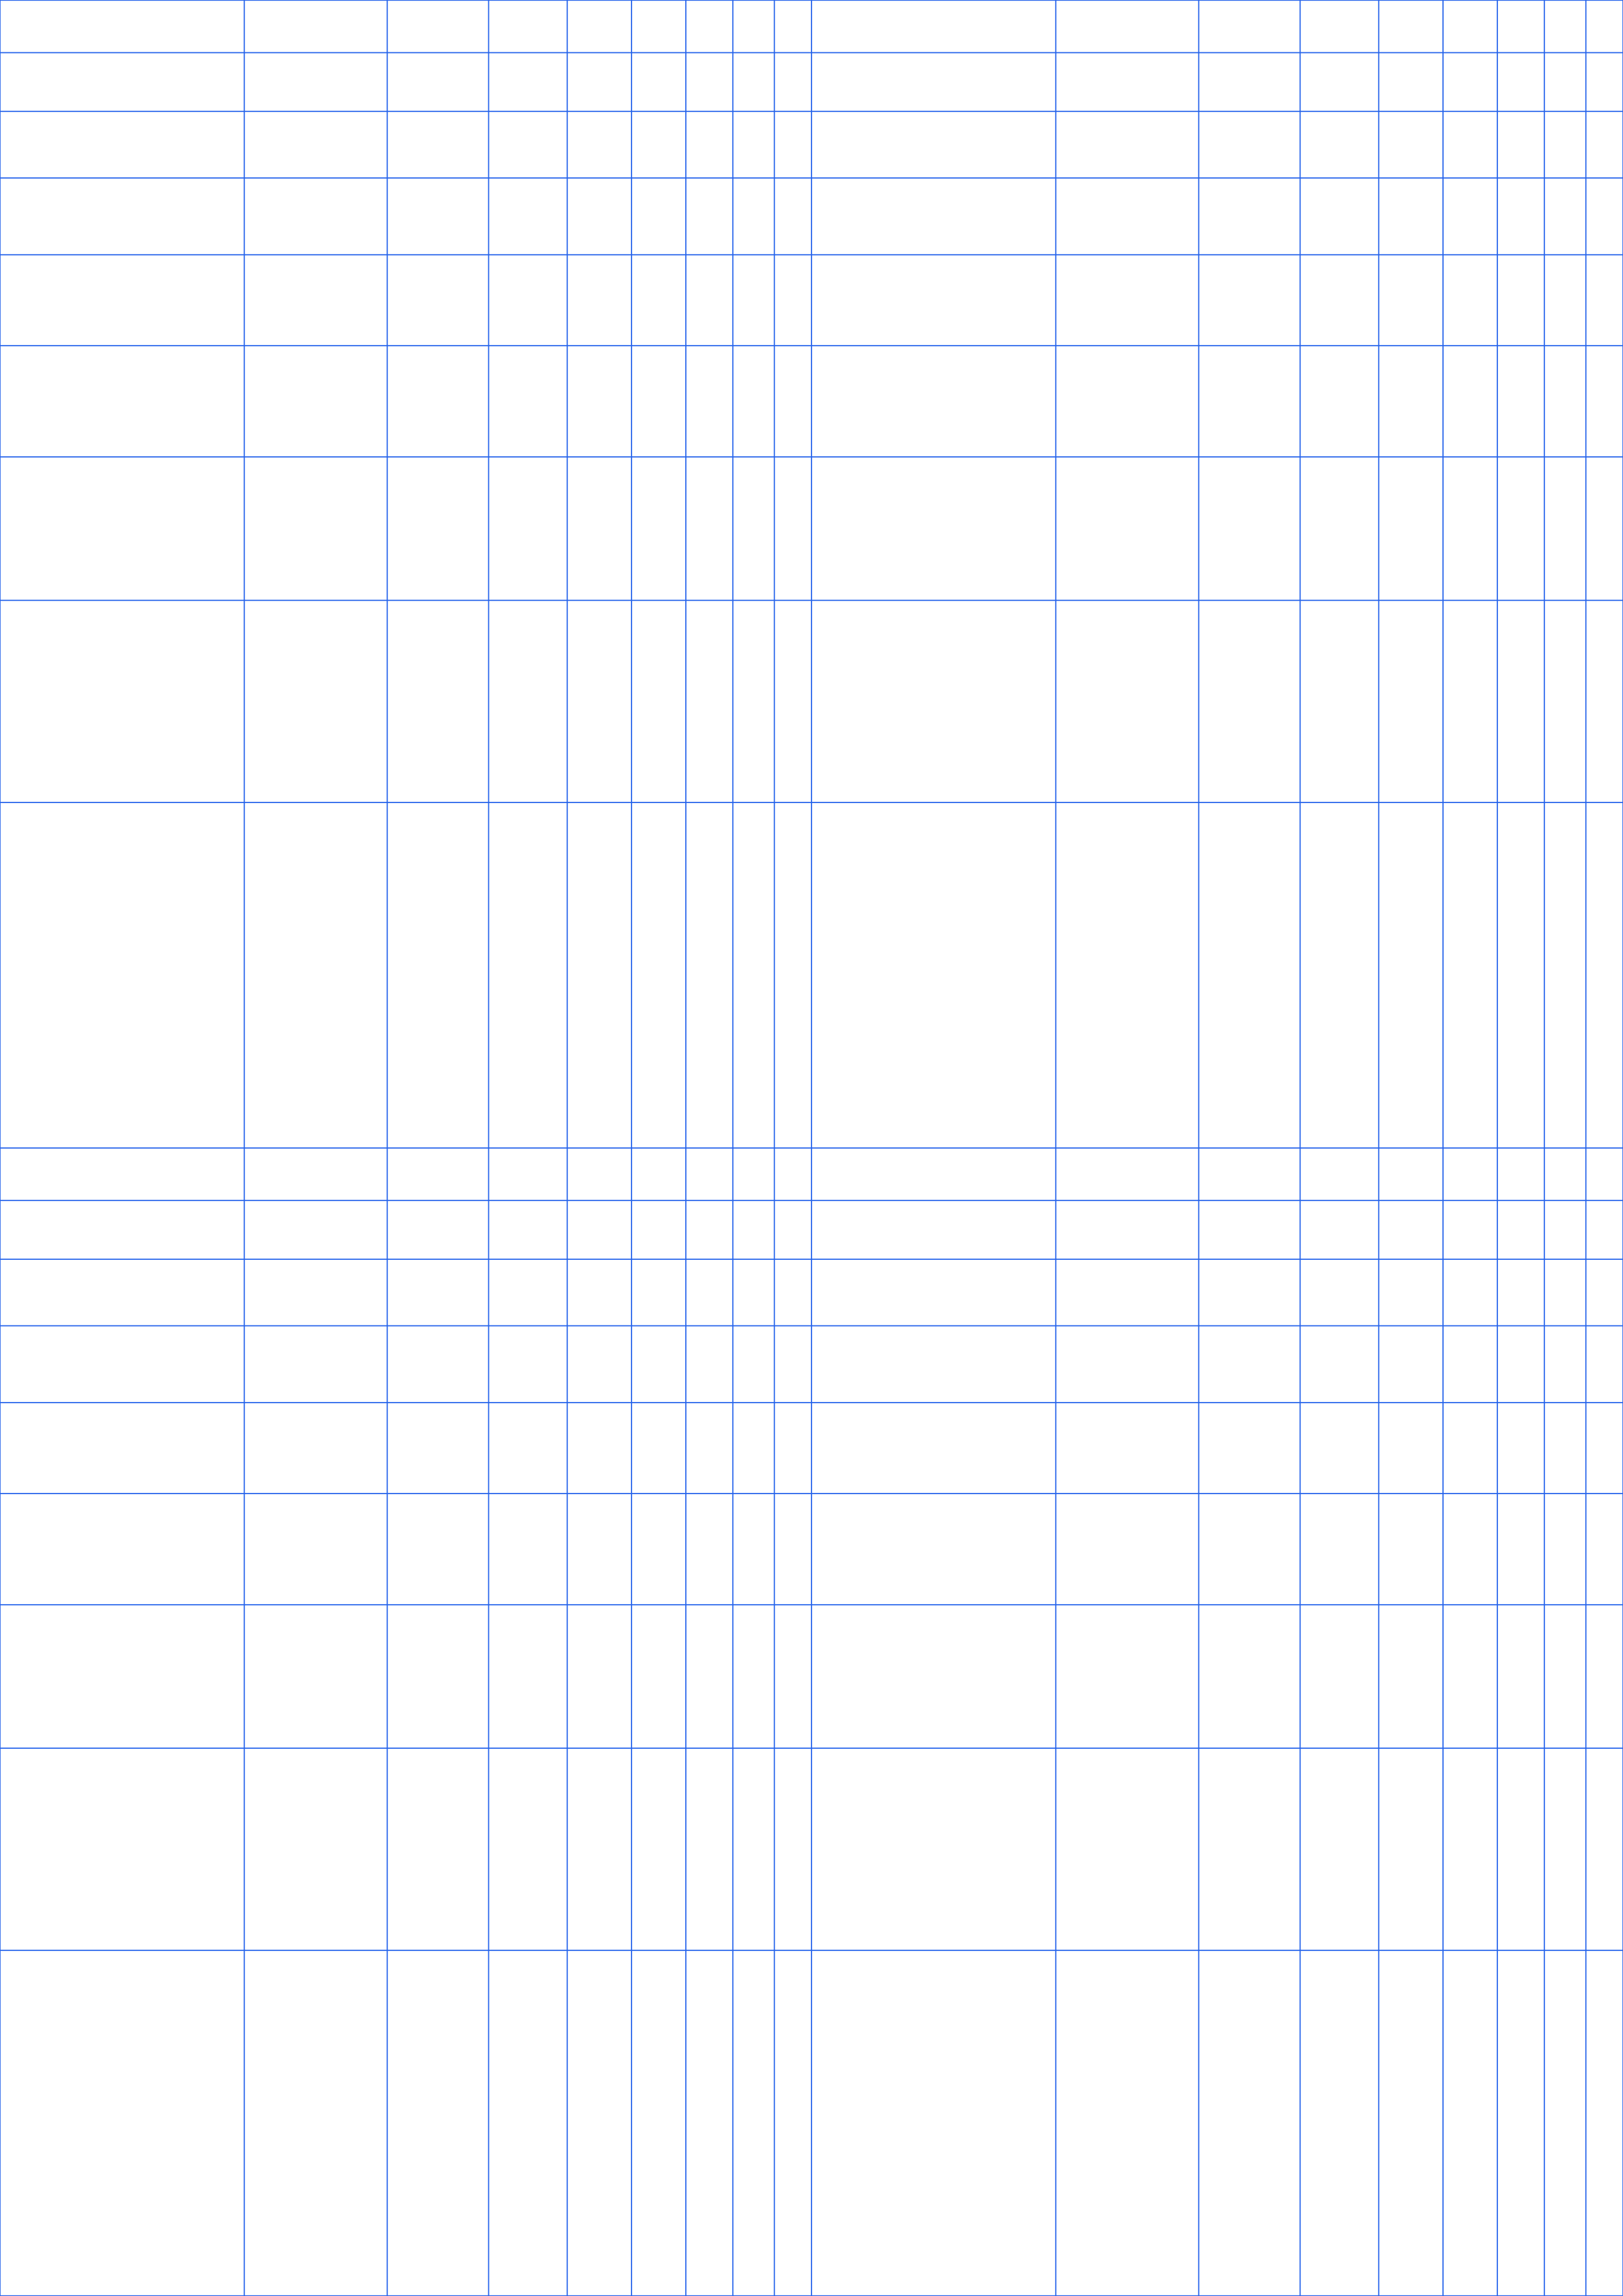
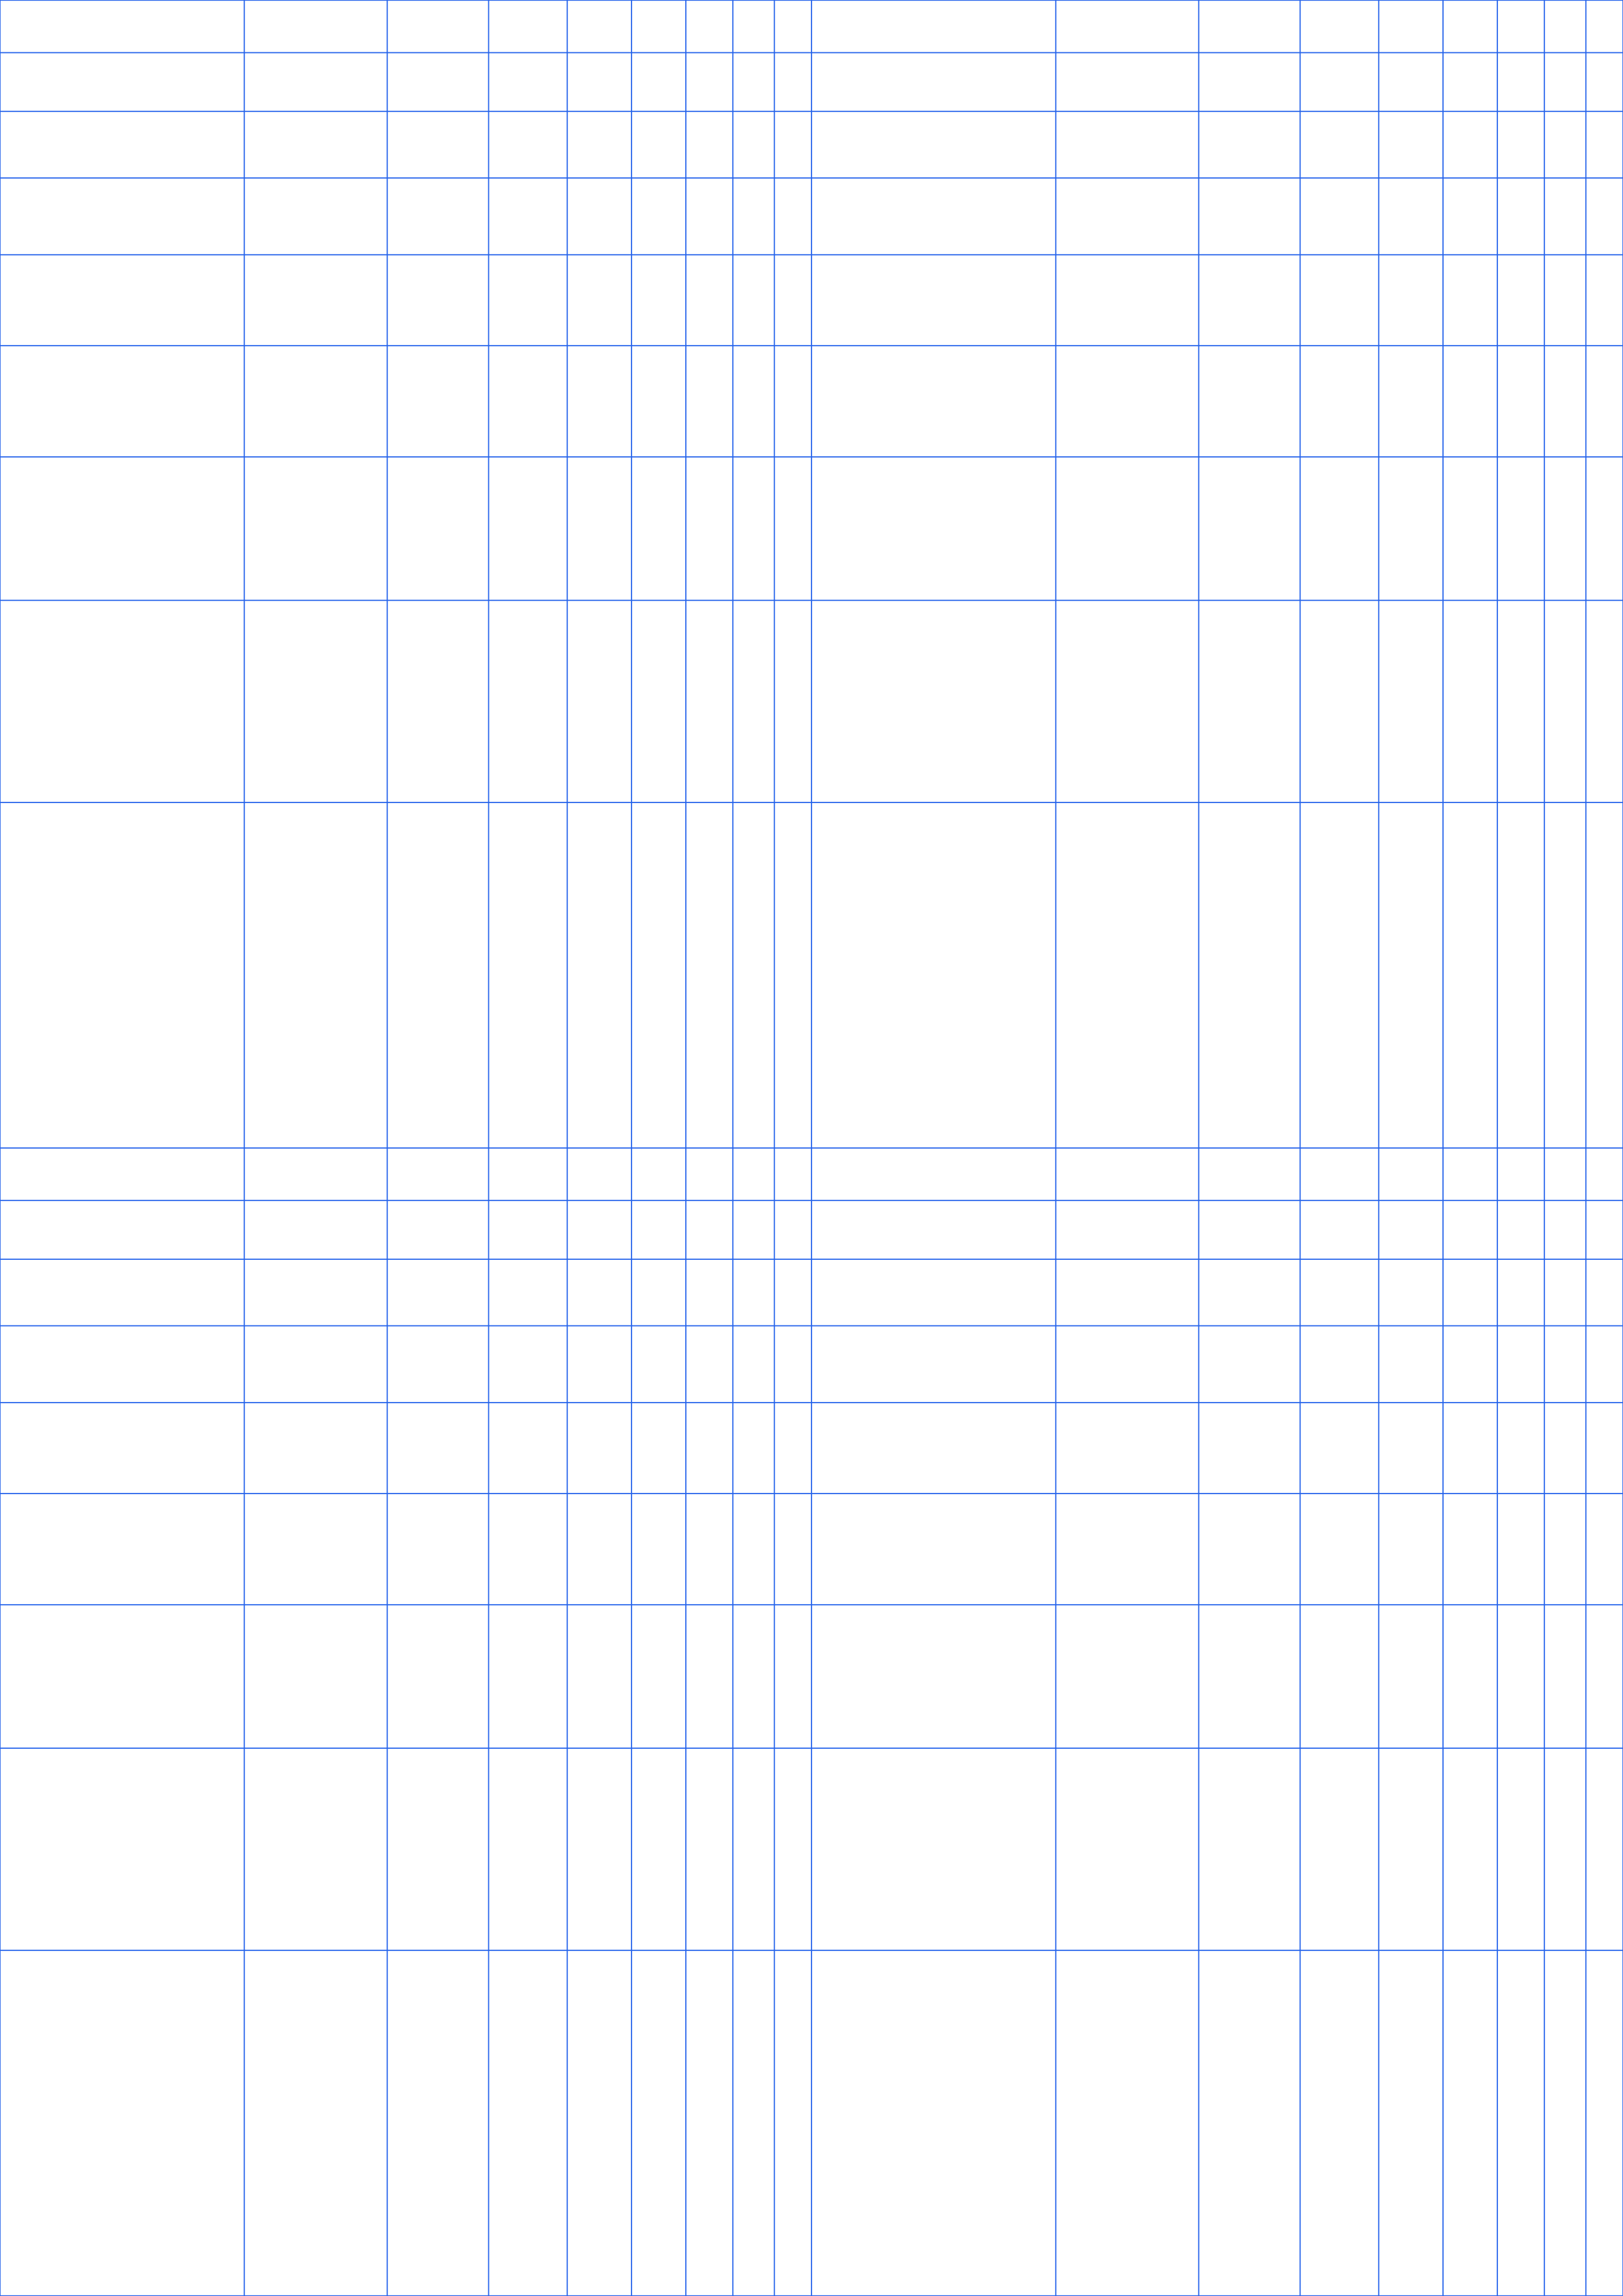
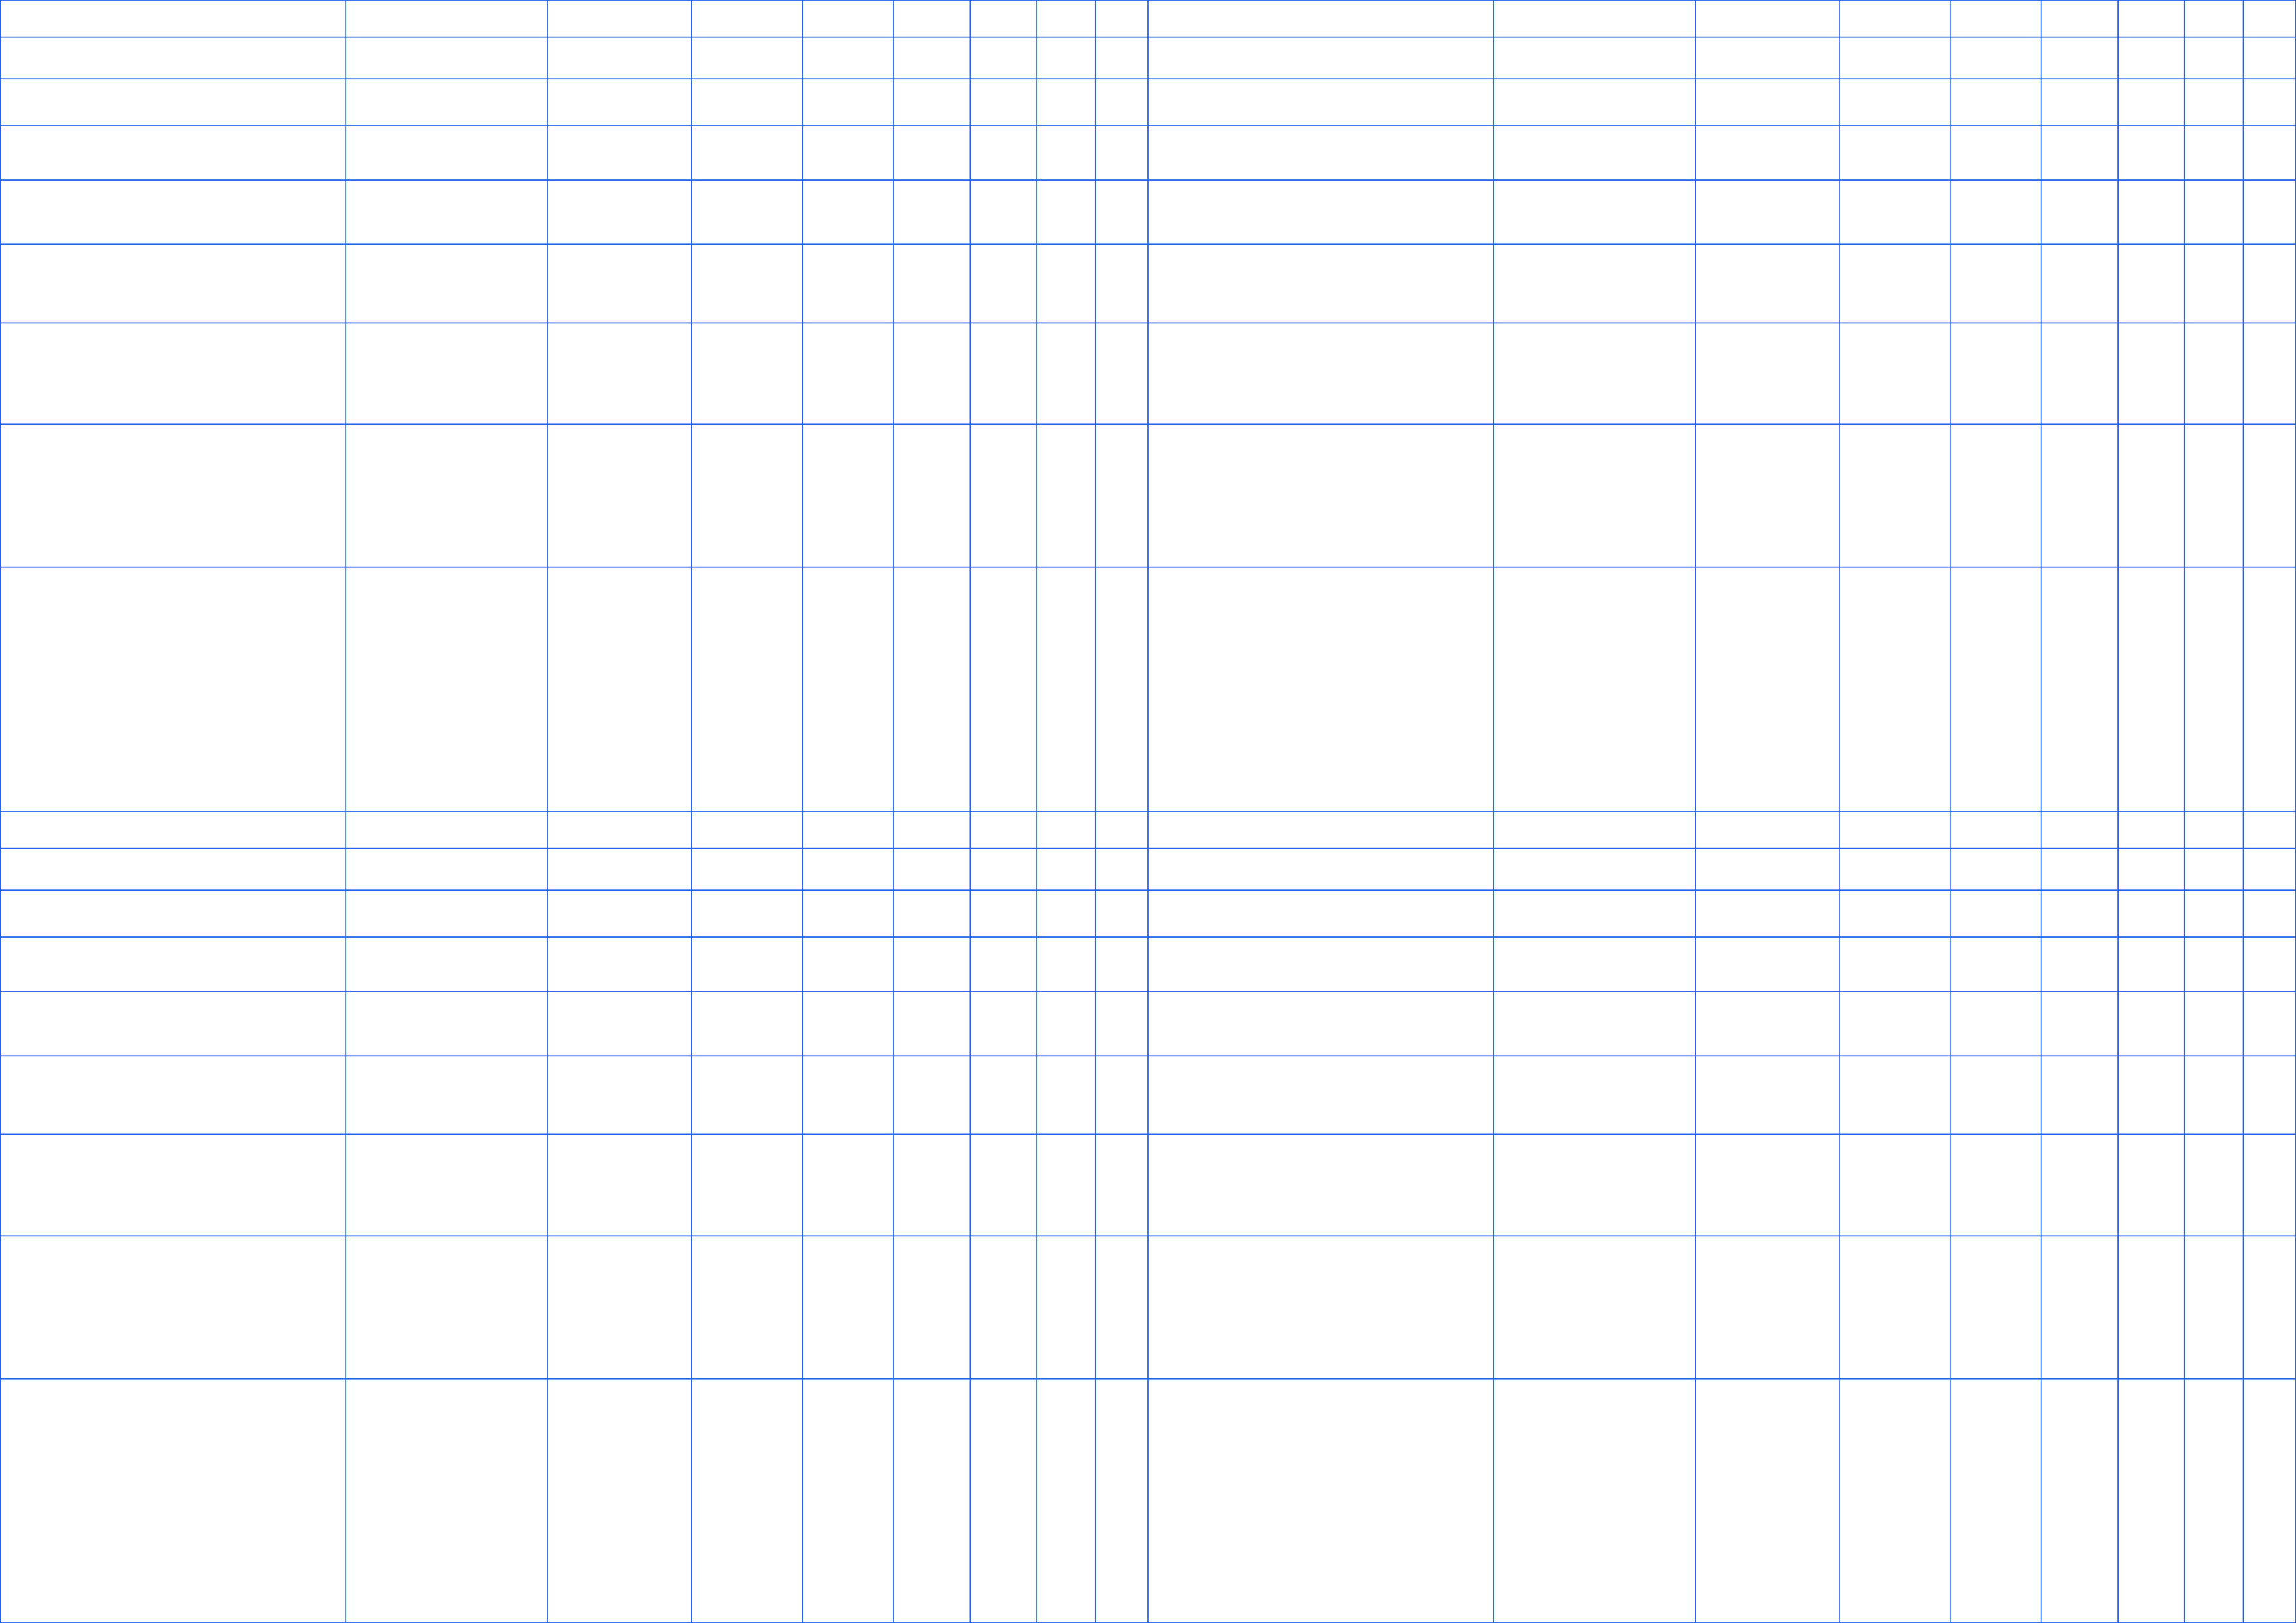
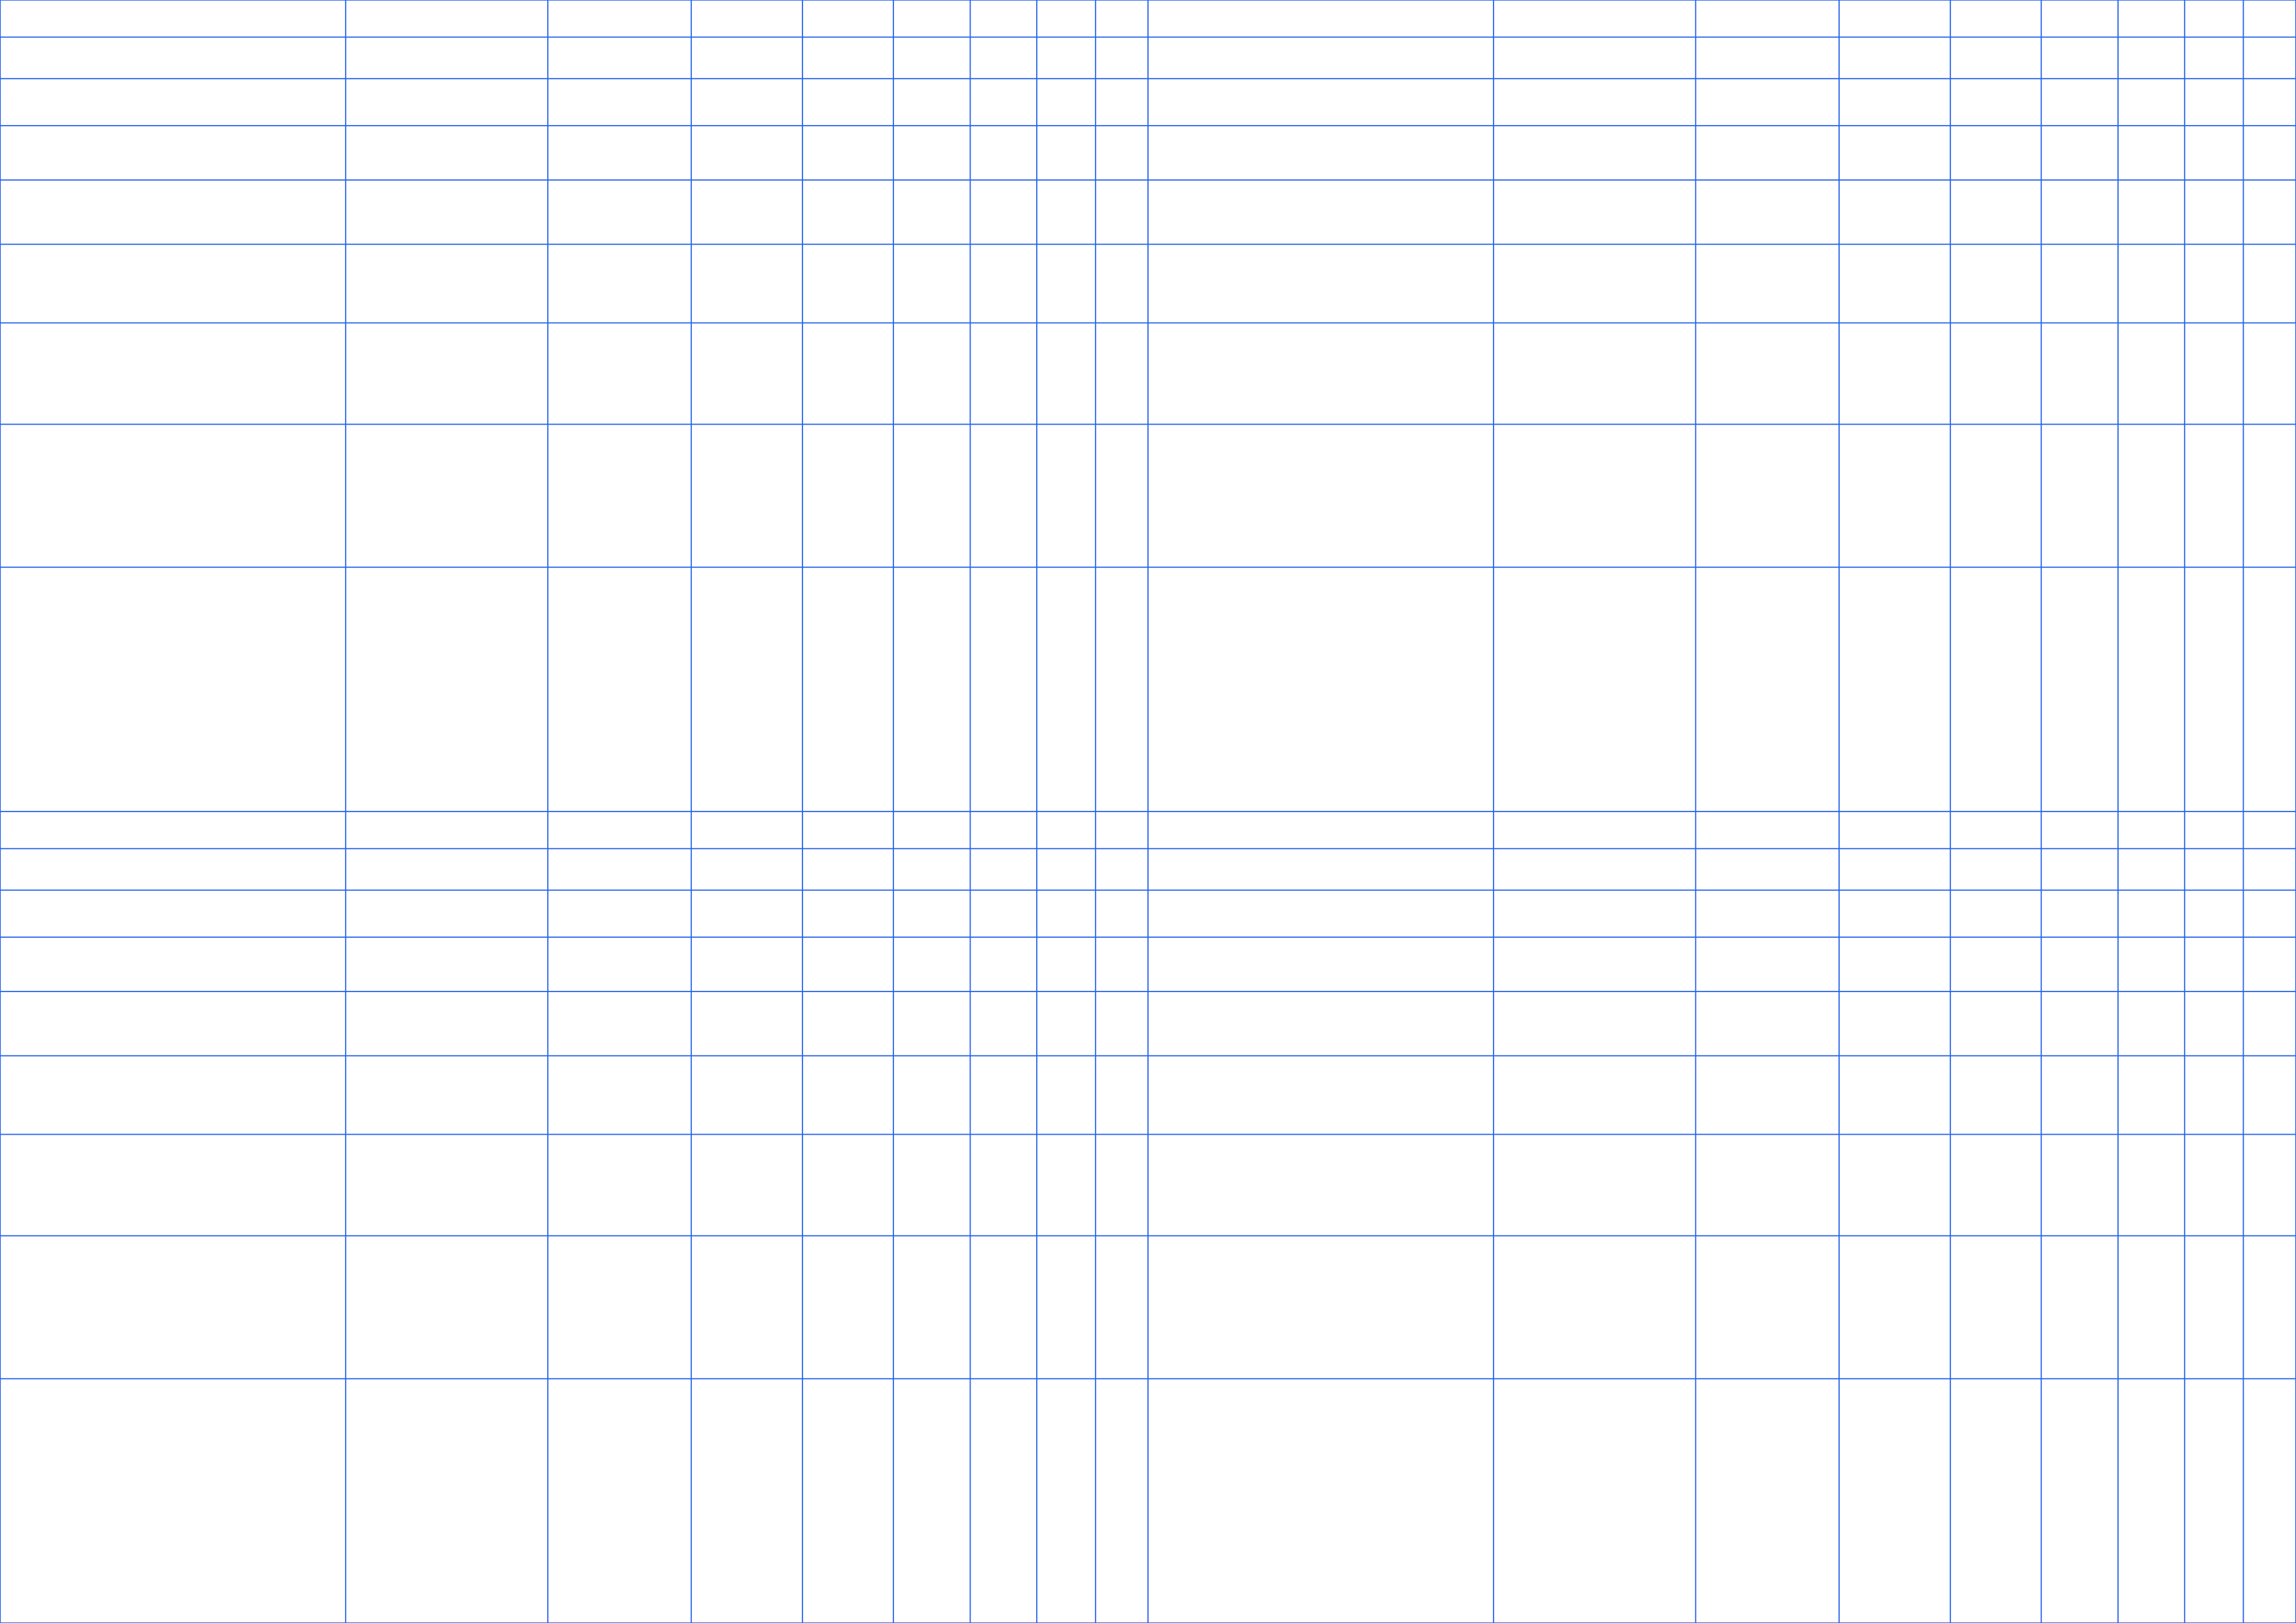
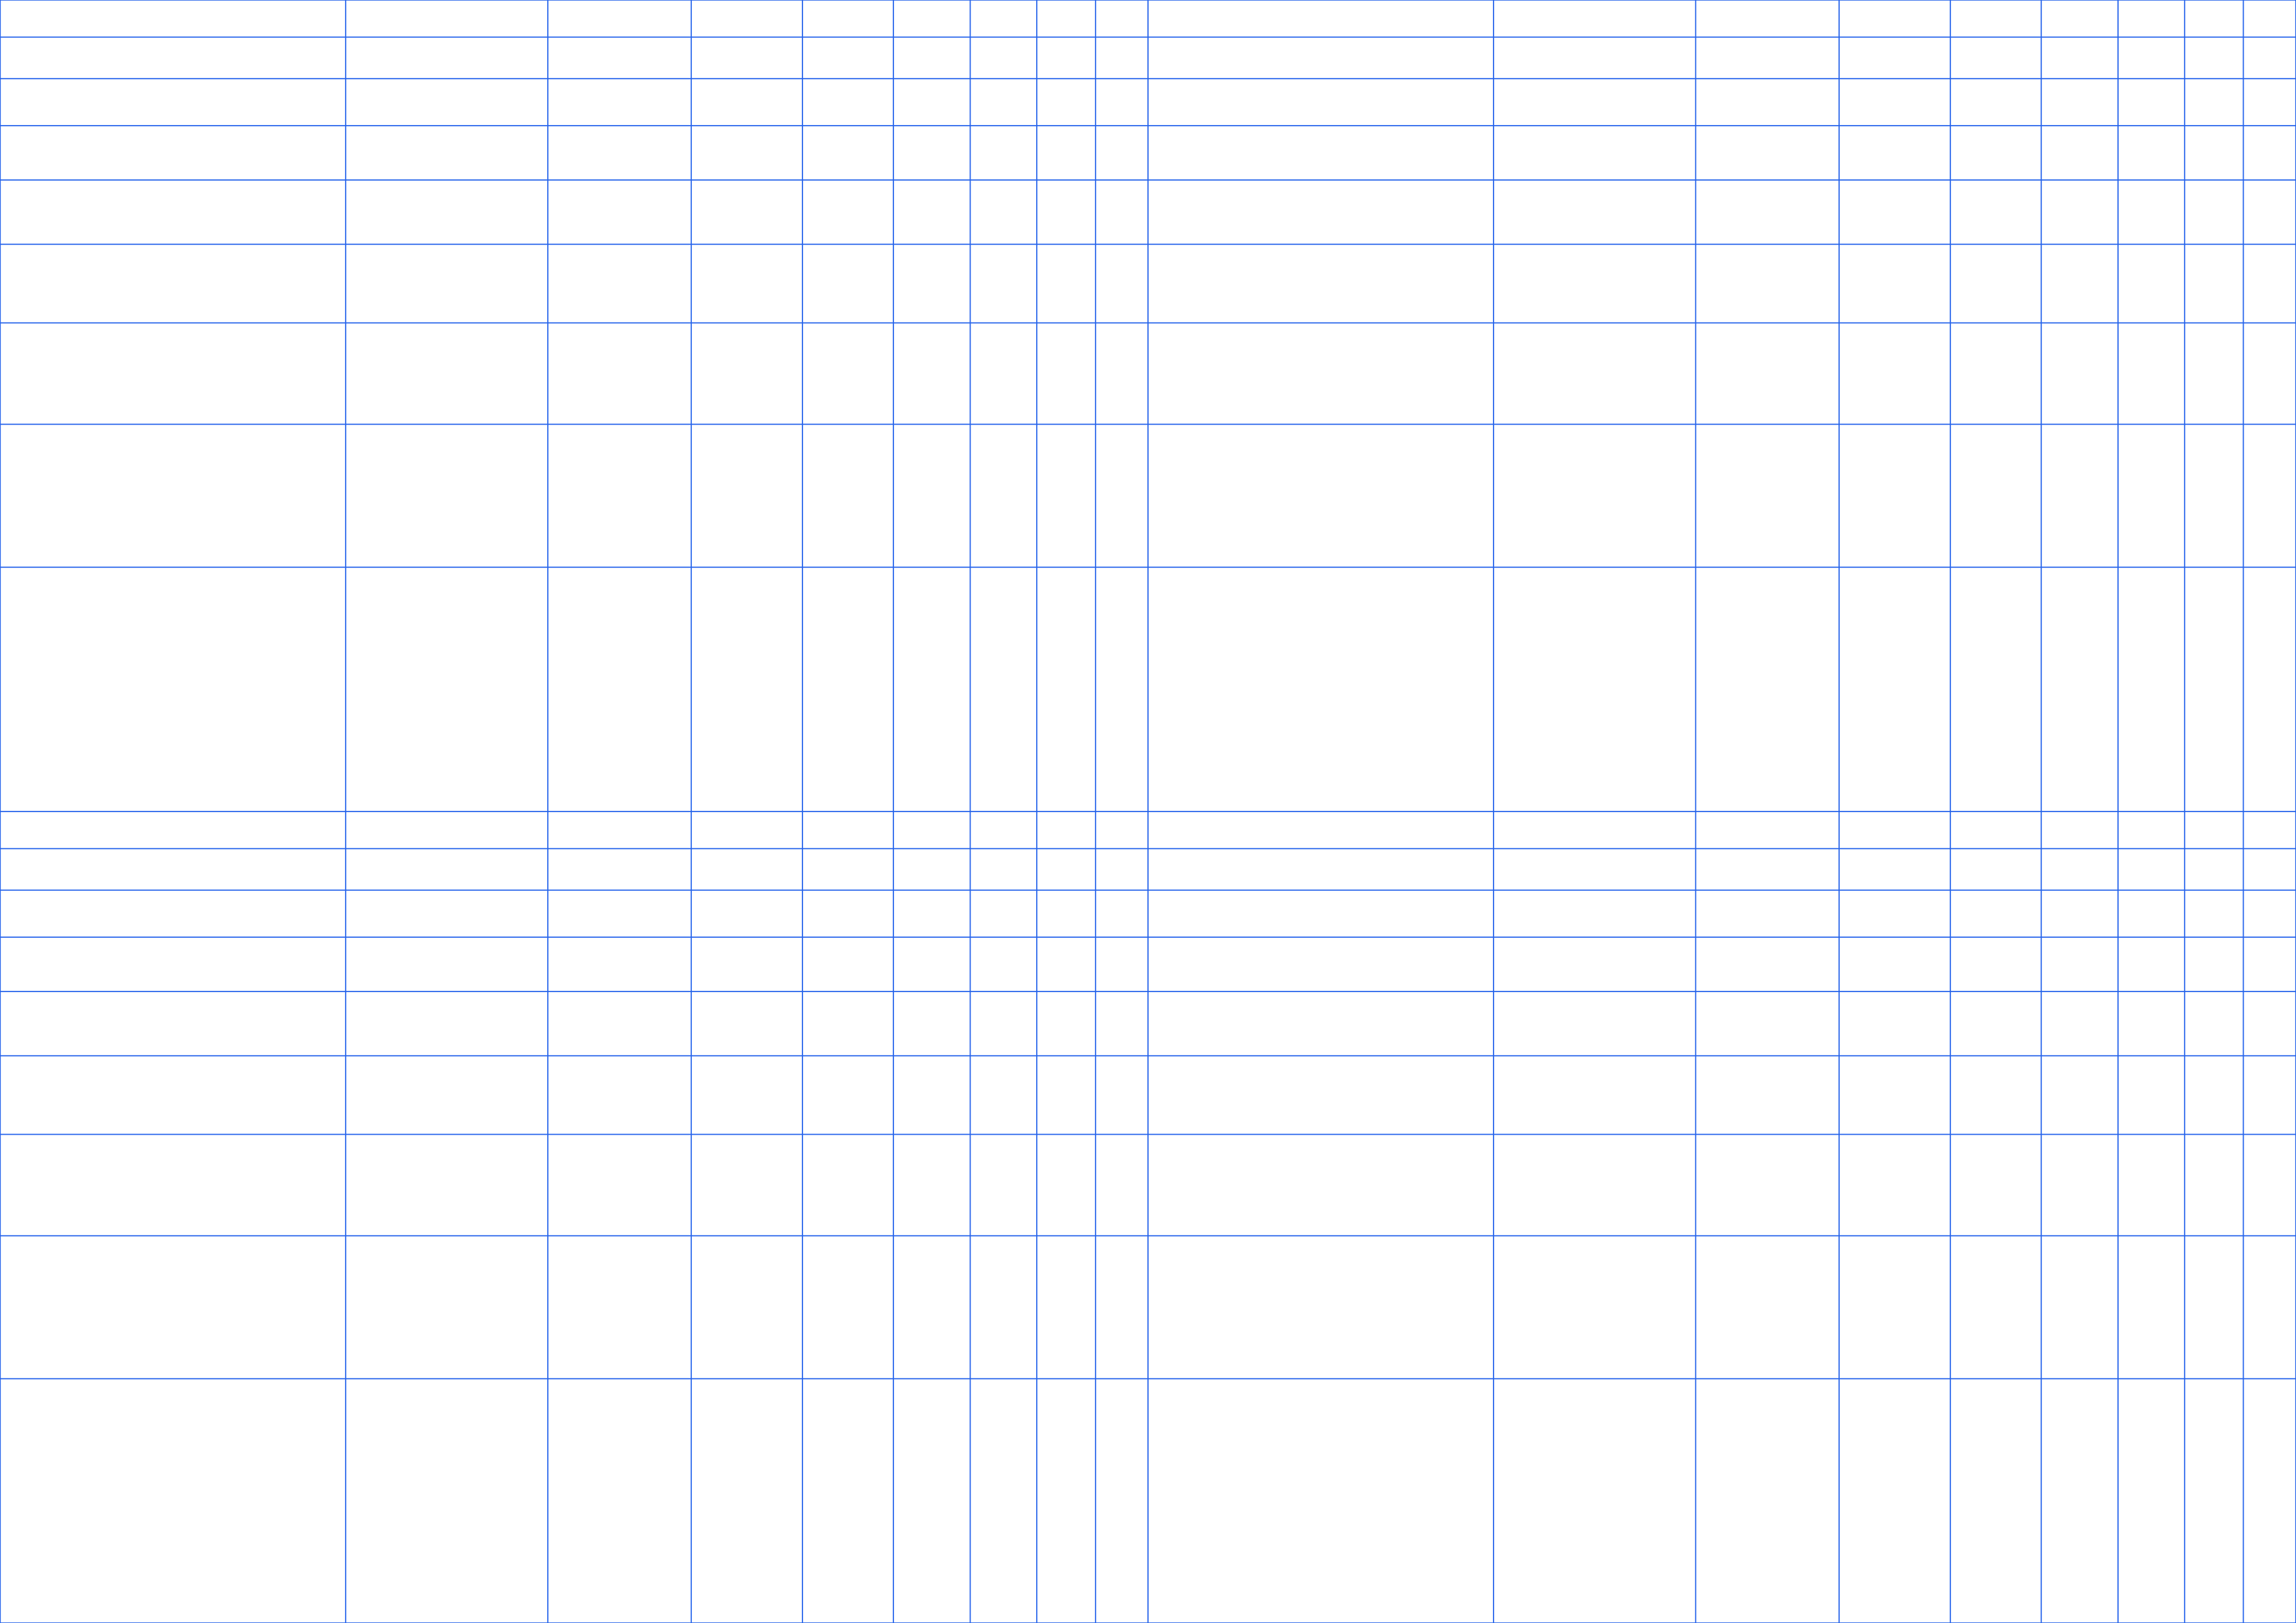
Letter — 216 × 279 mm (8.5 × 11 in)
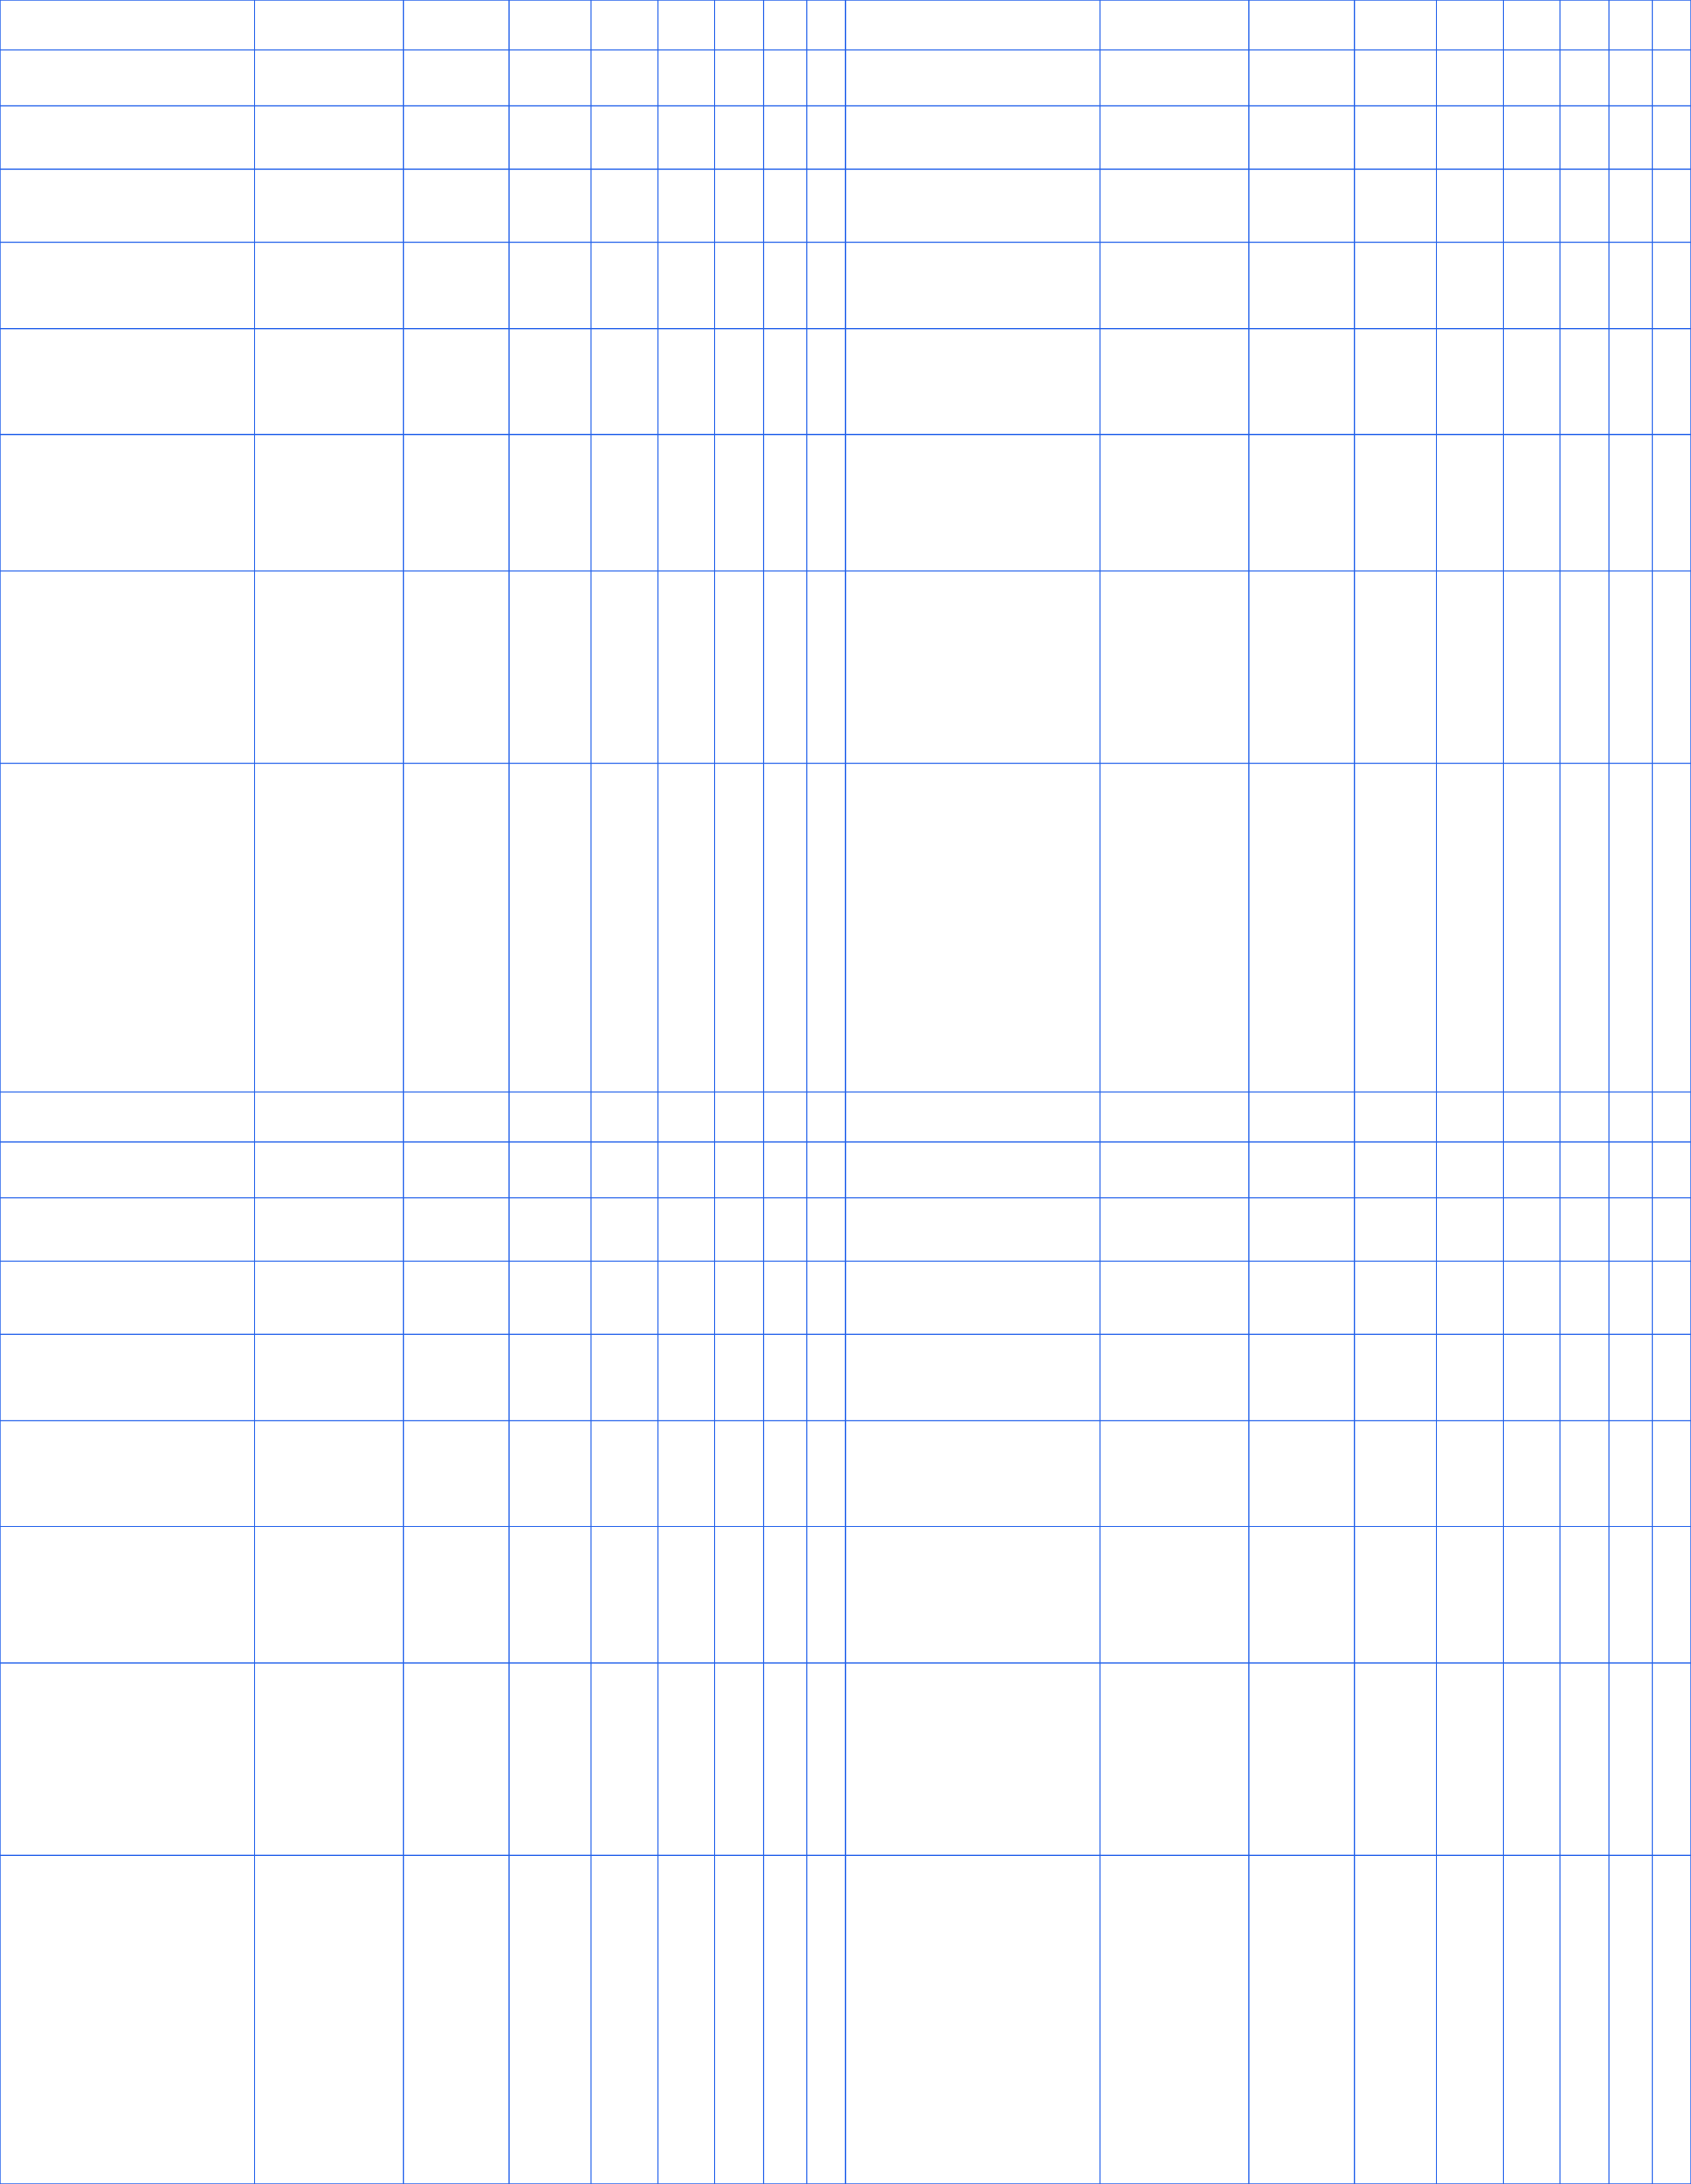
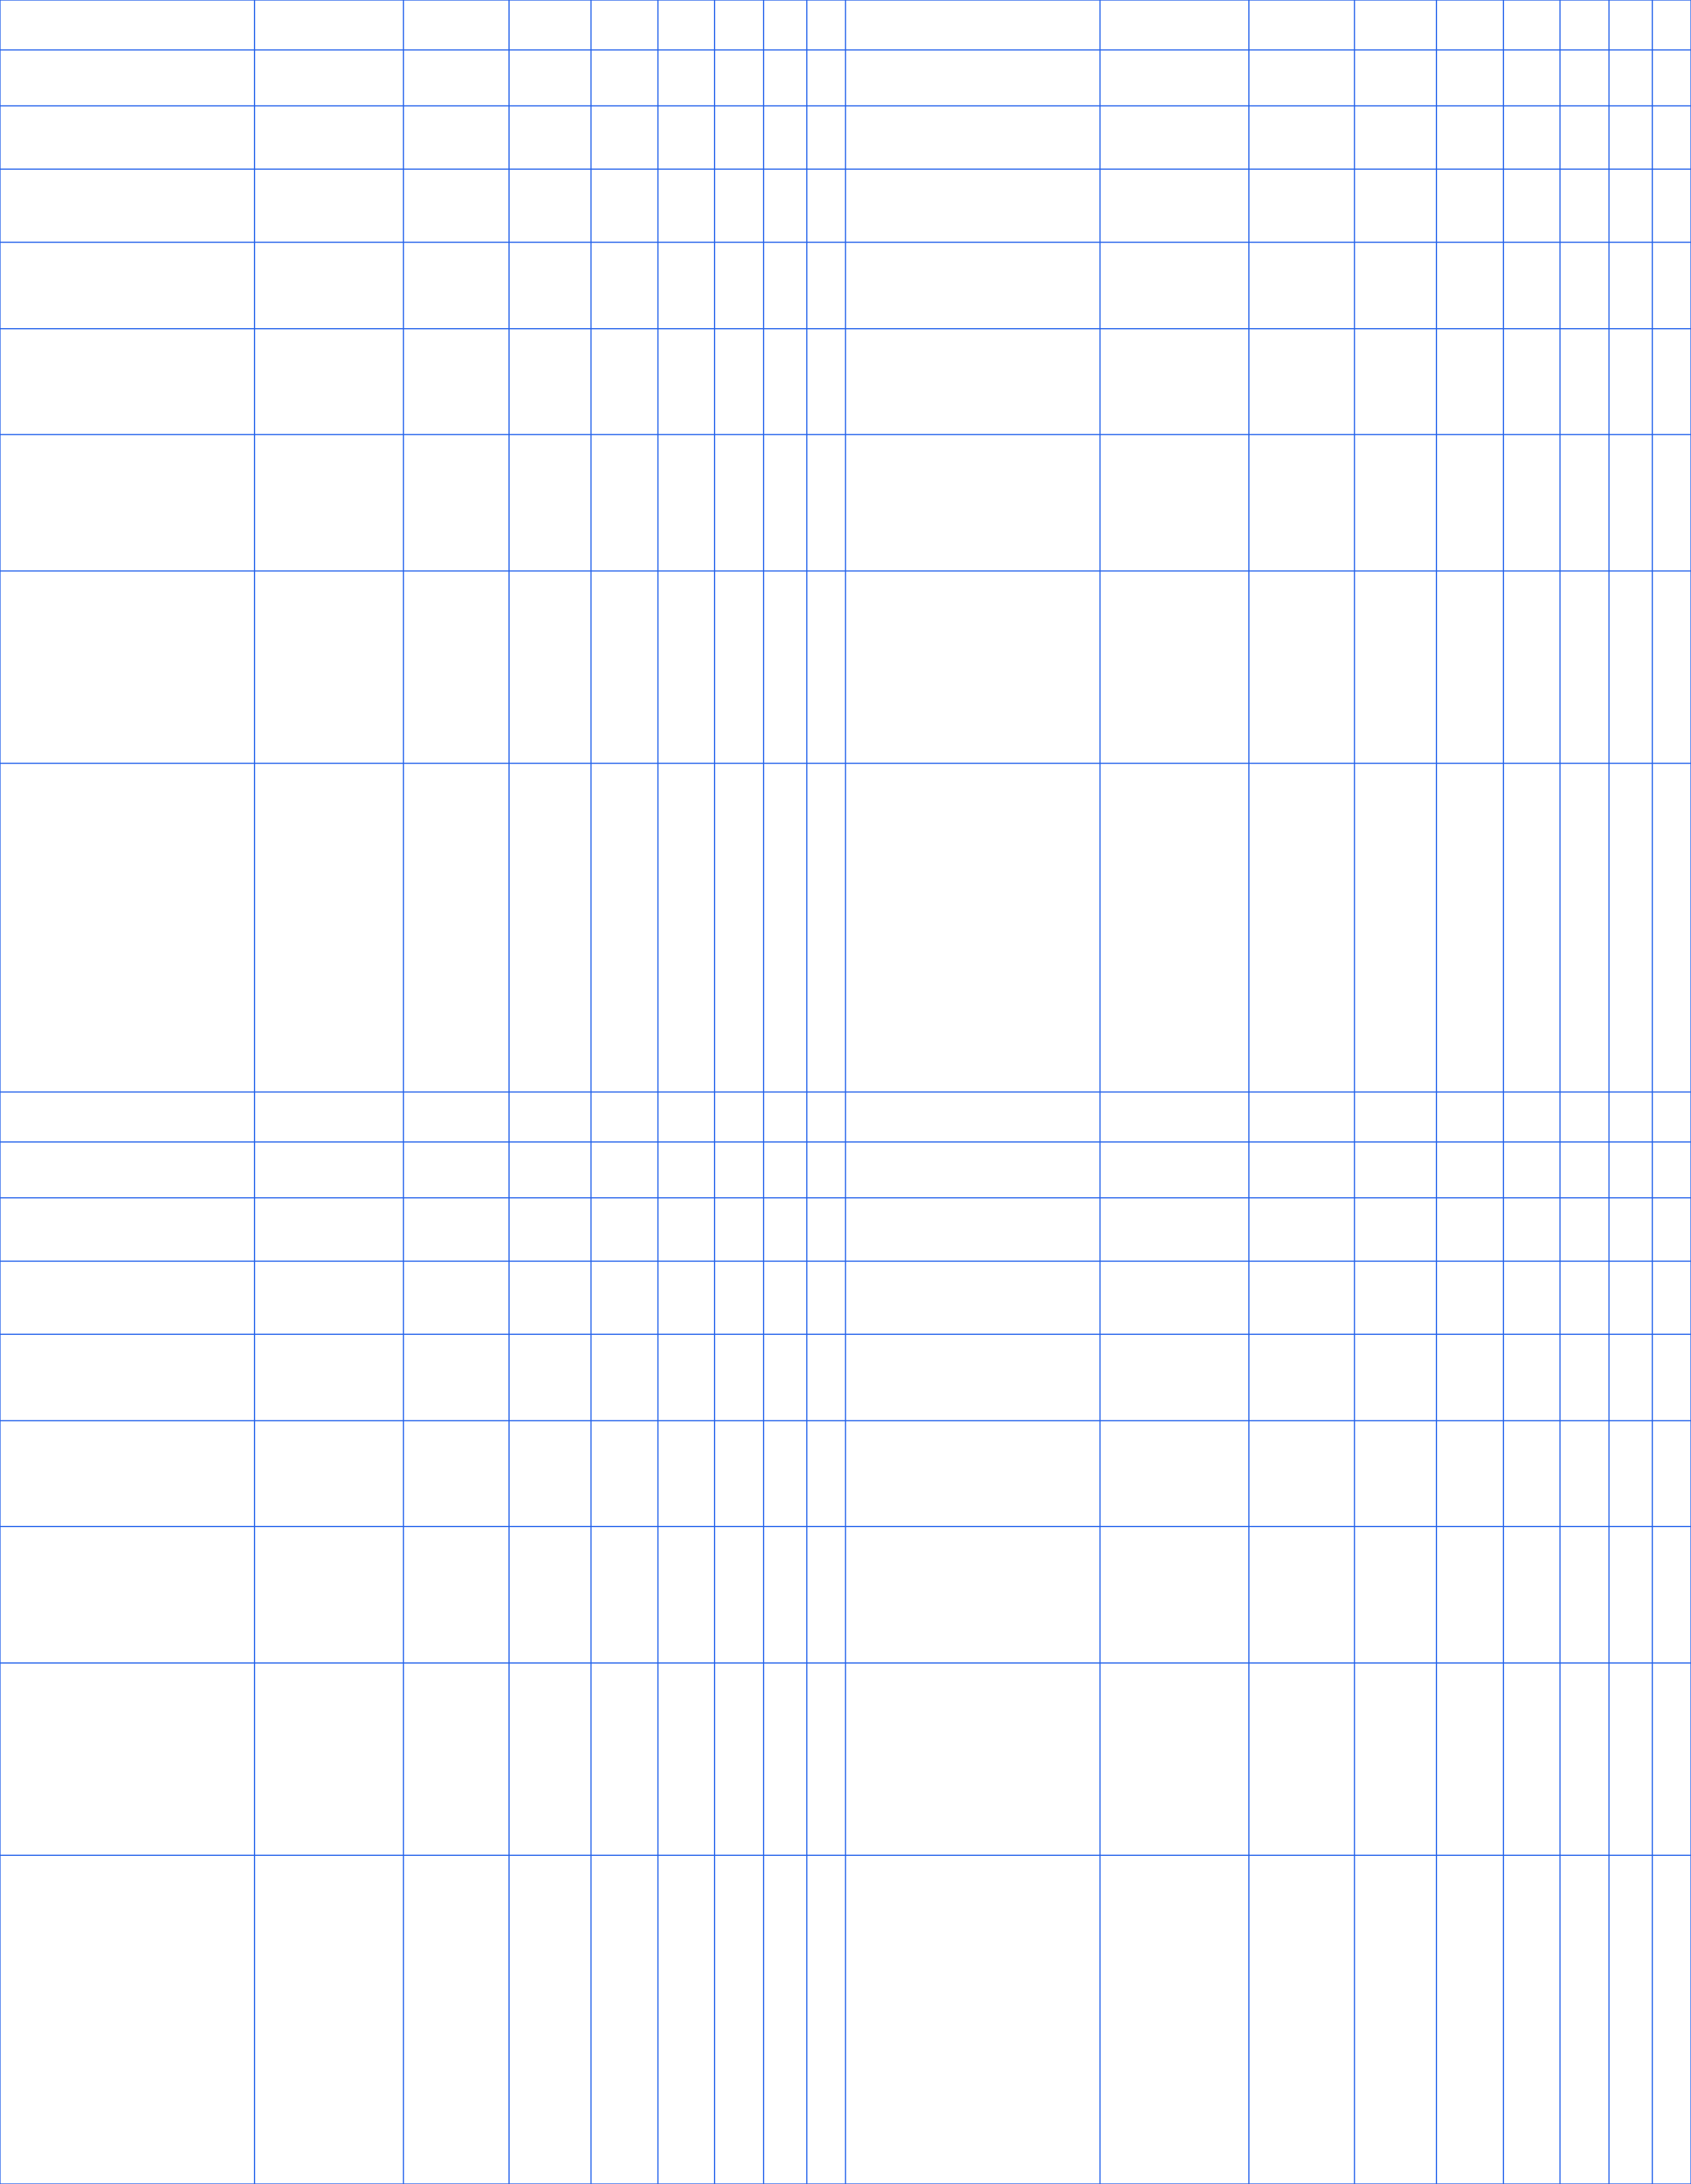
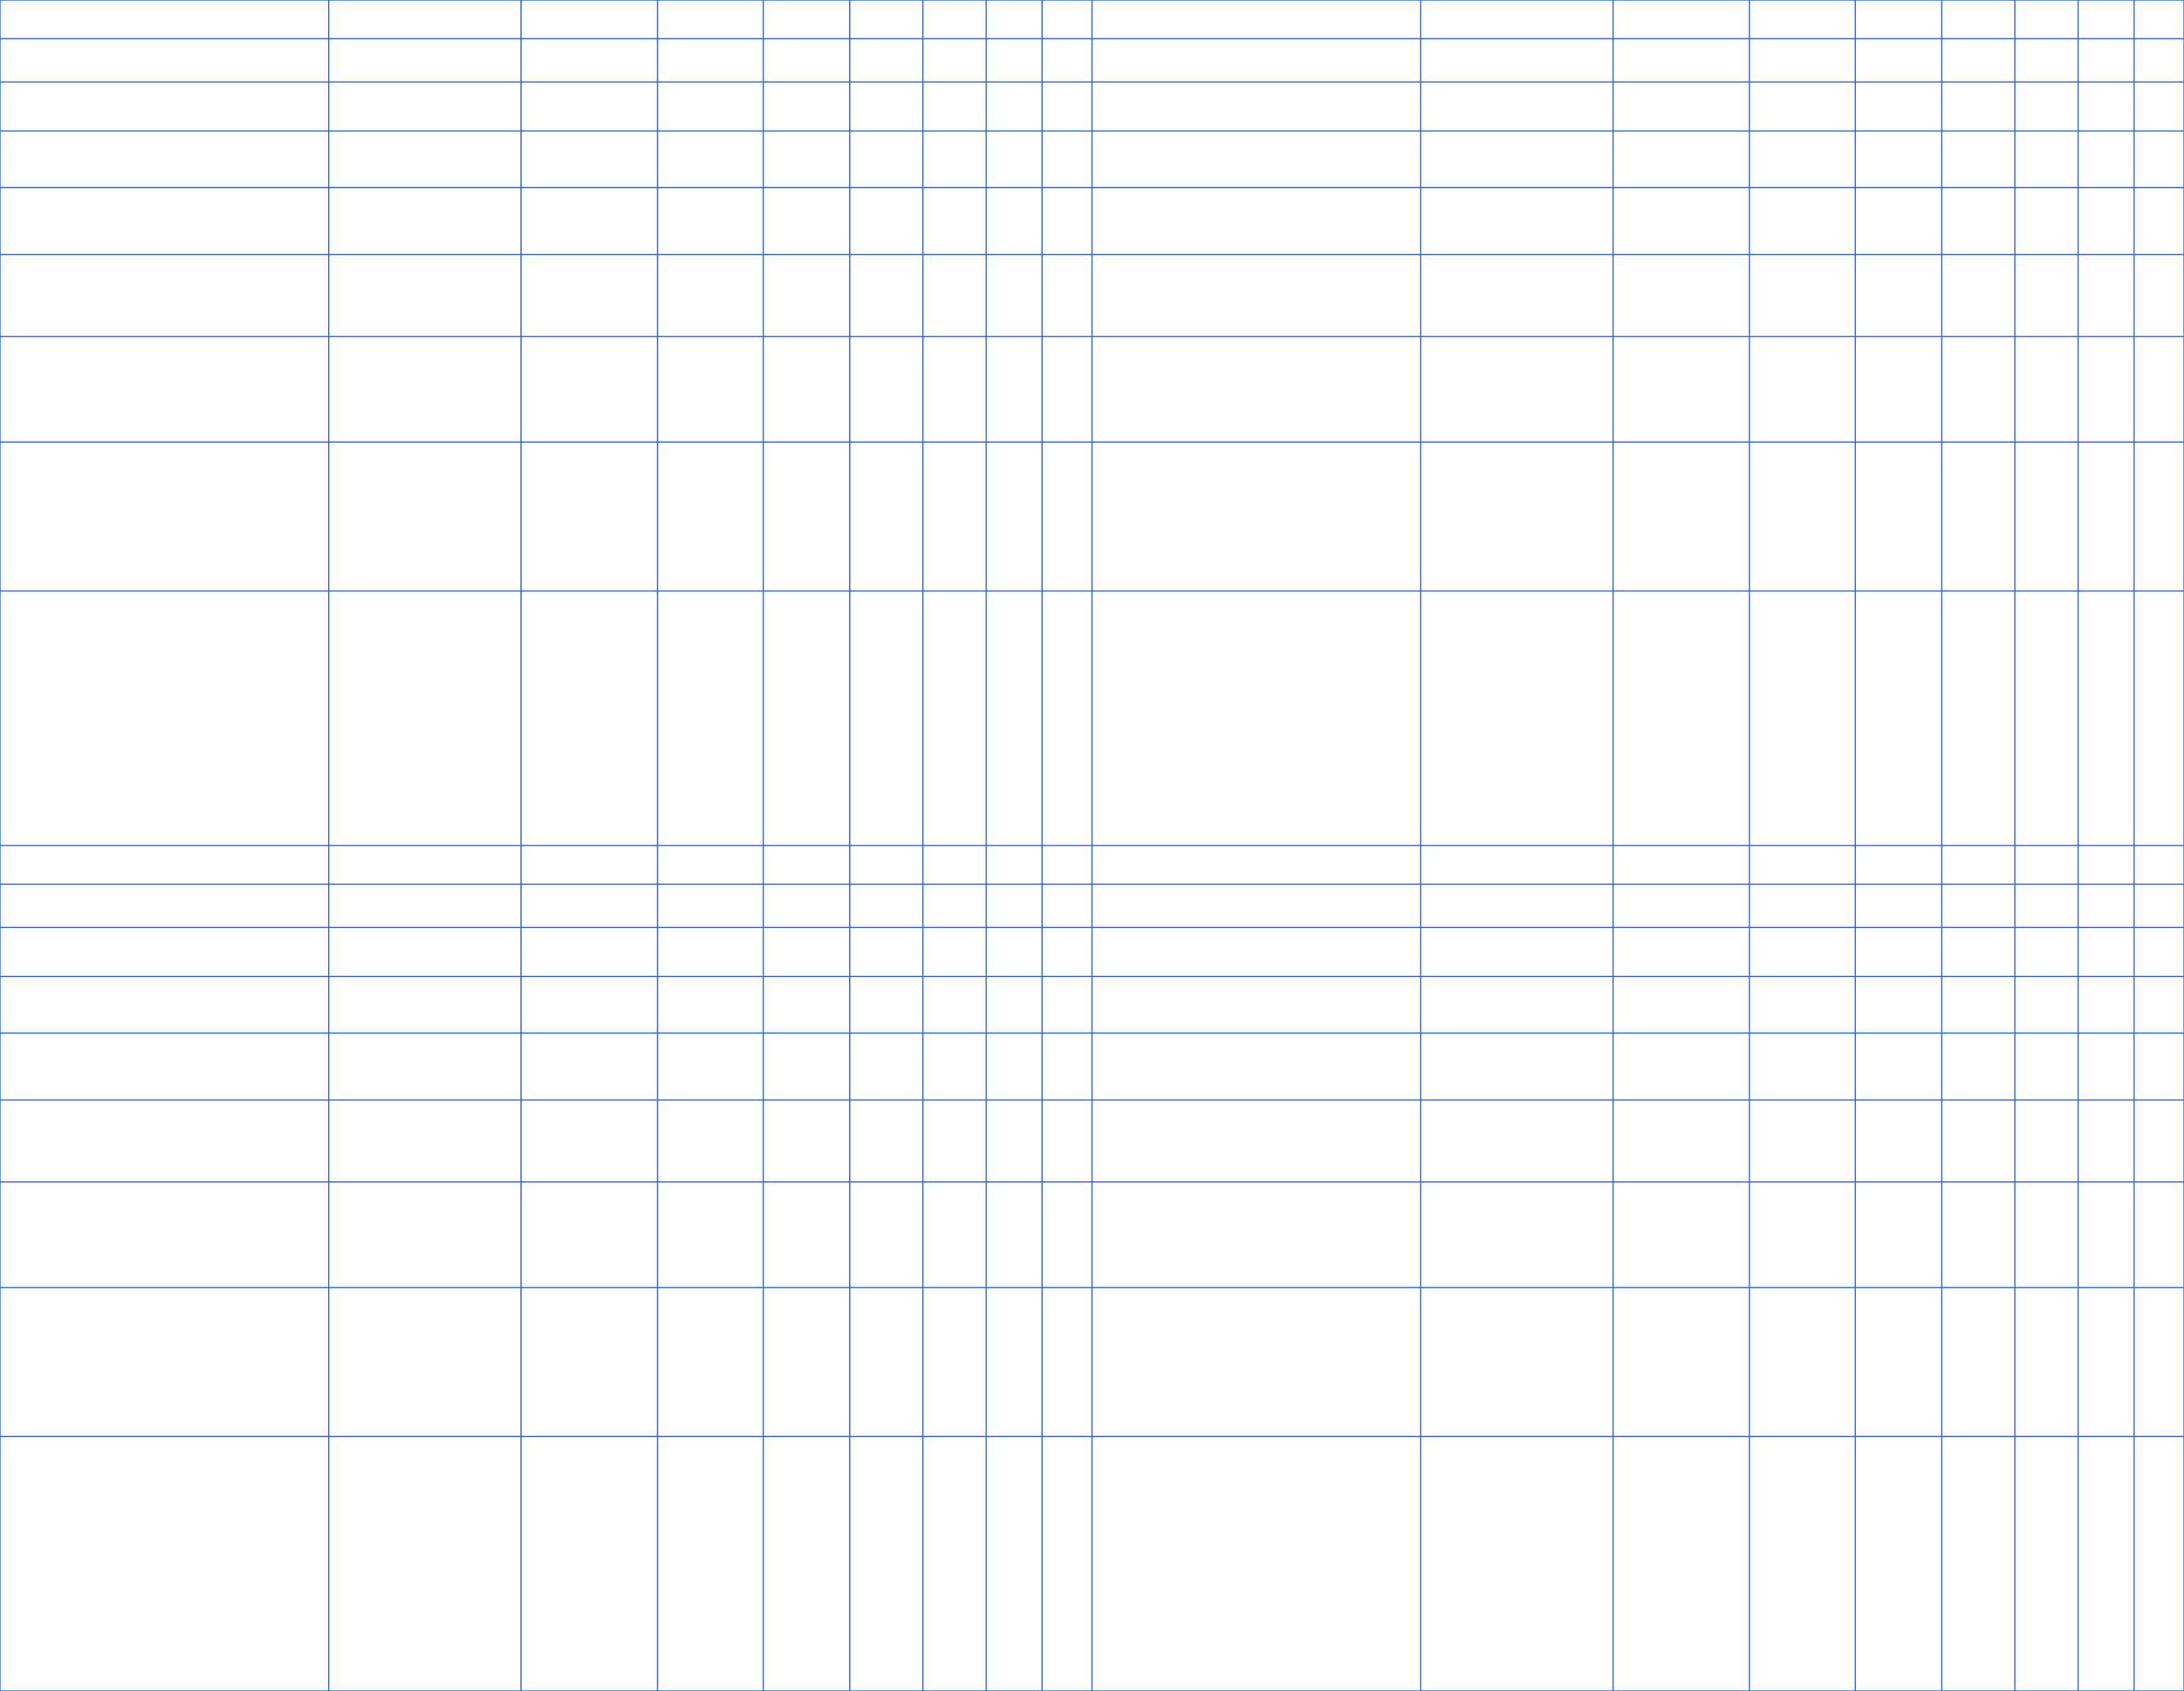
A3 — 297 × 420 mm (11.69 × 16.54 in)
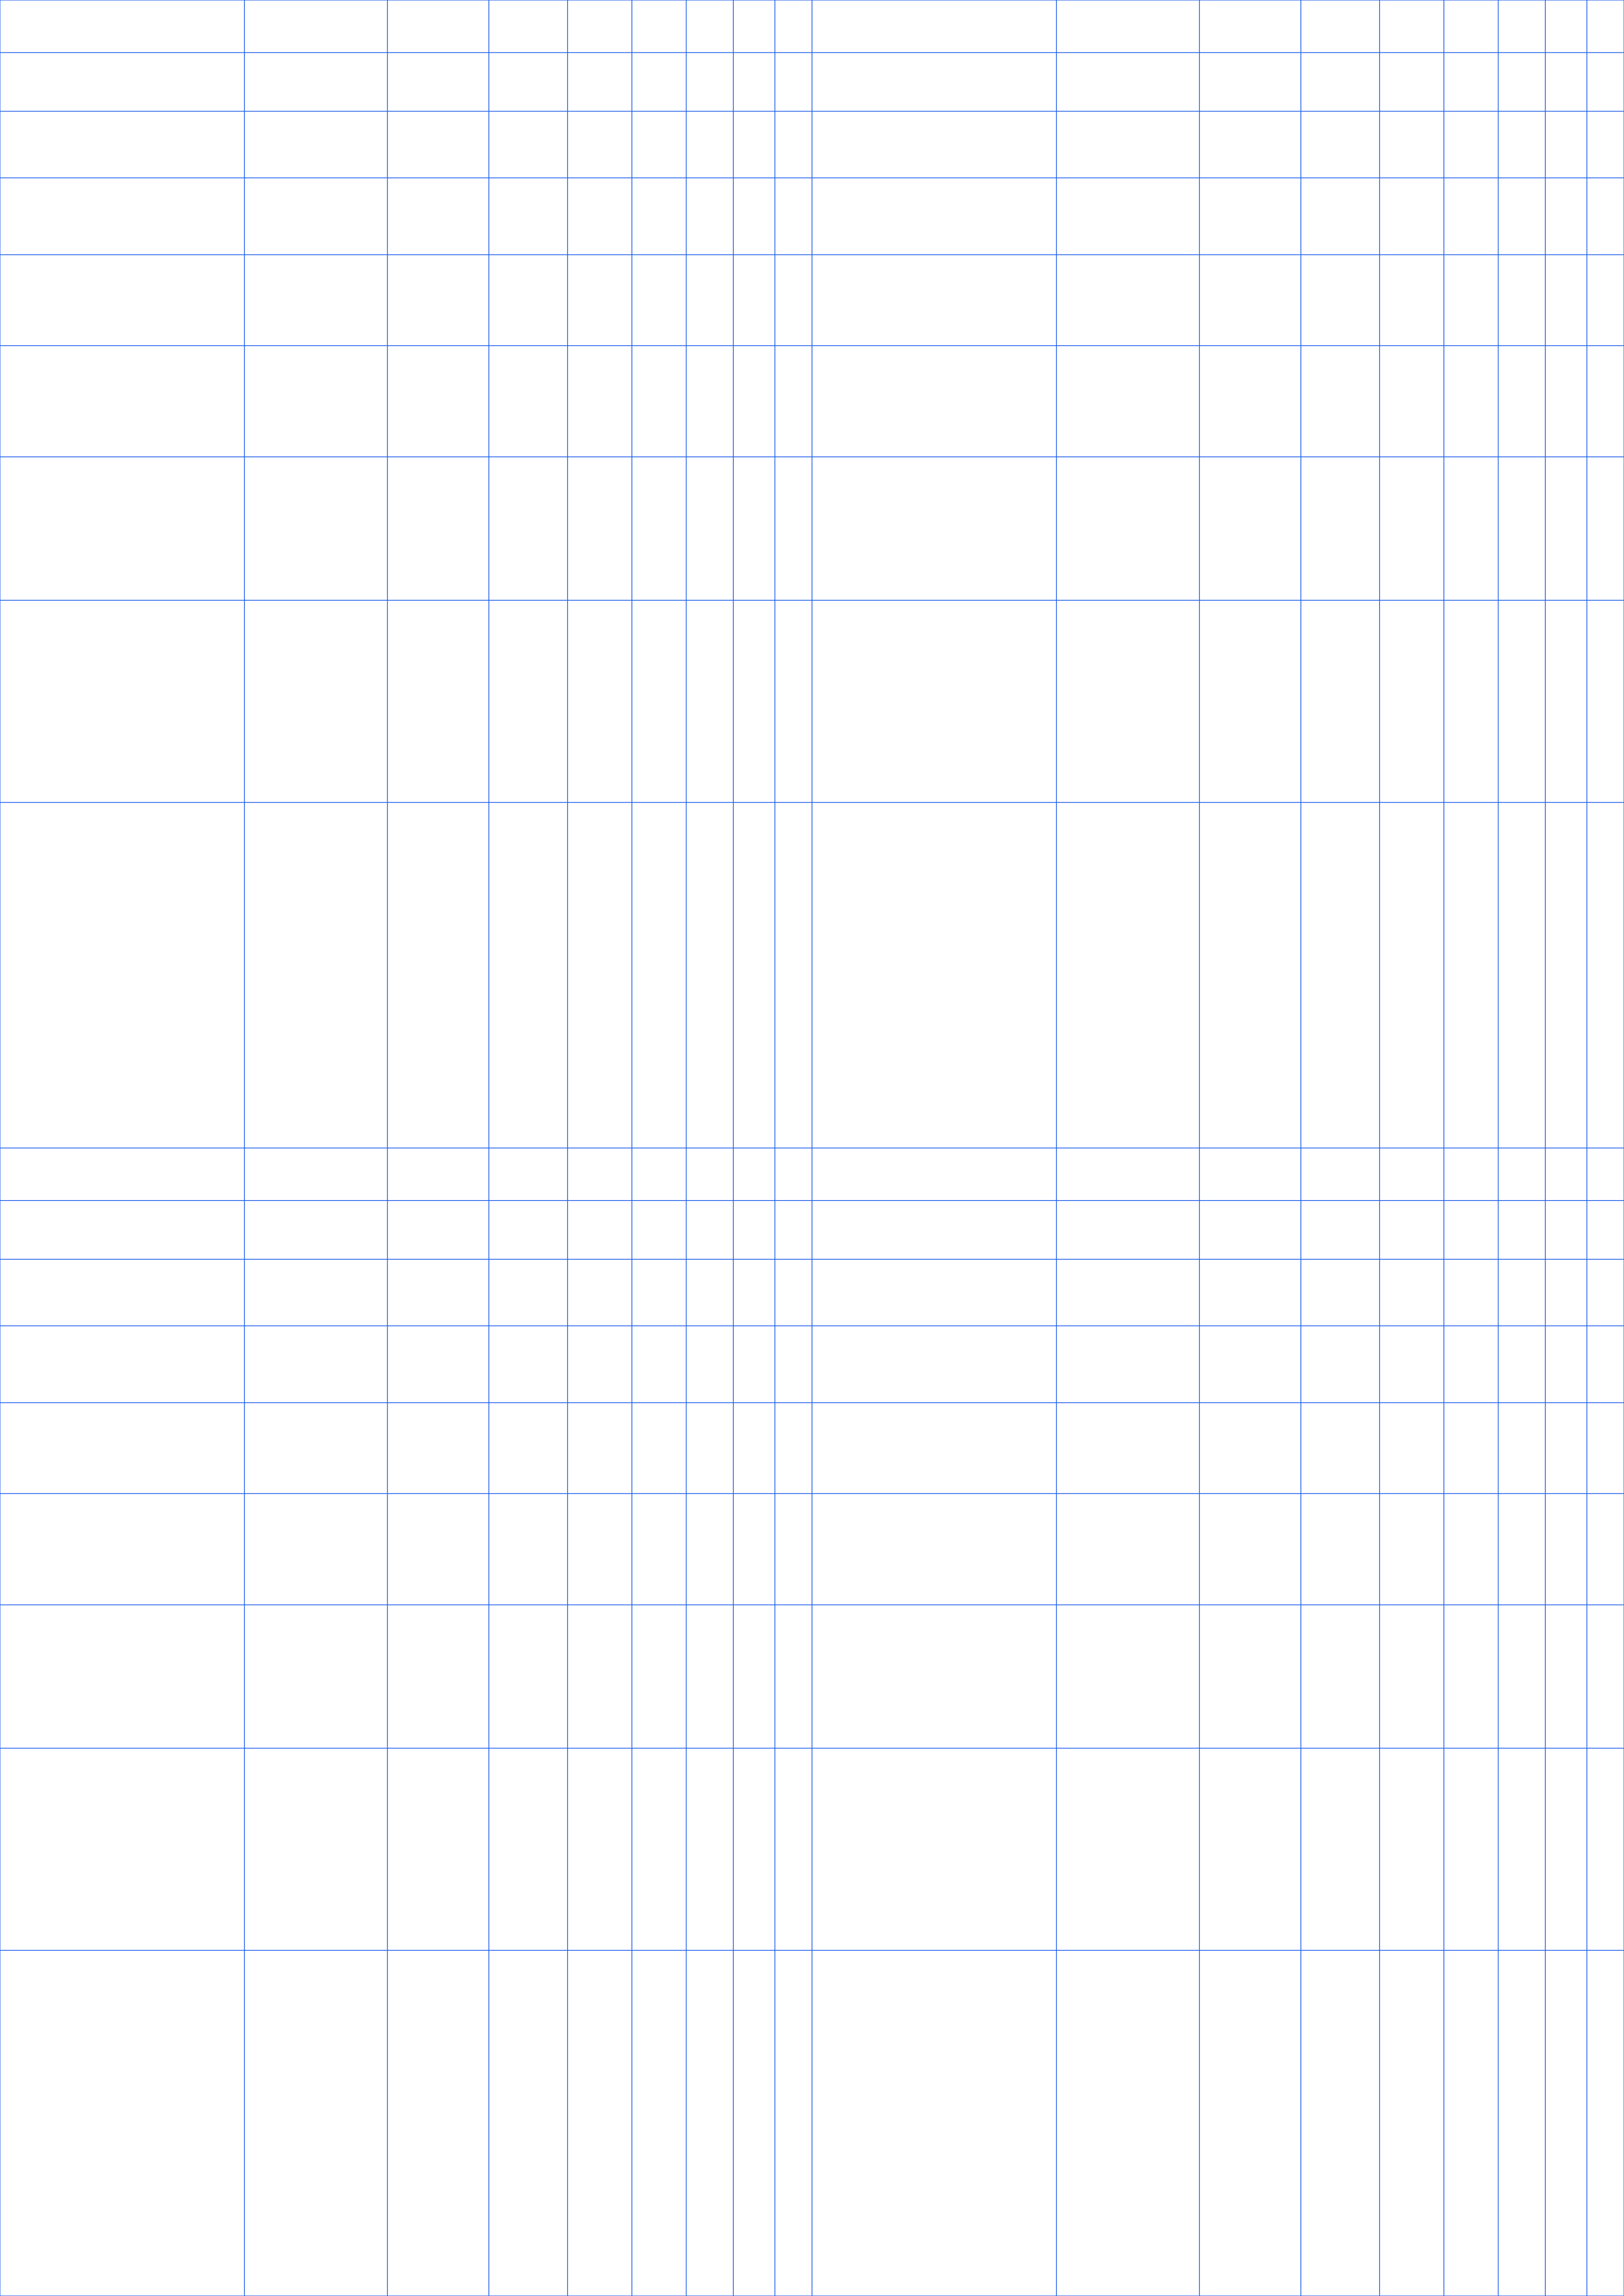
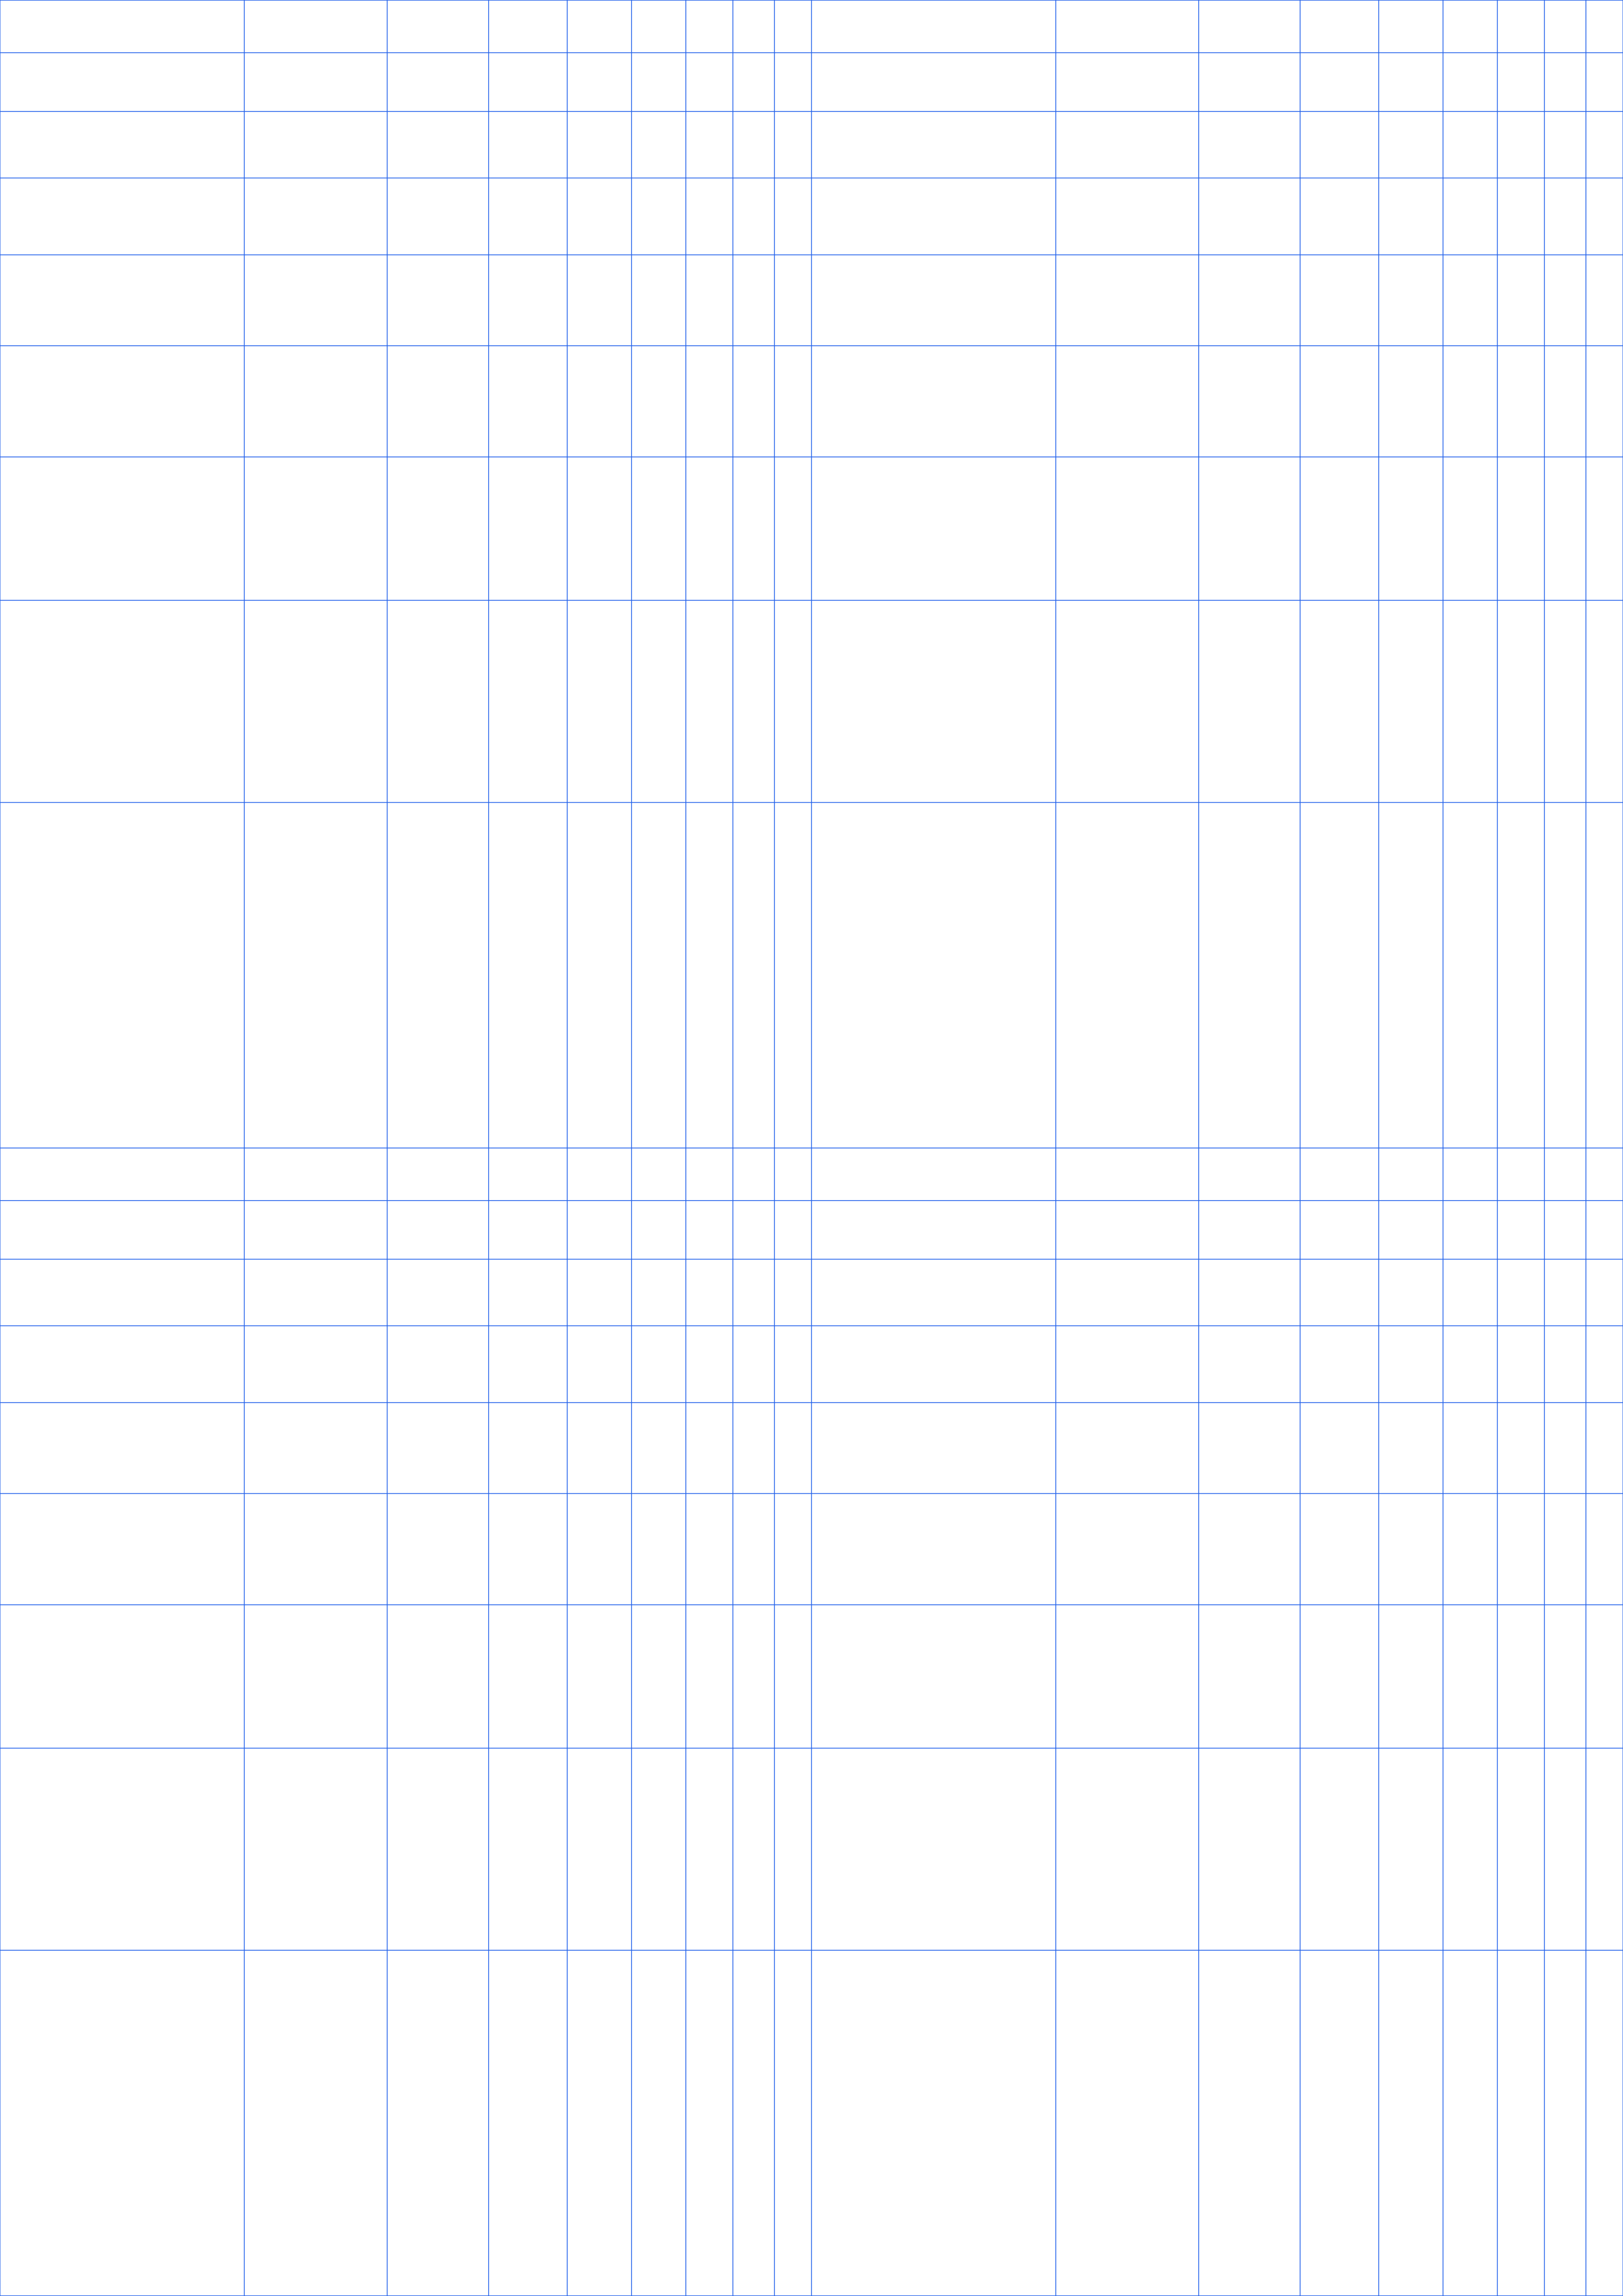
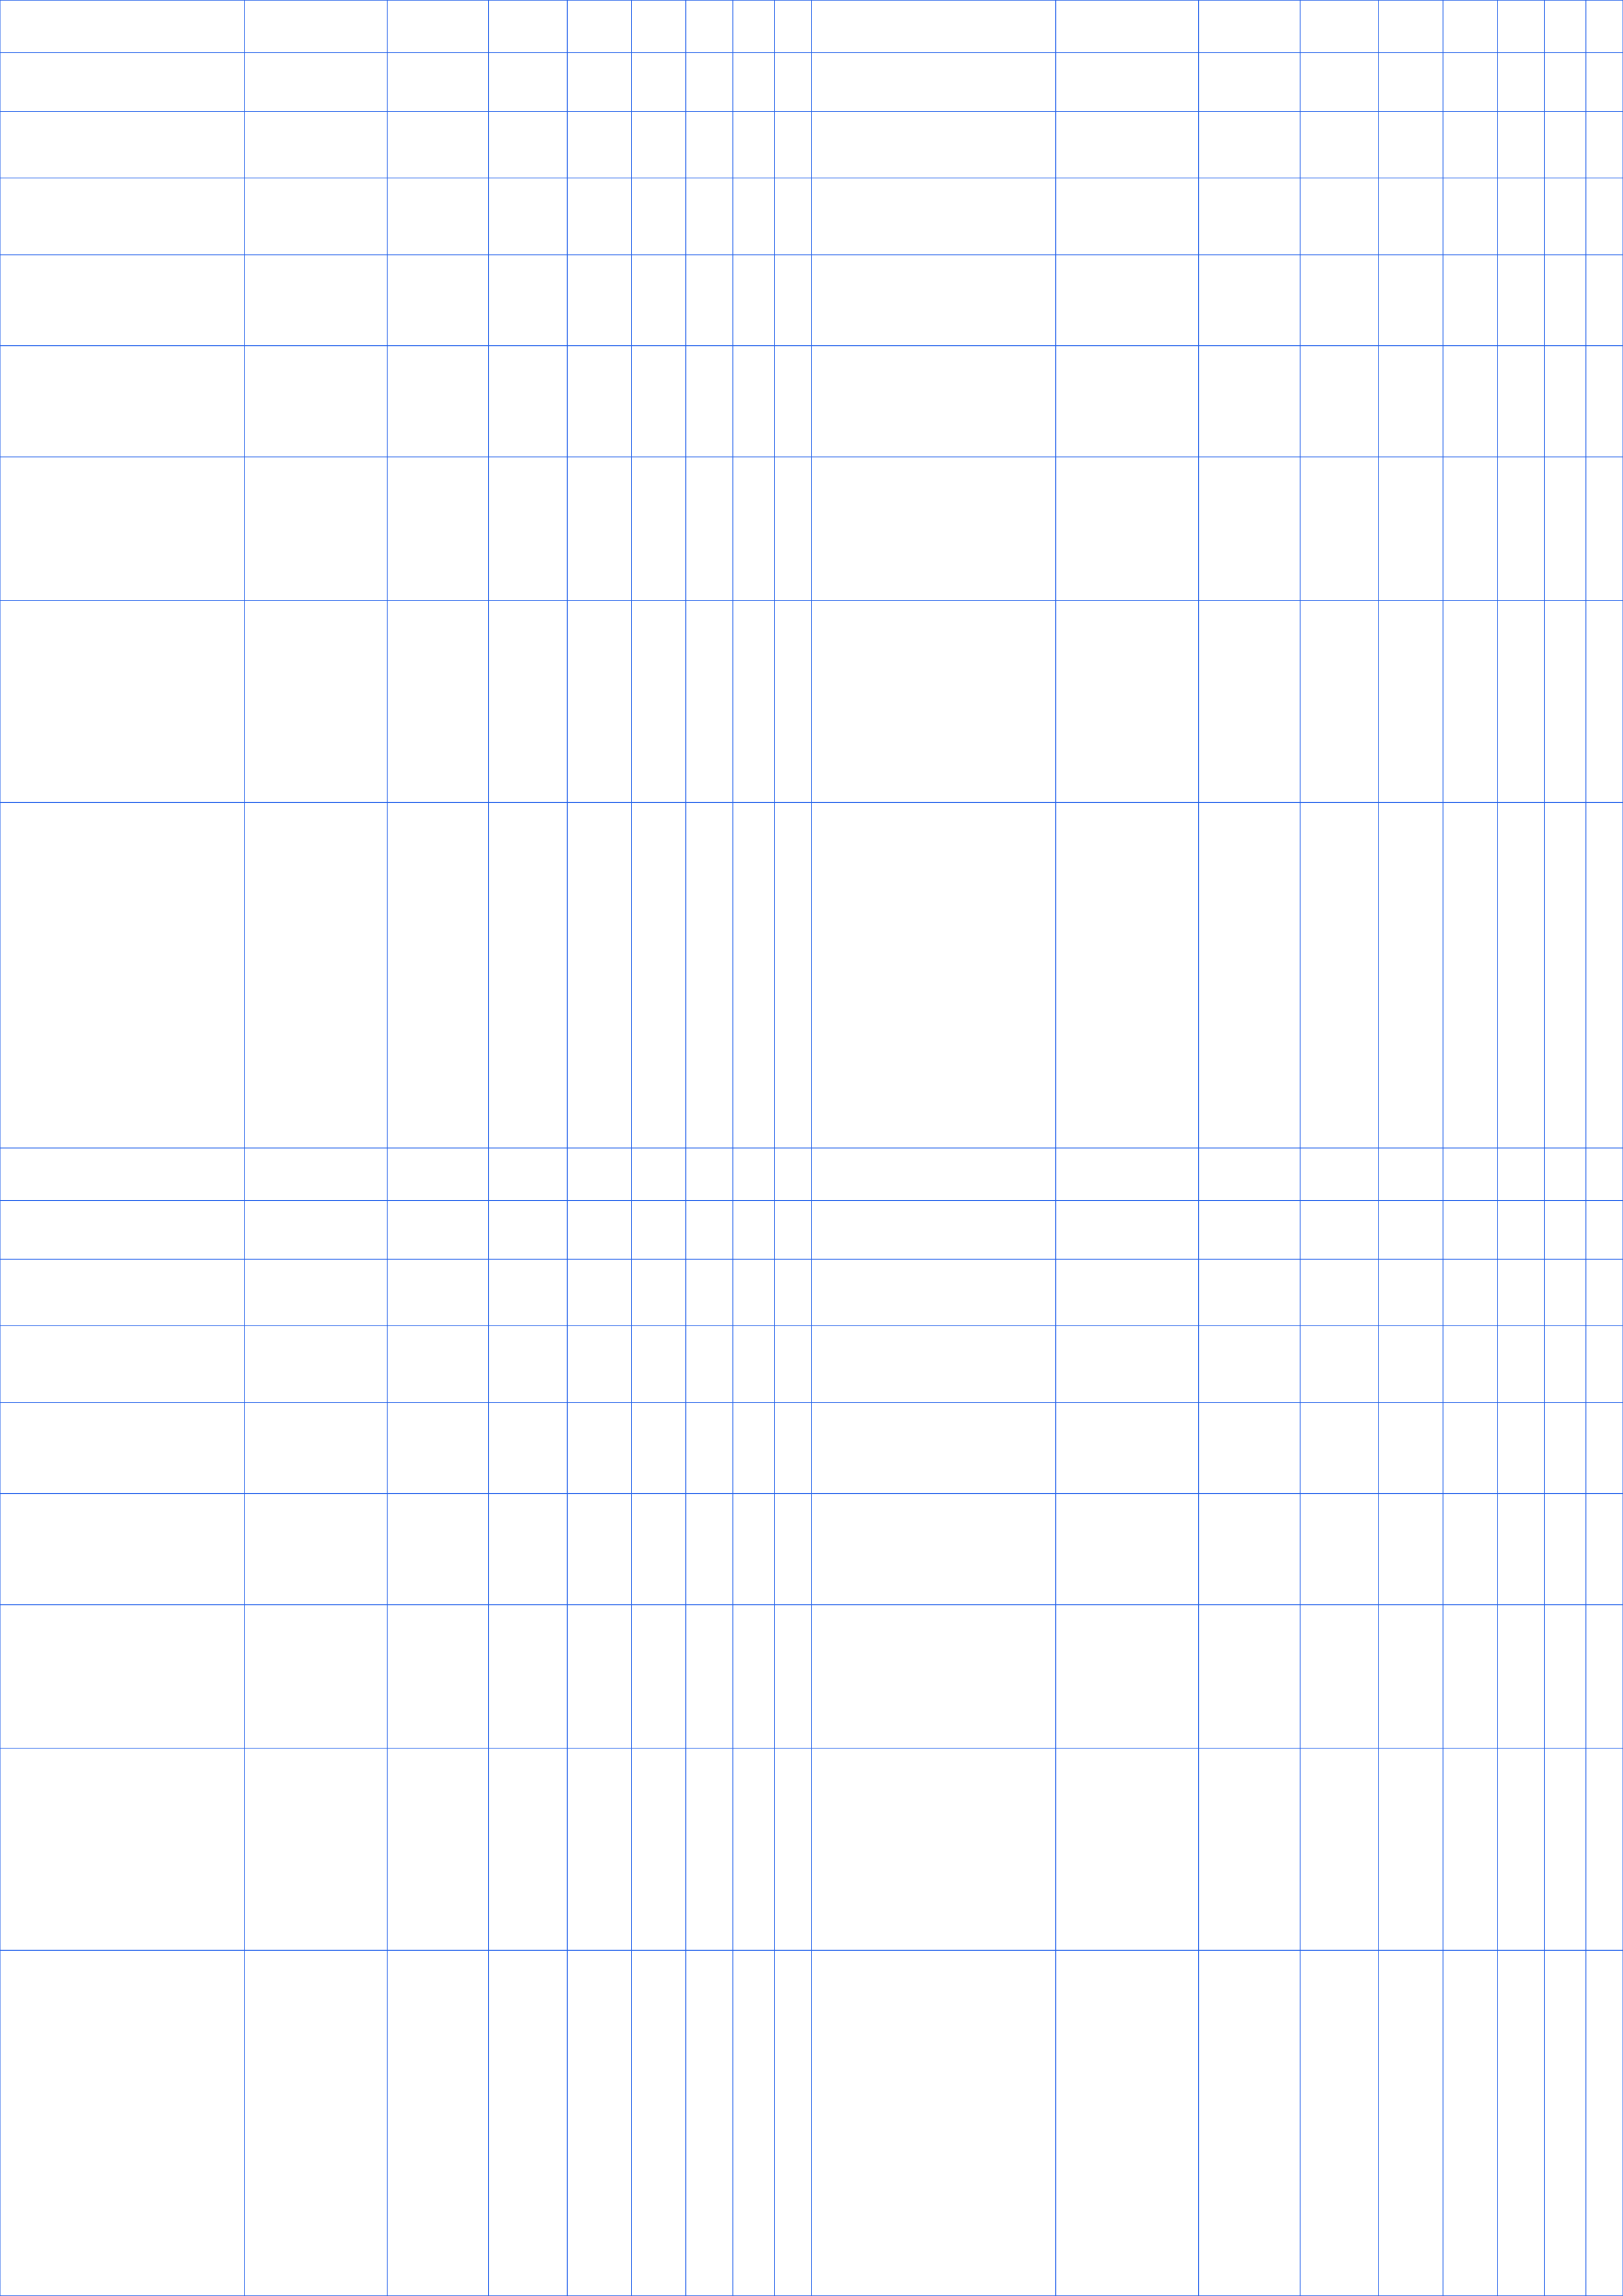
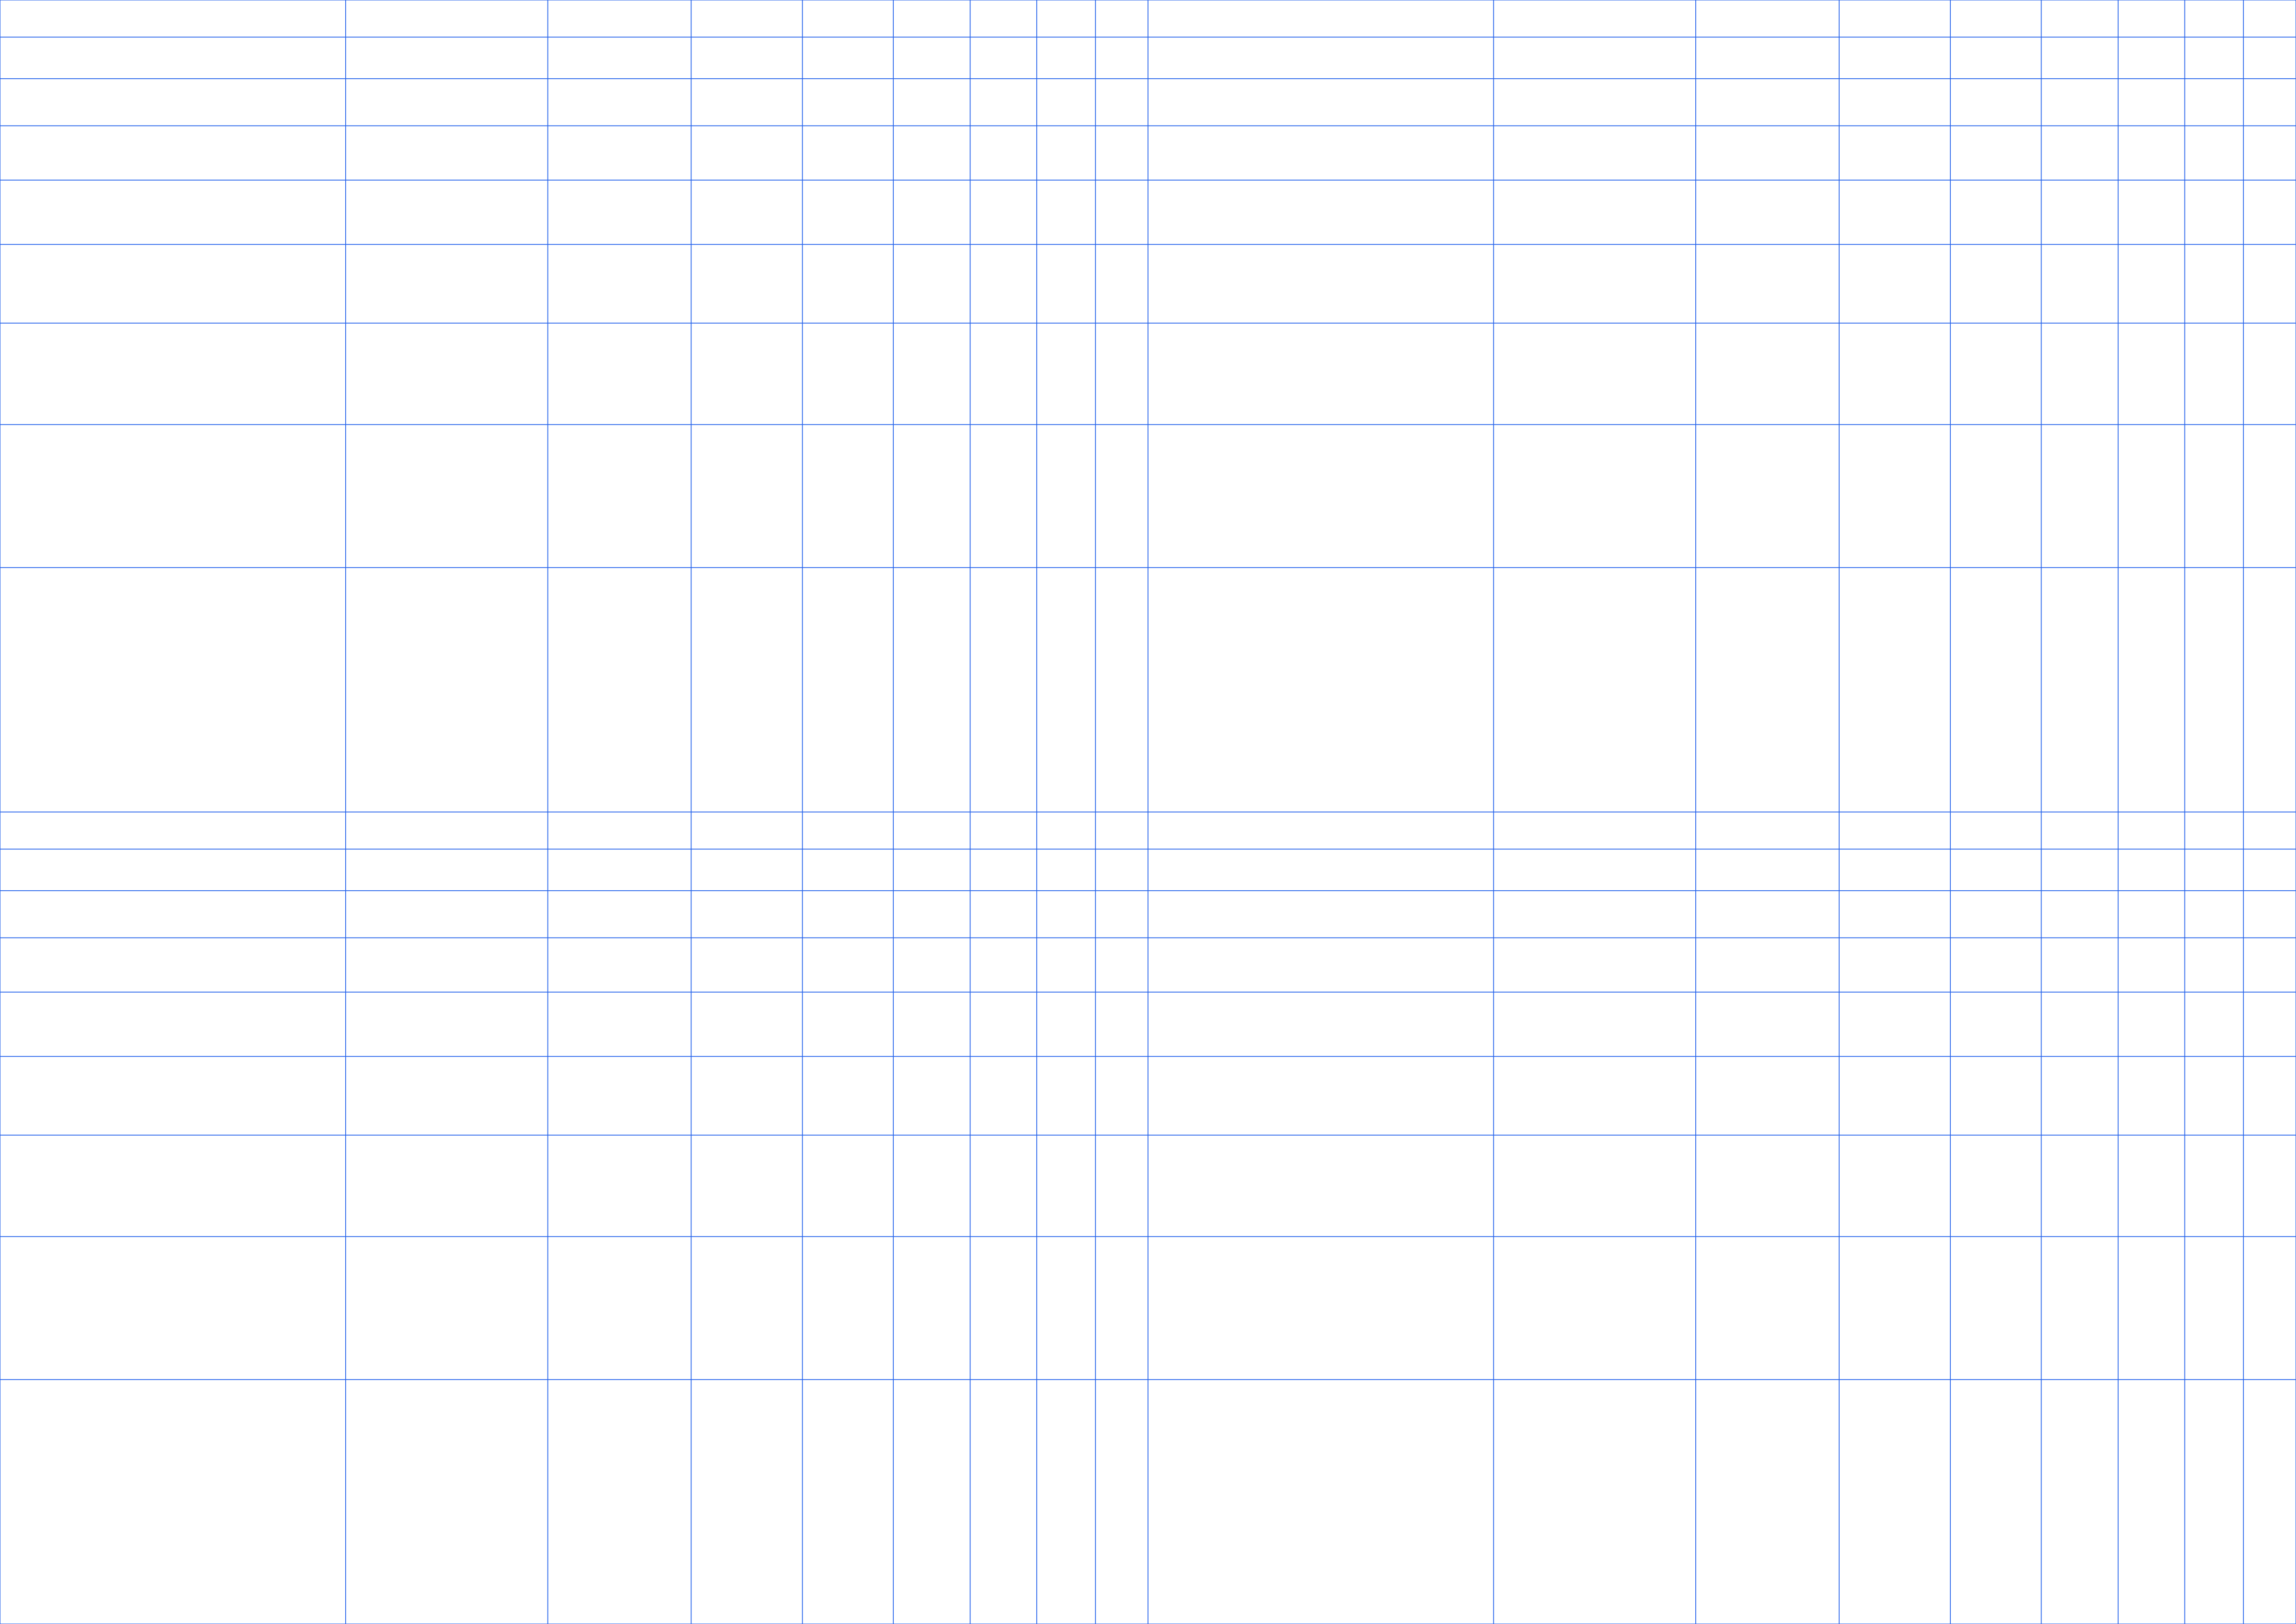
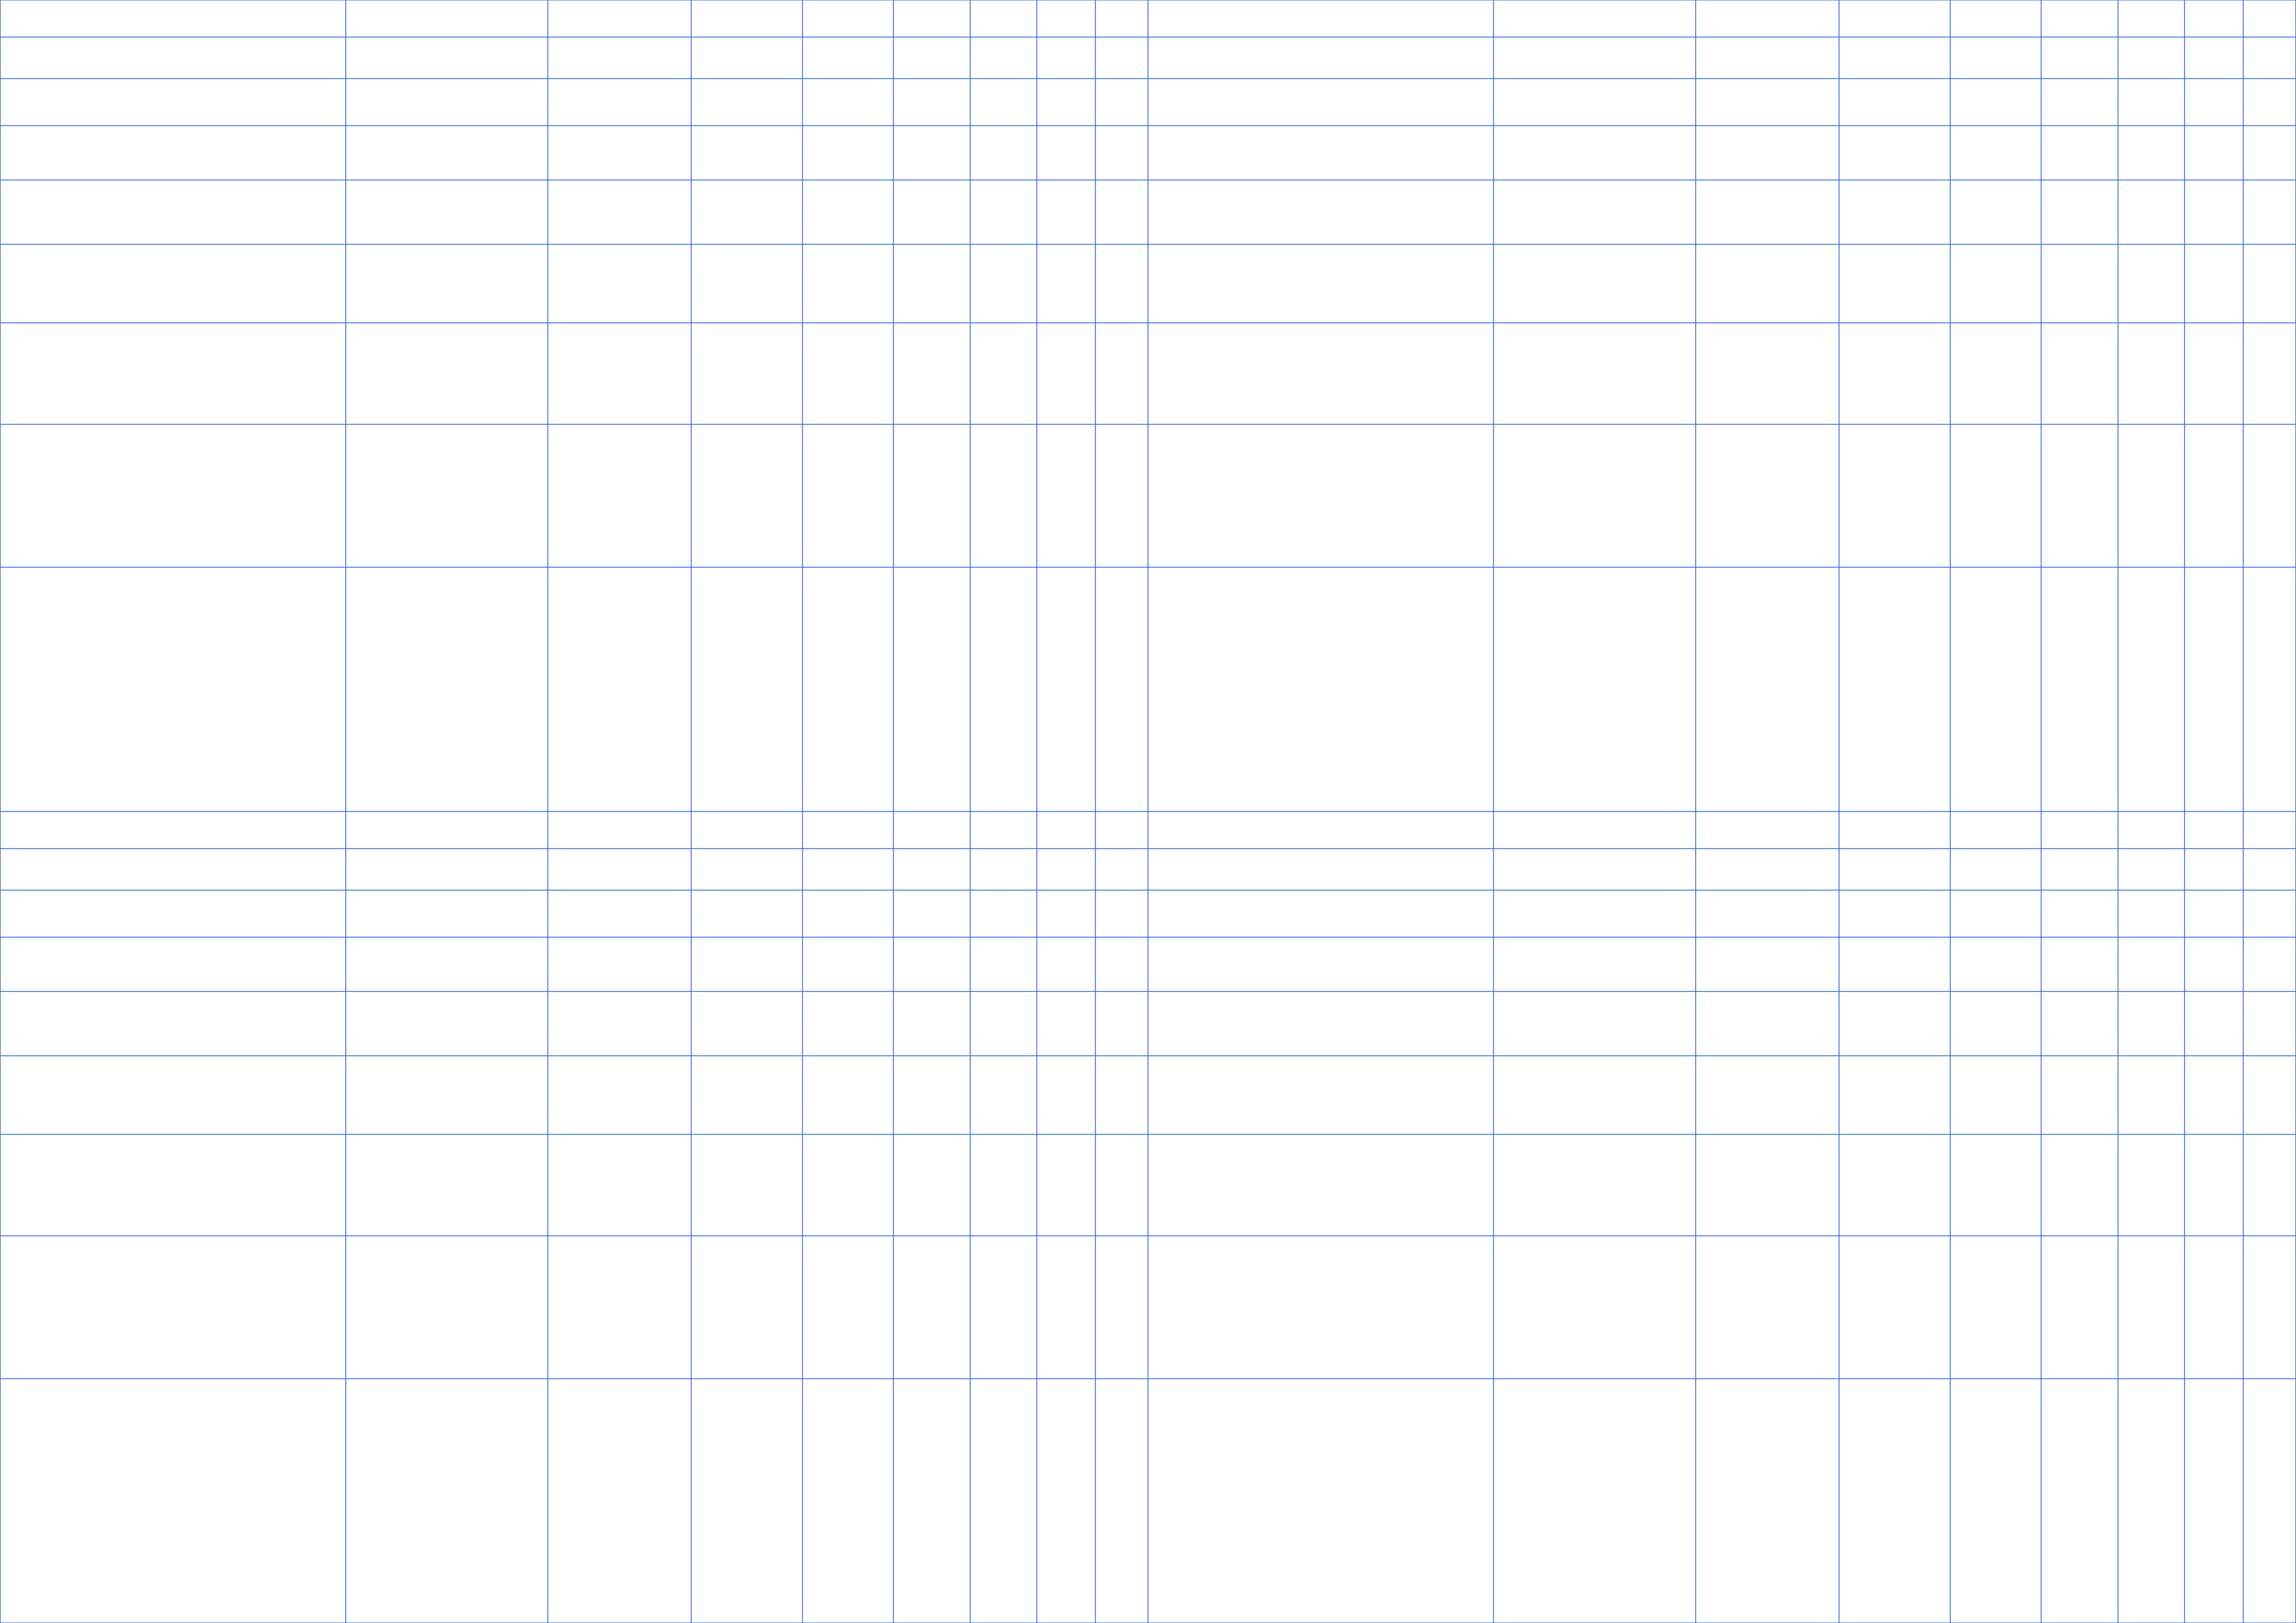
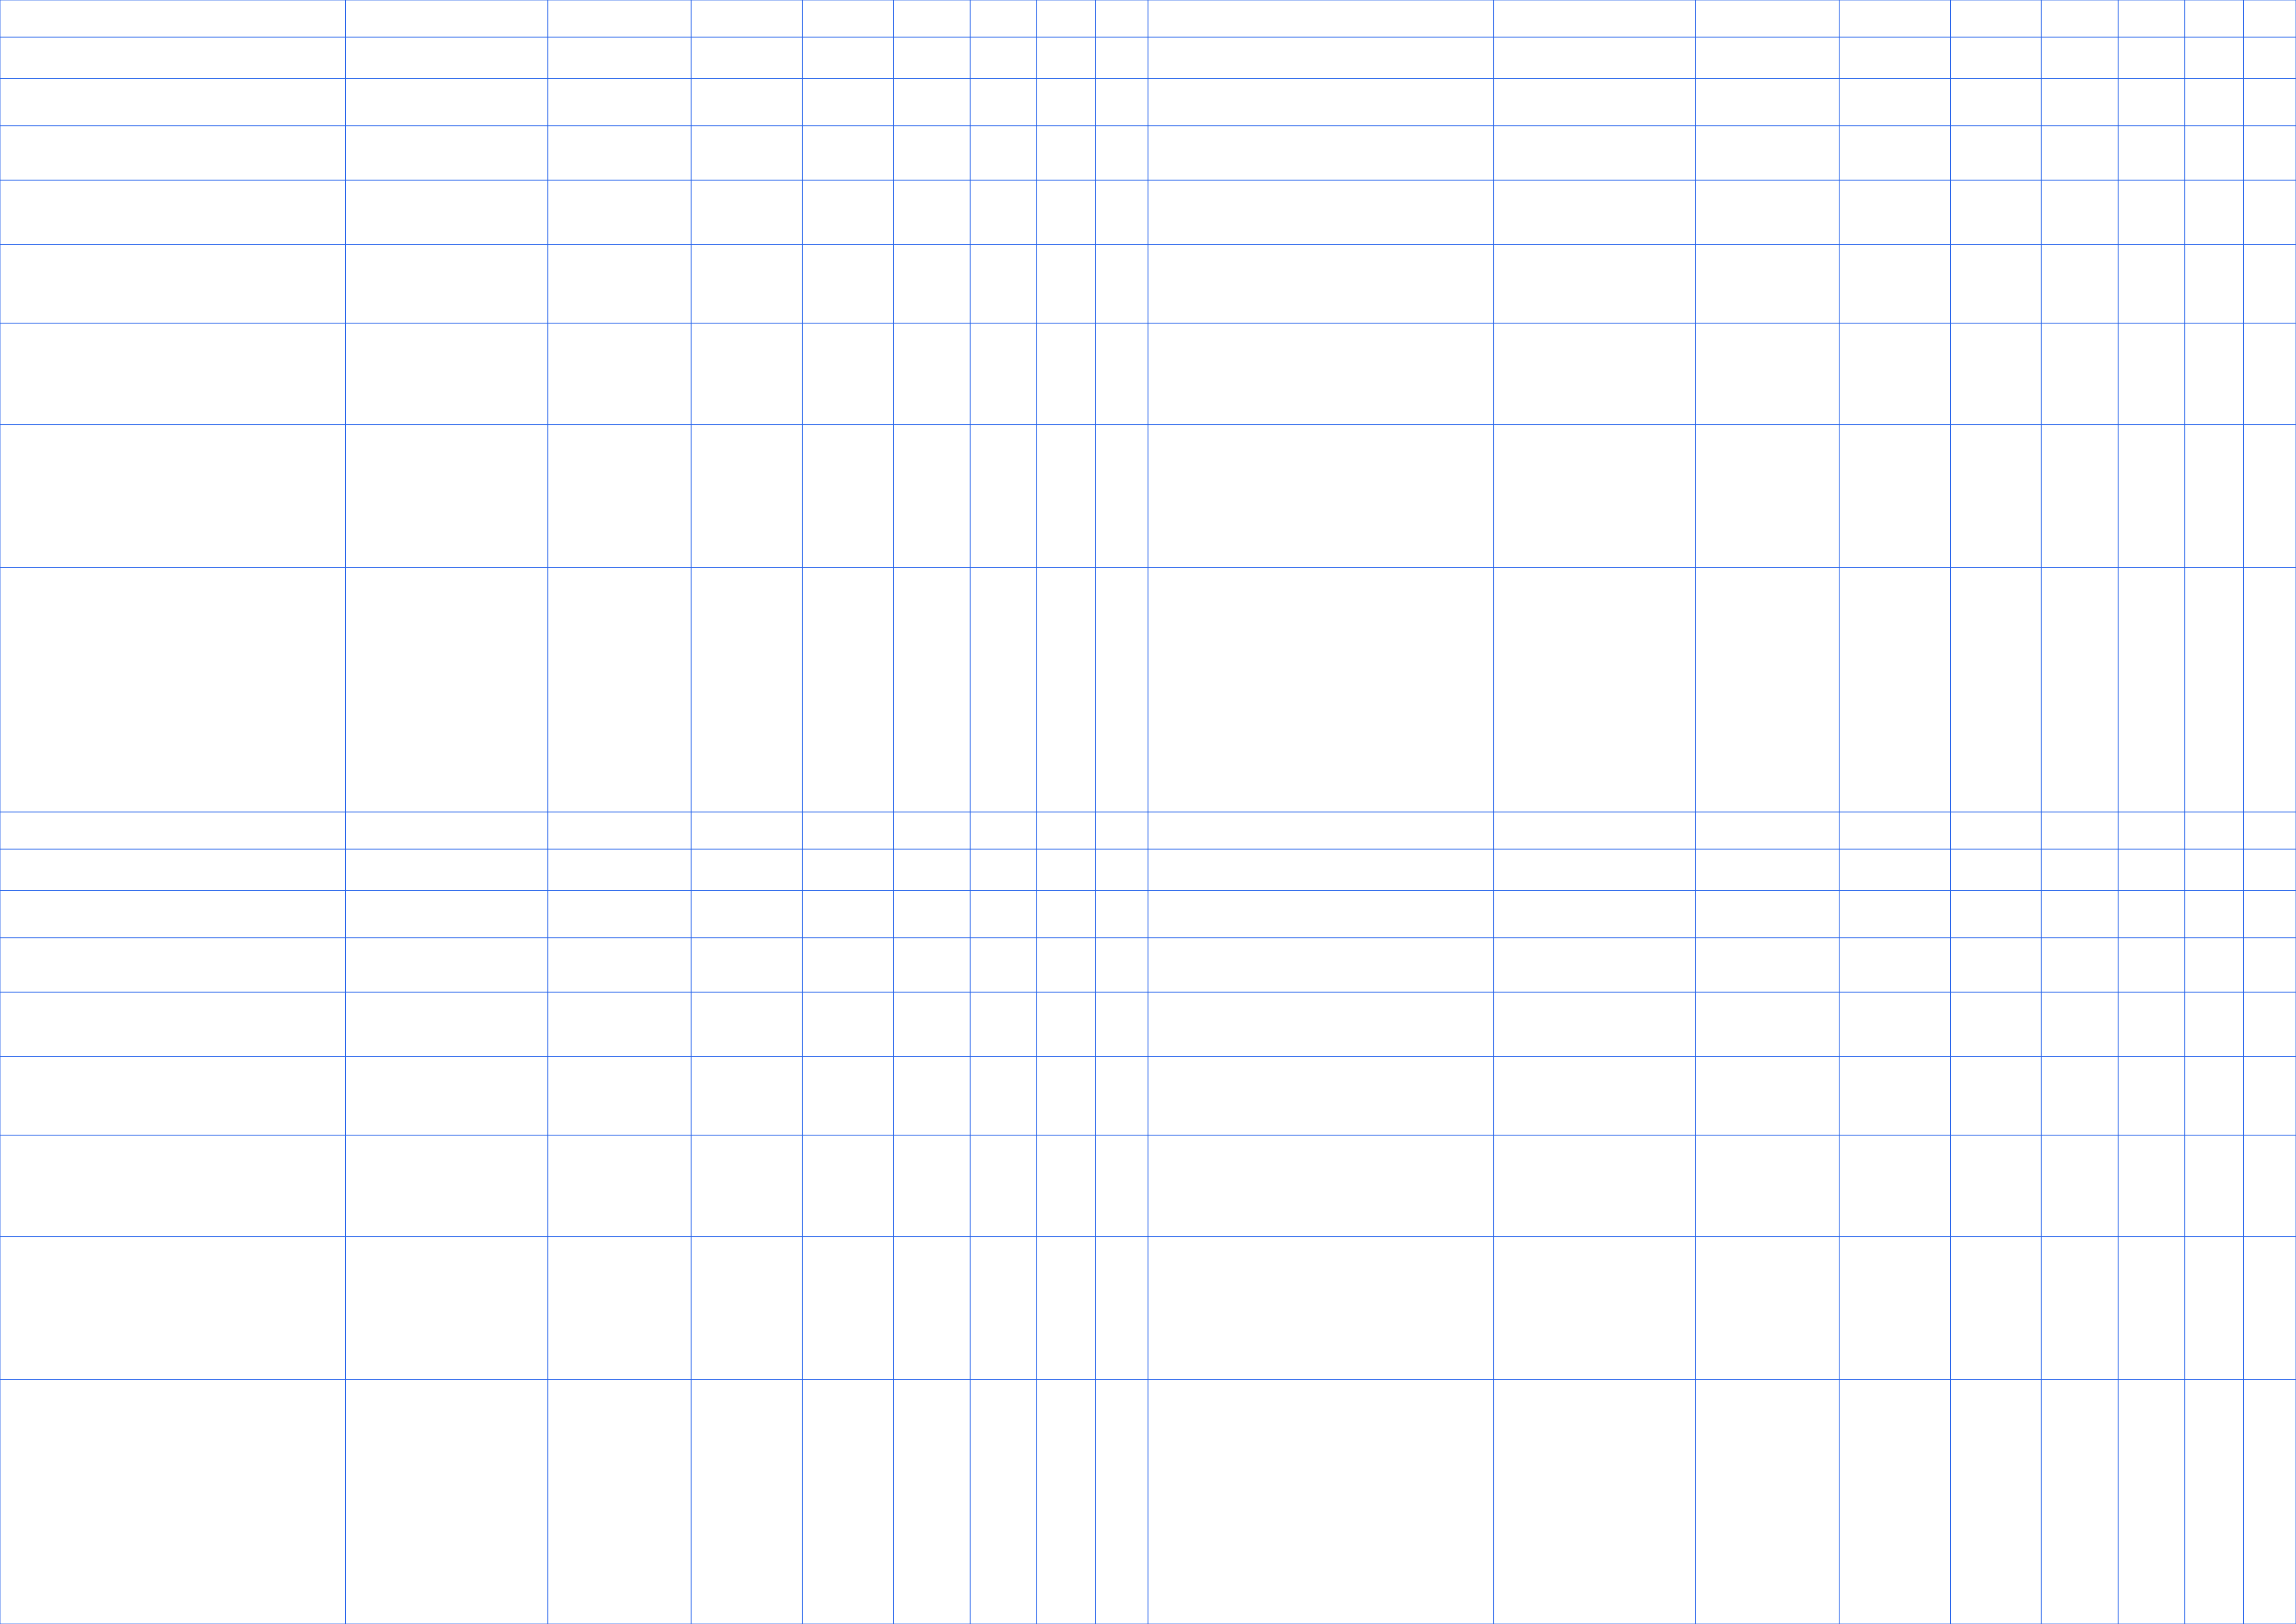
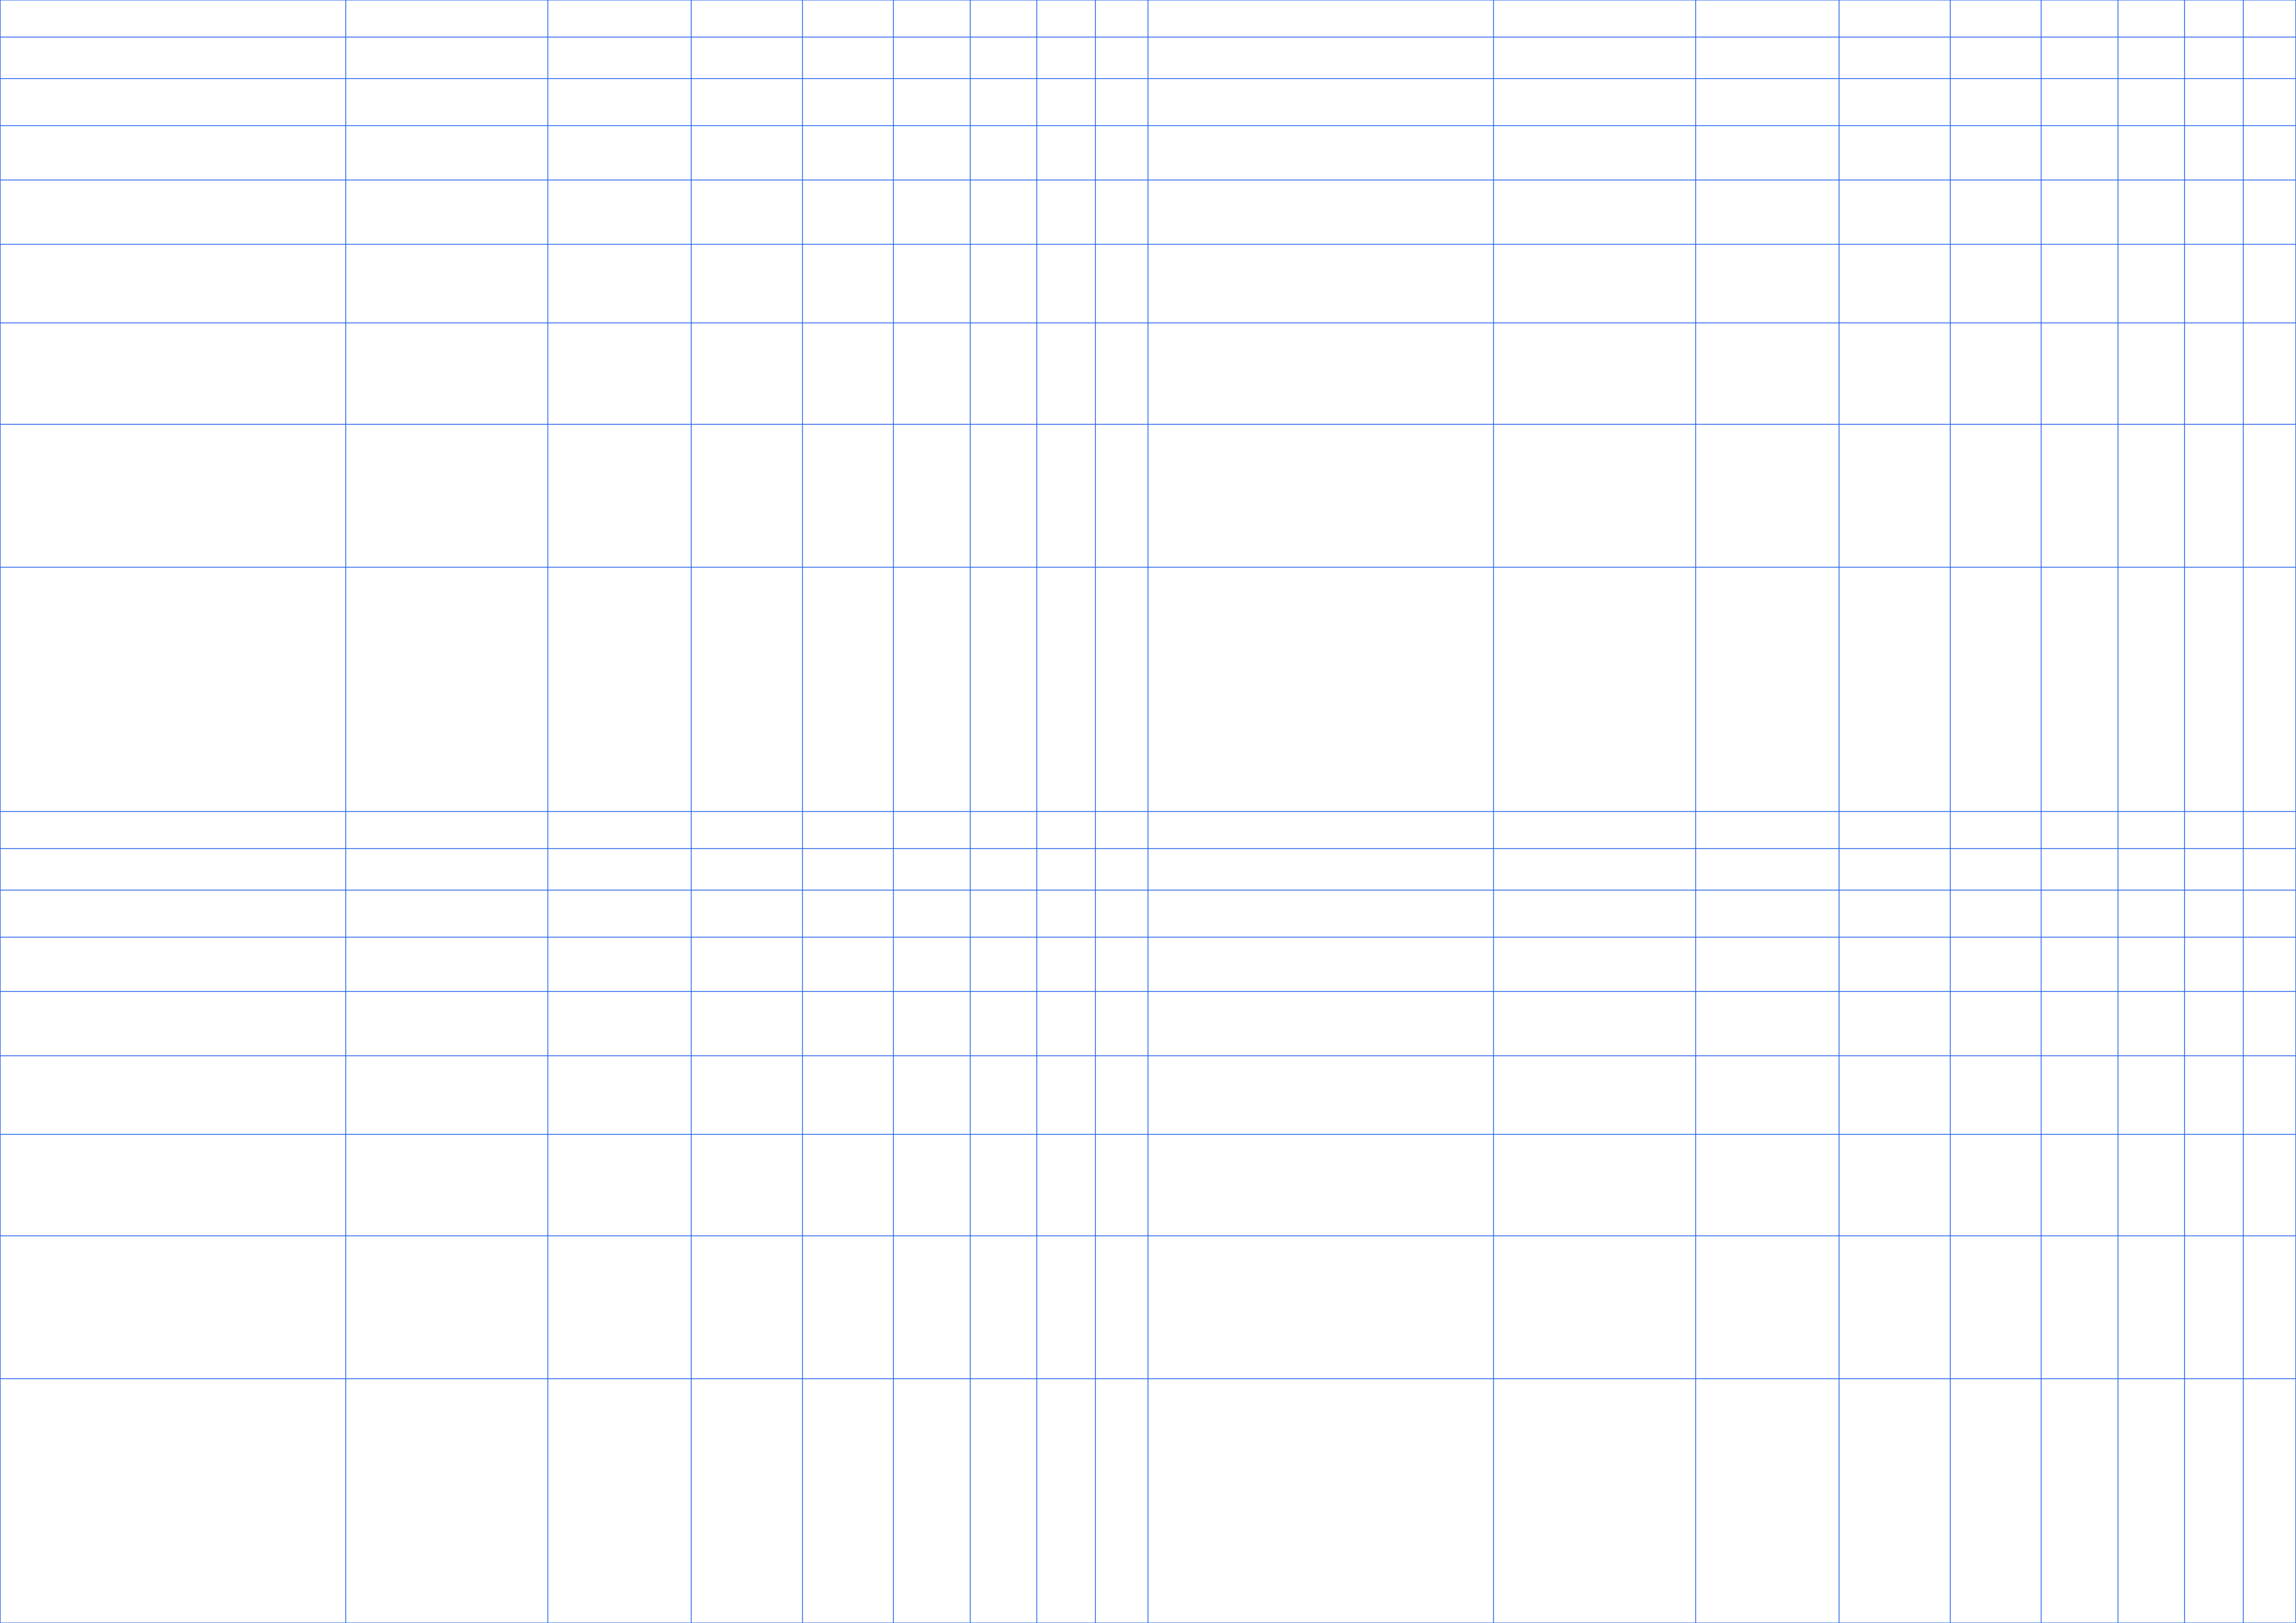
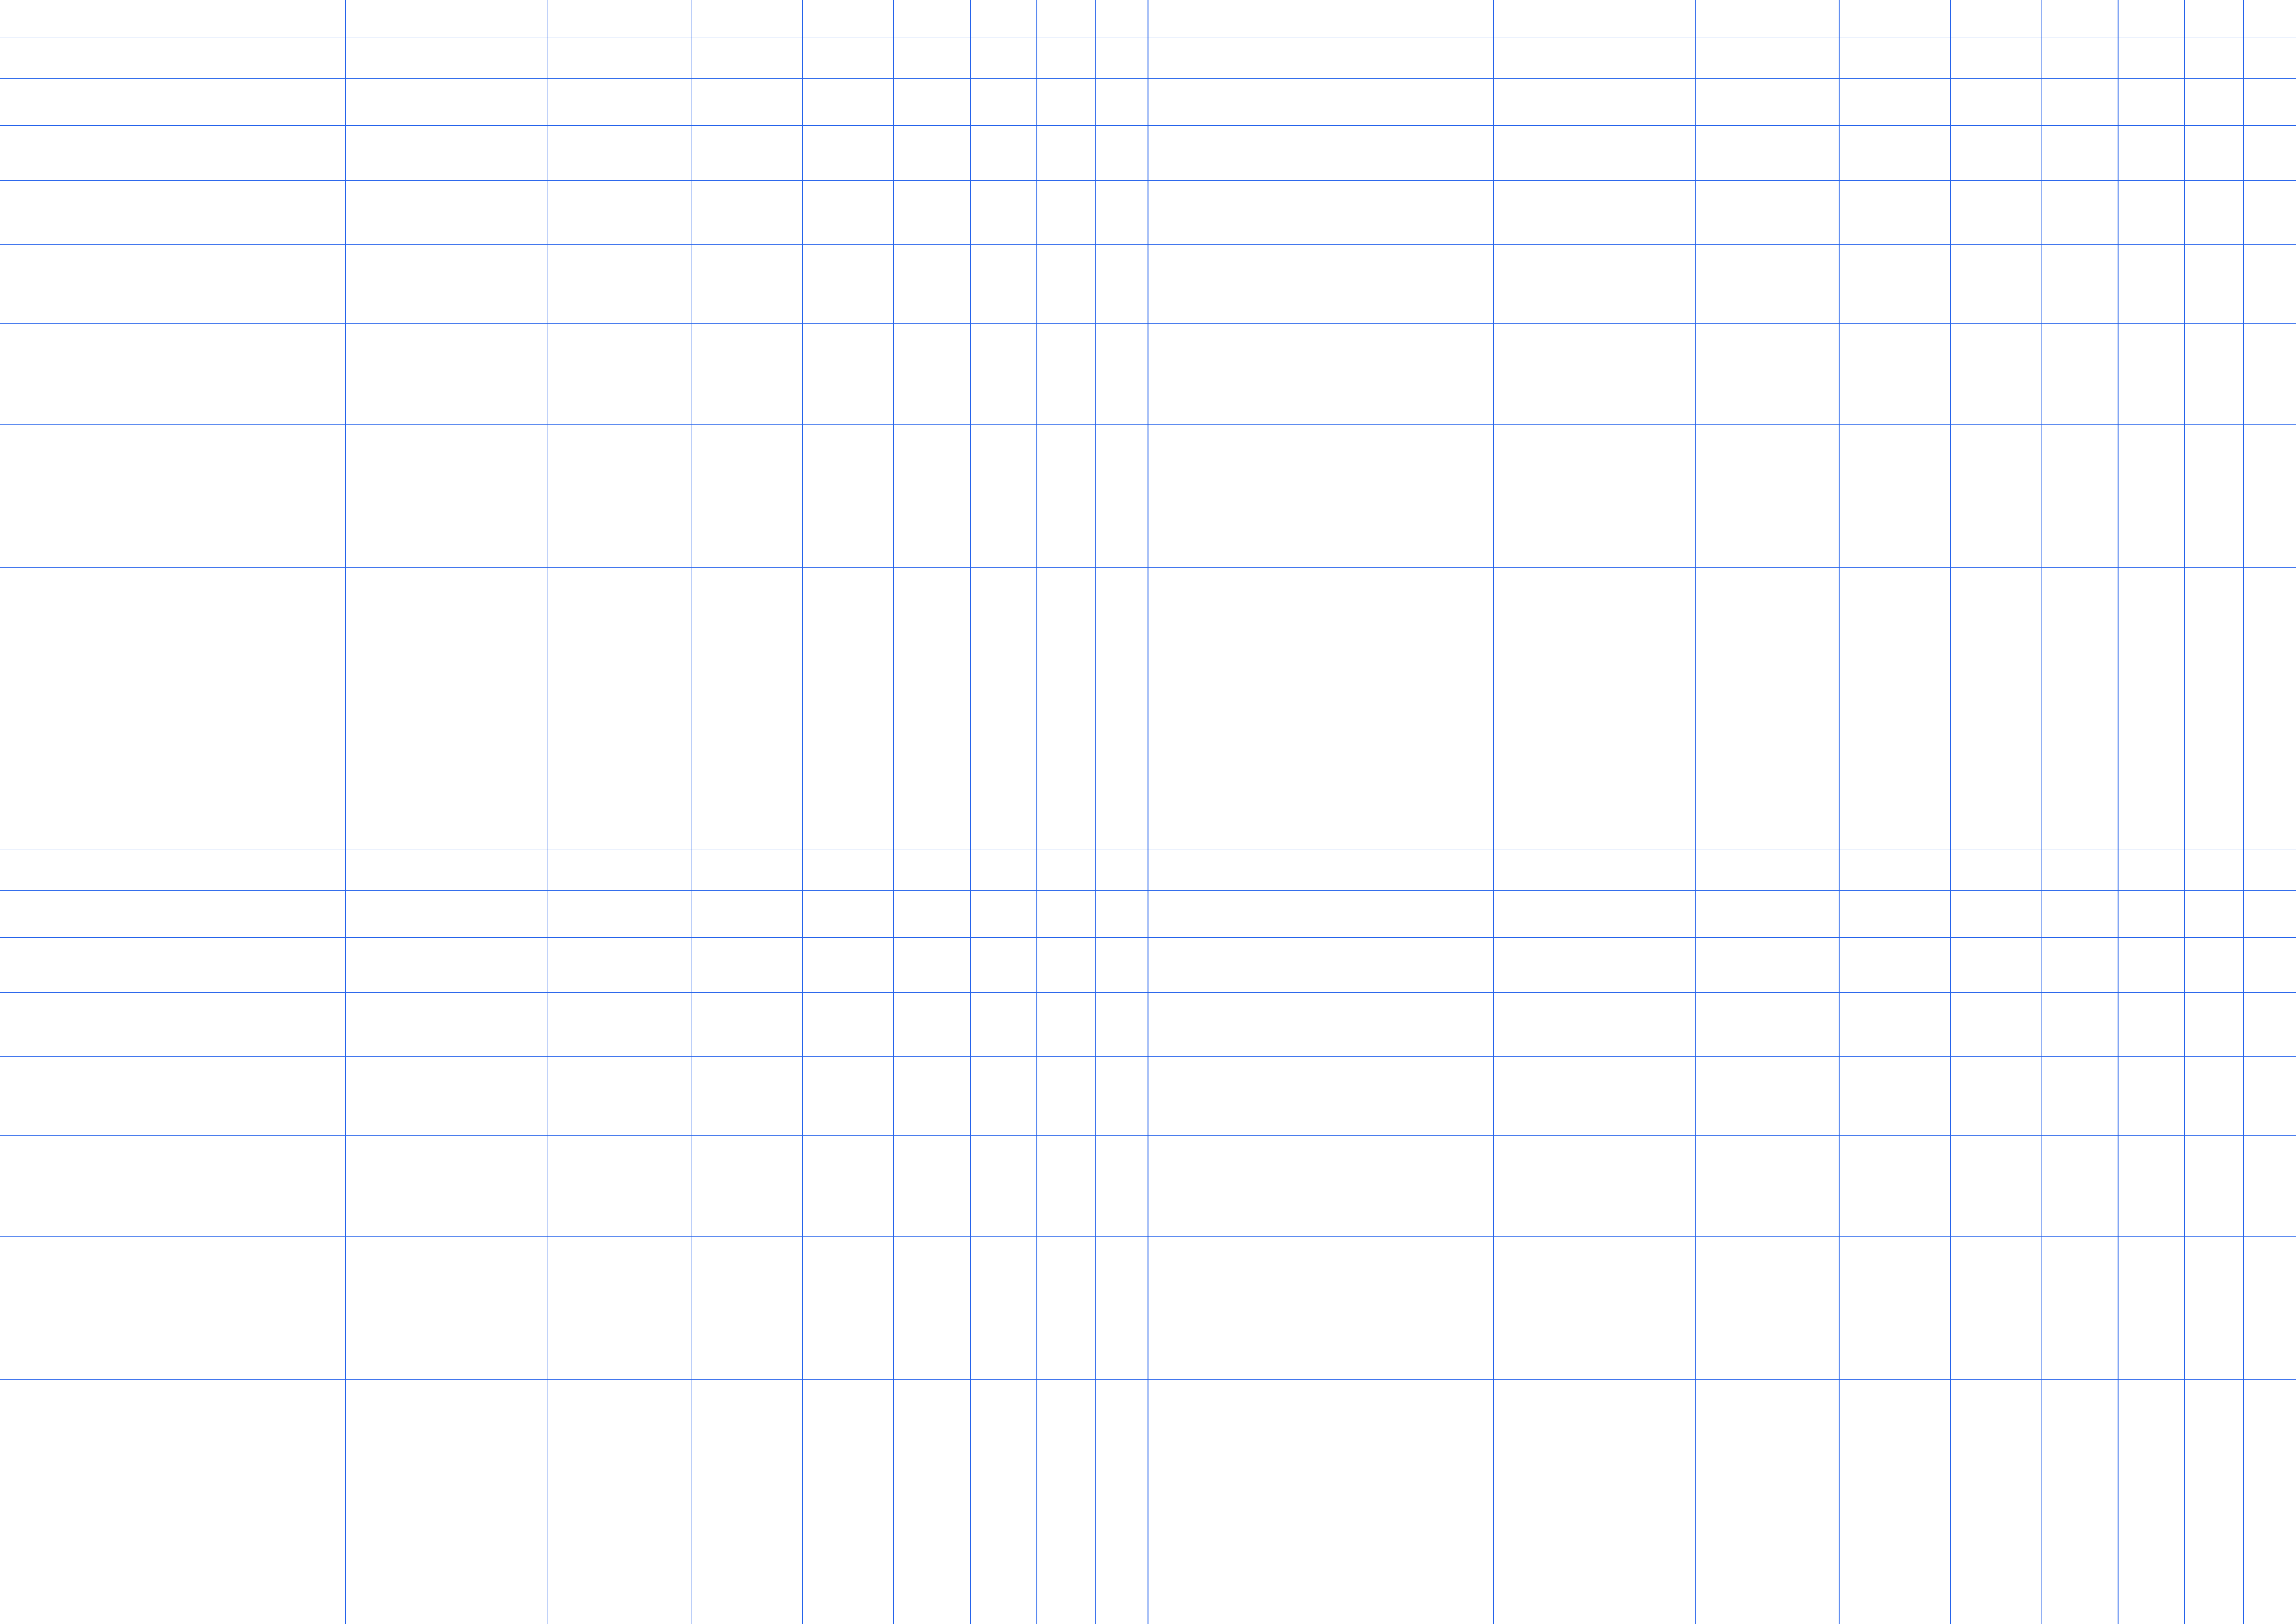
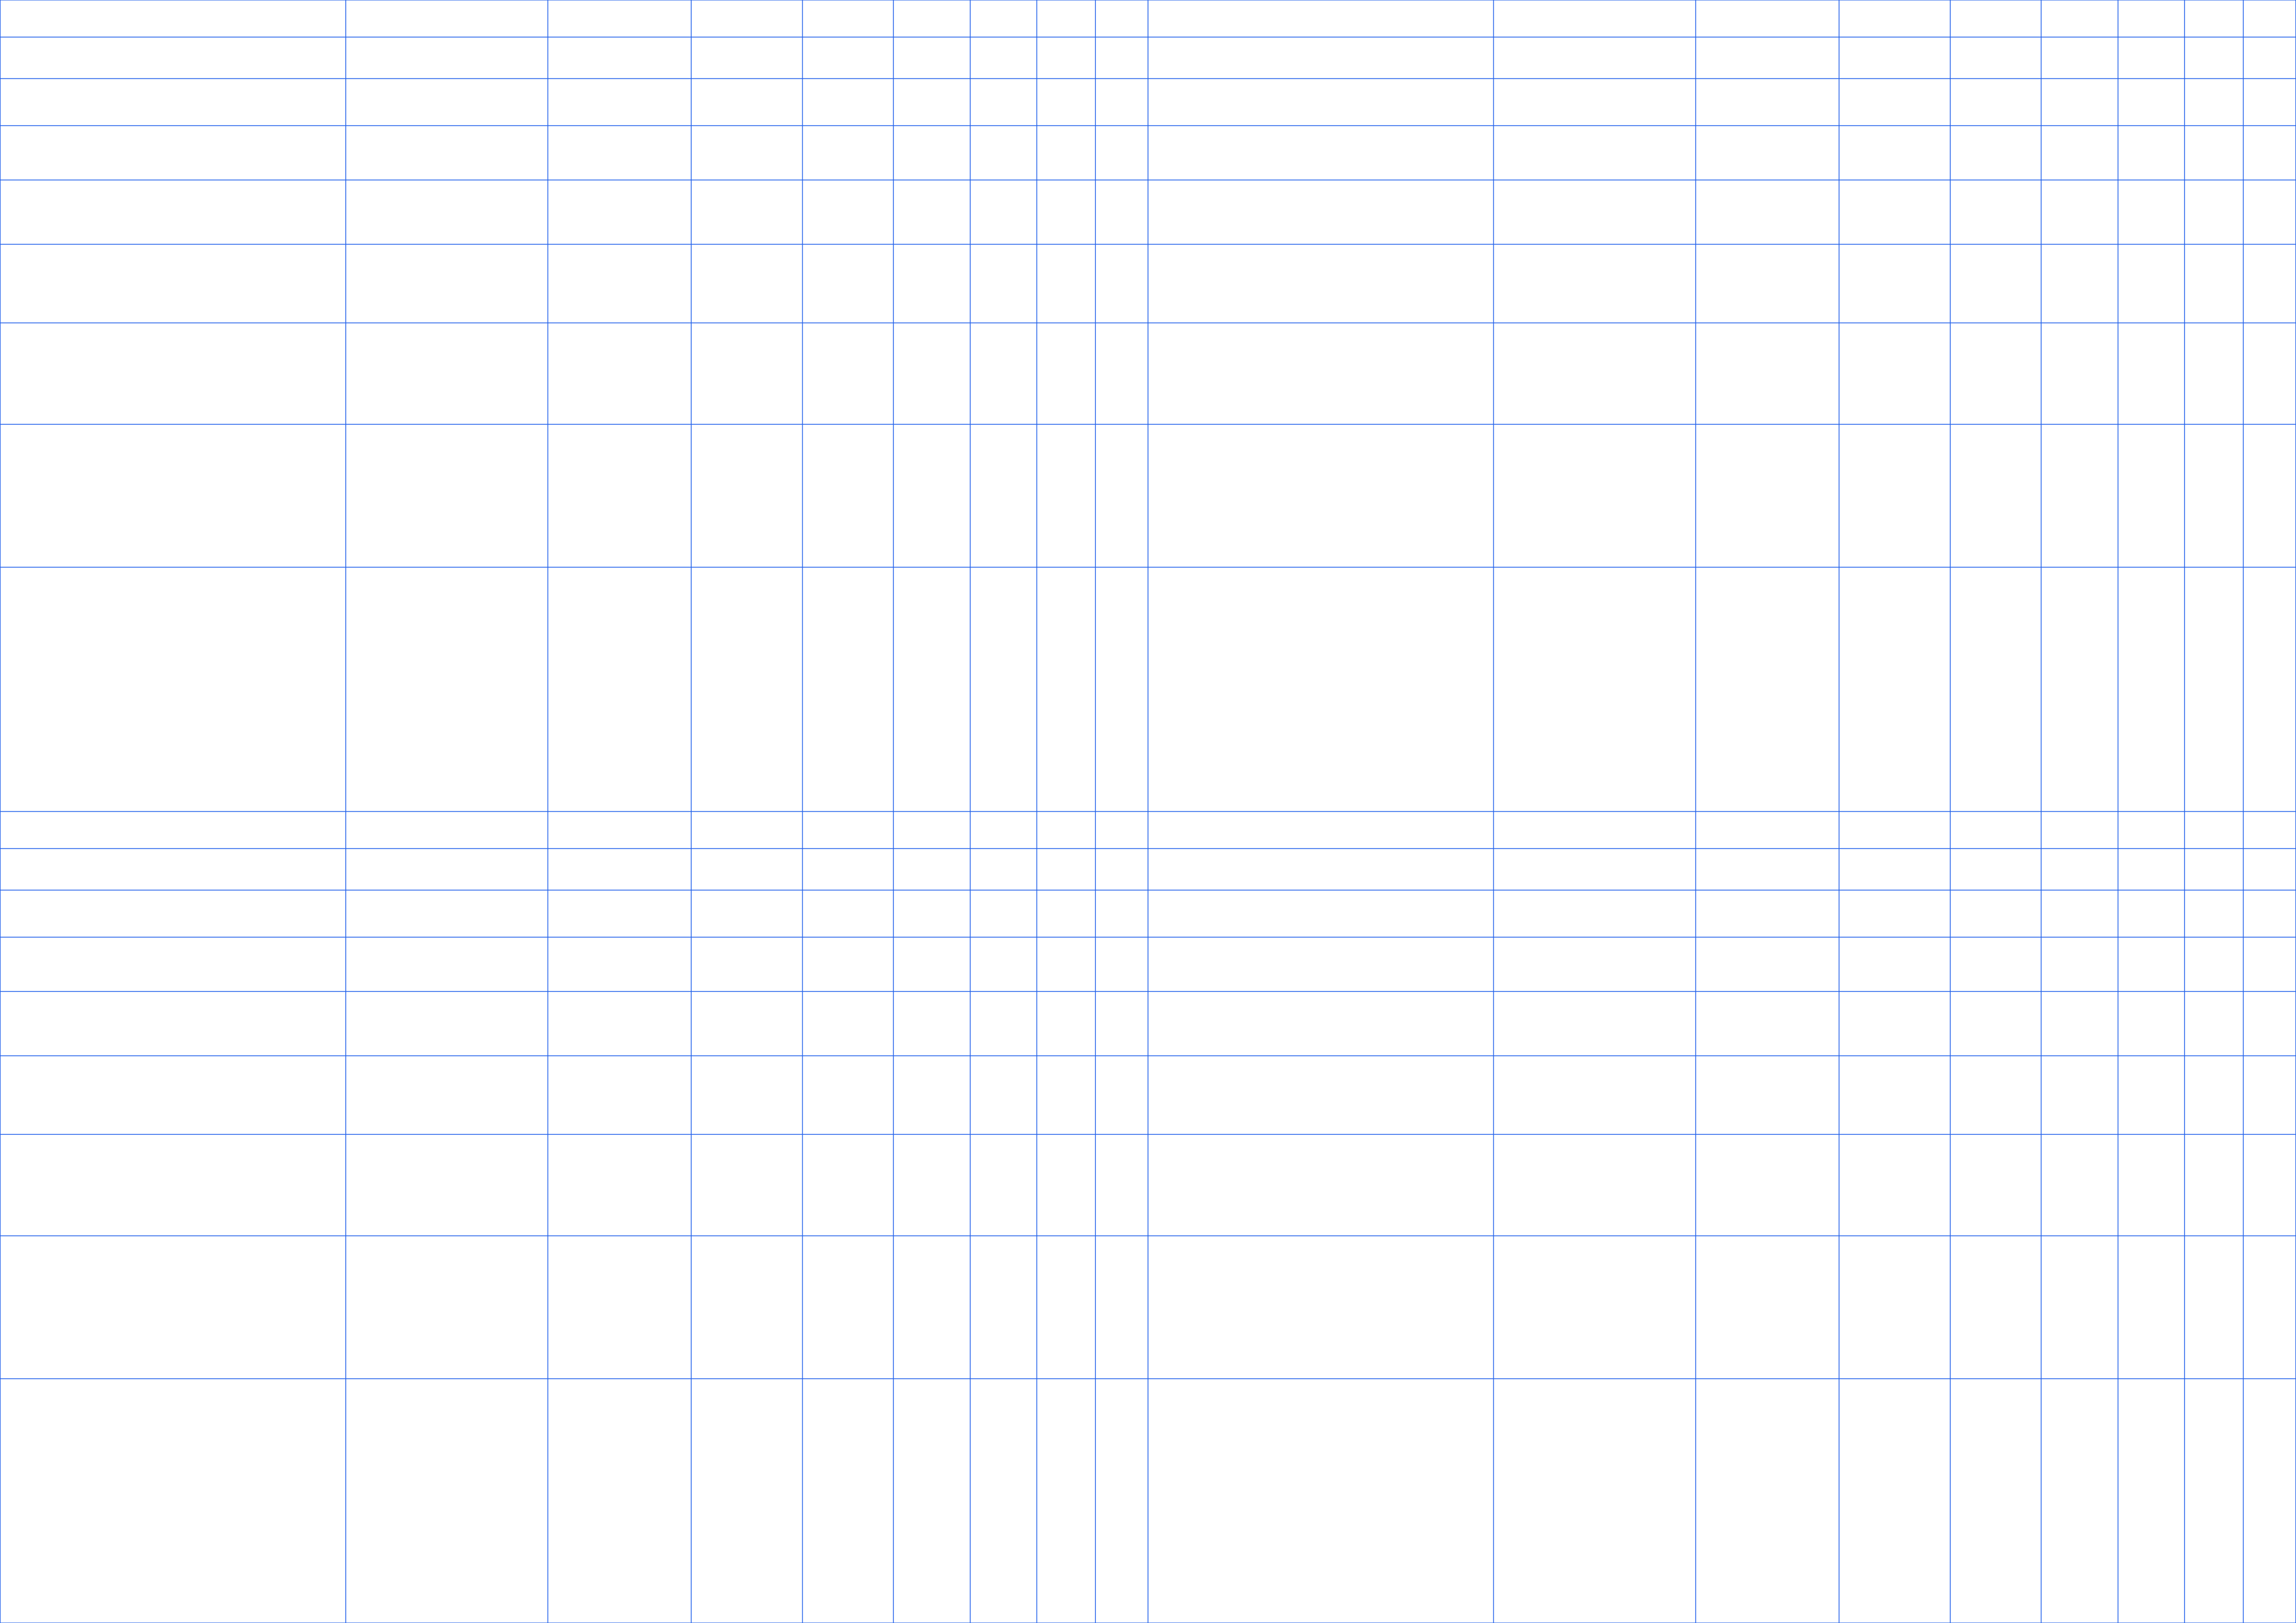
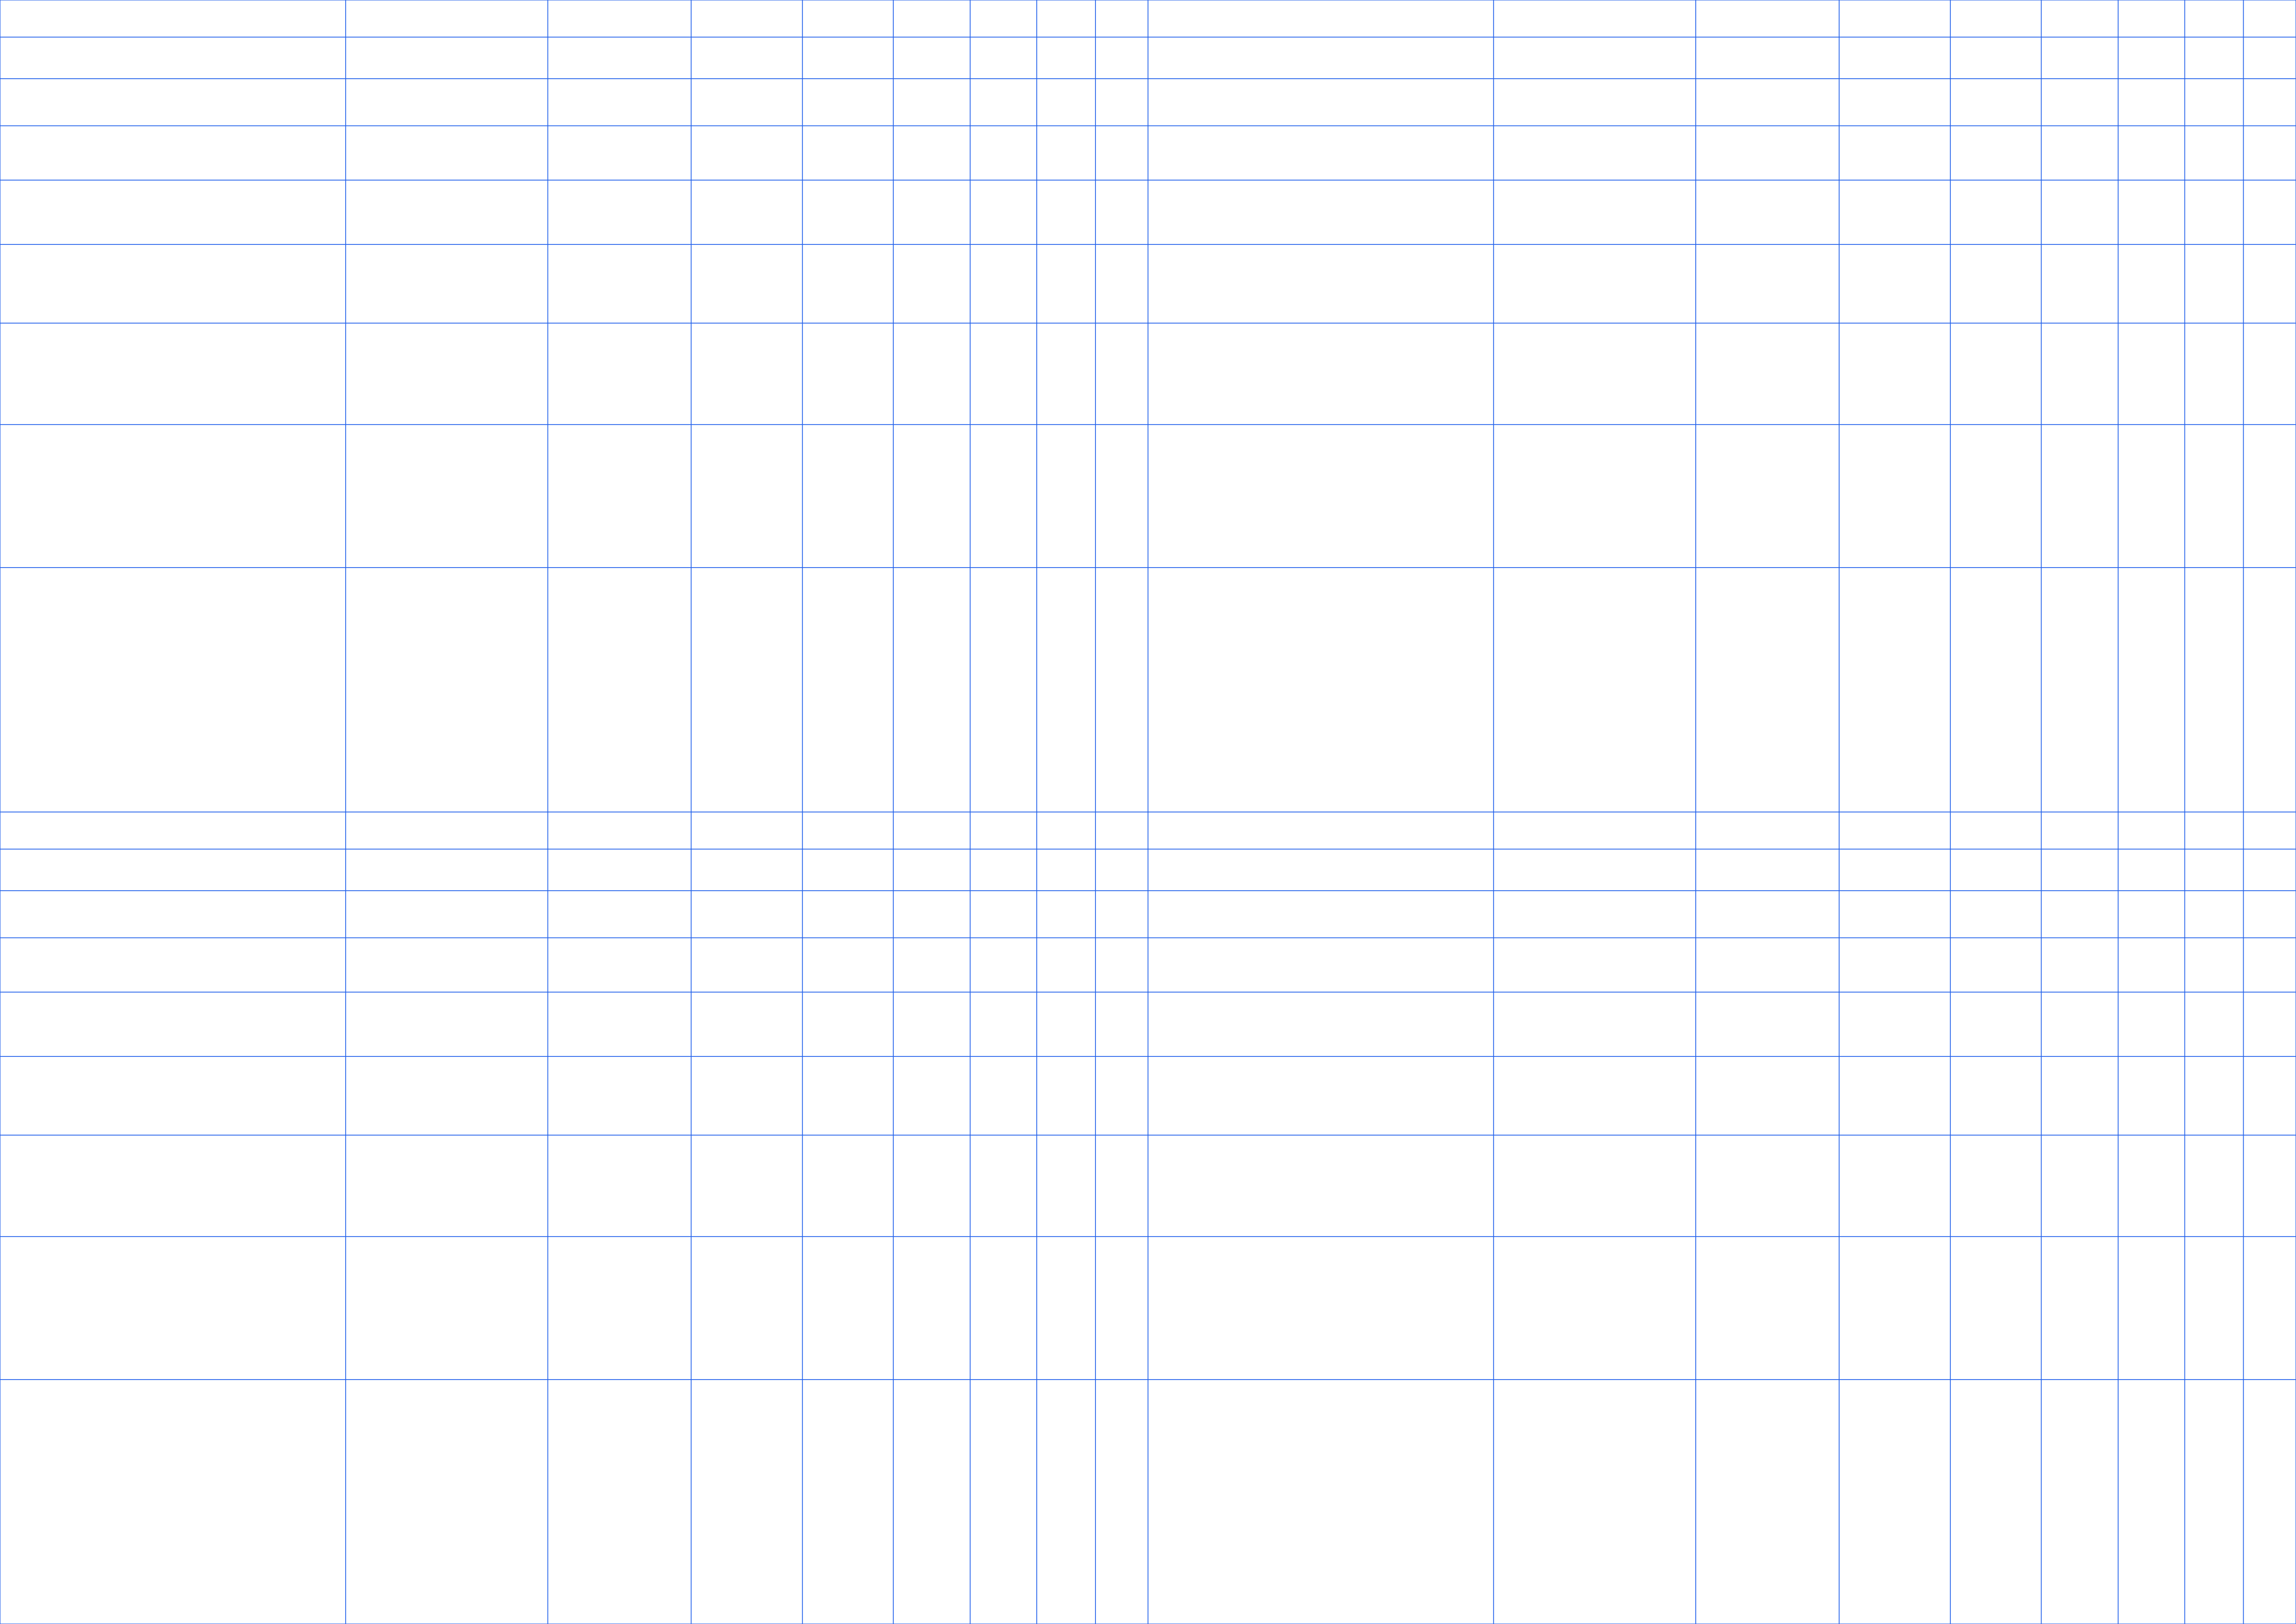
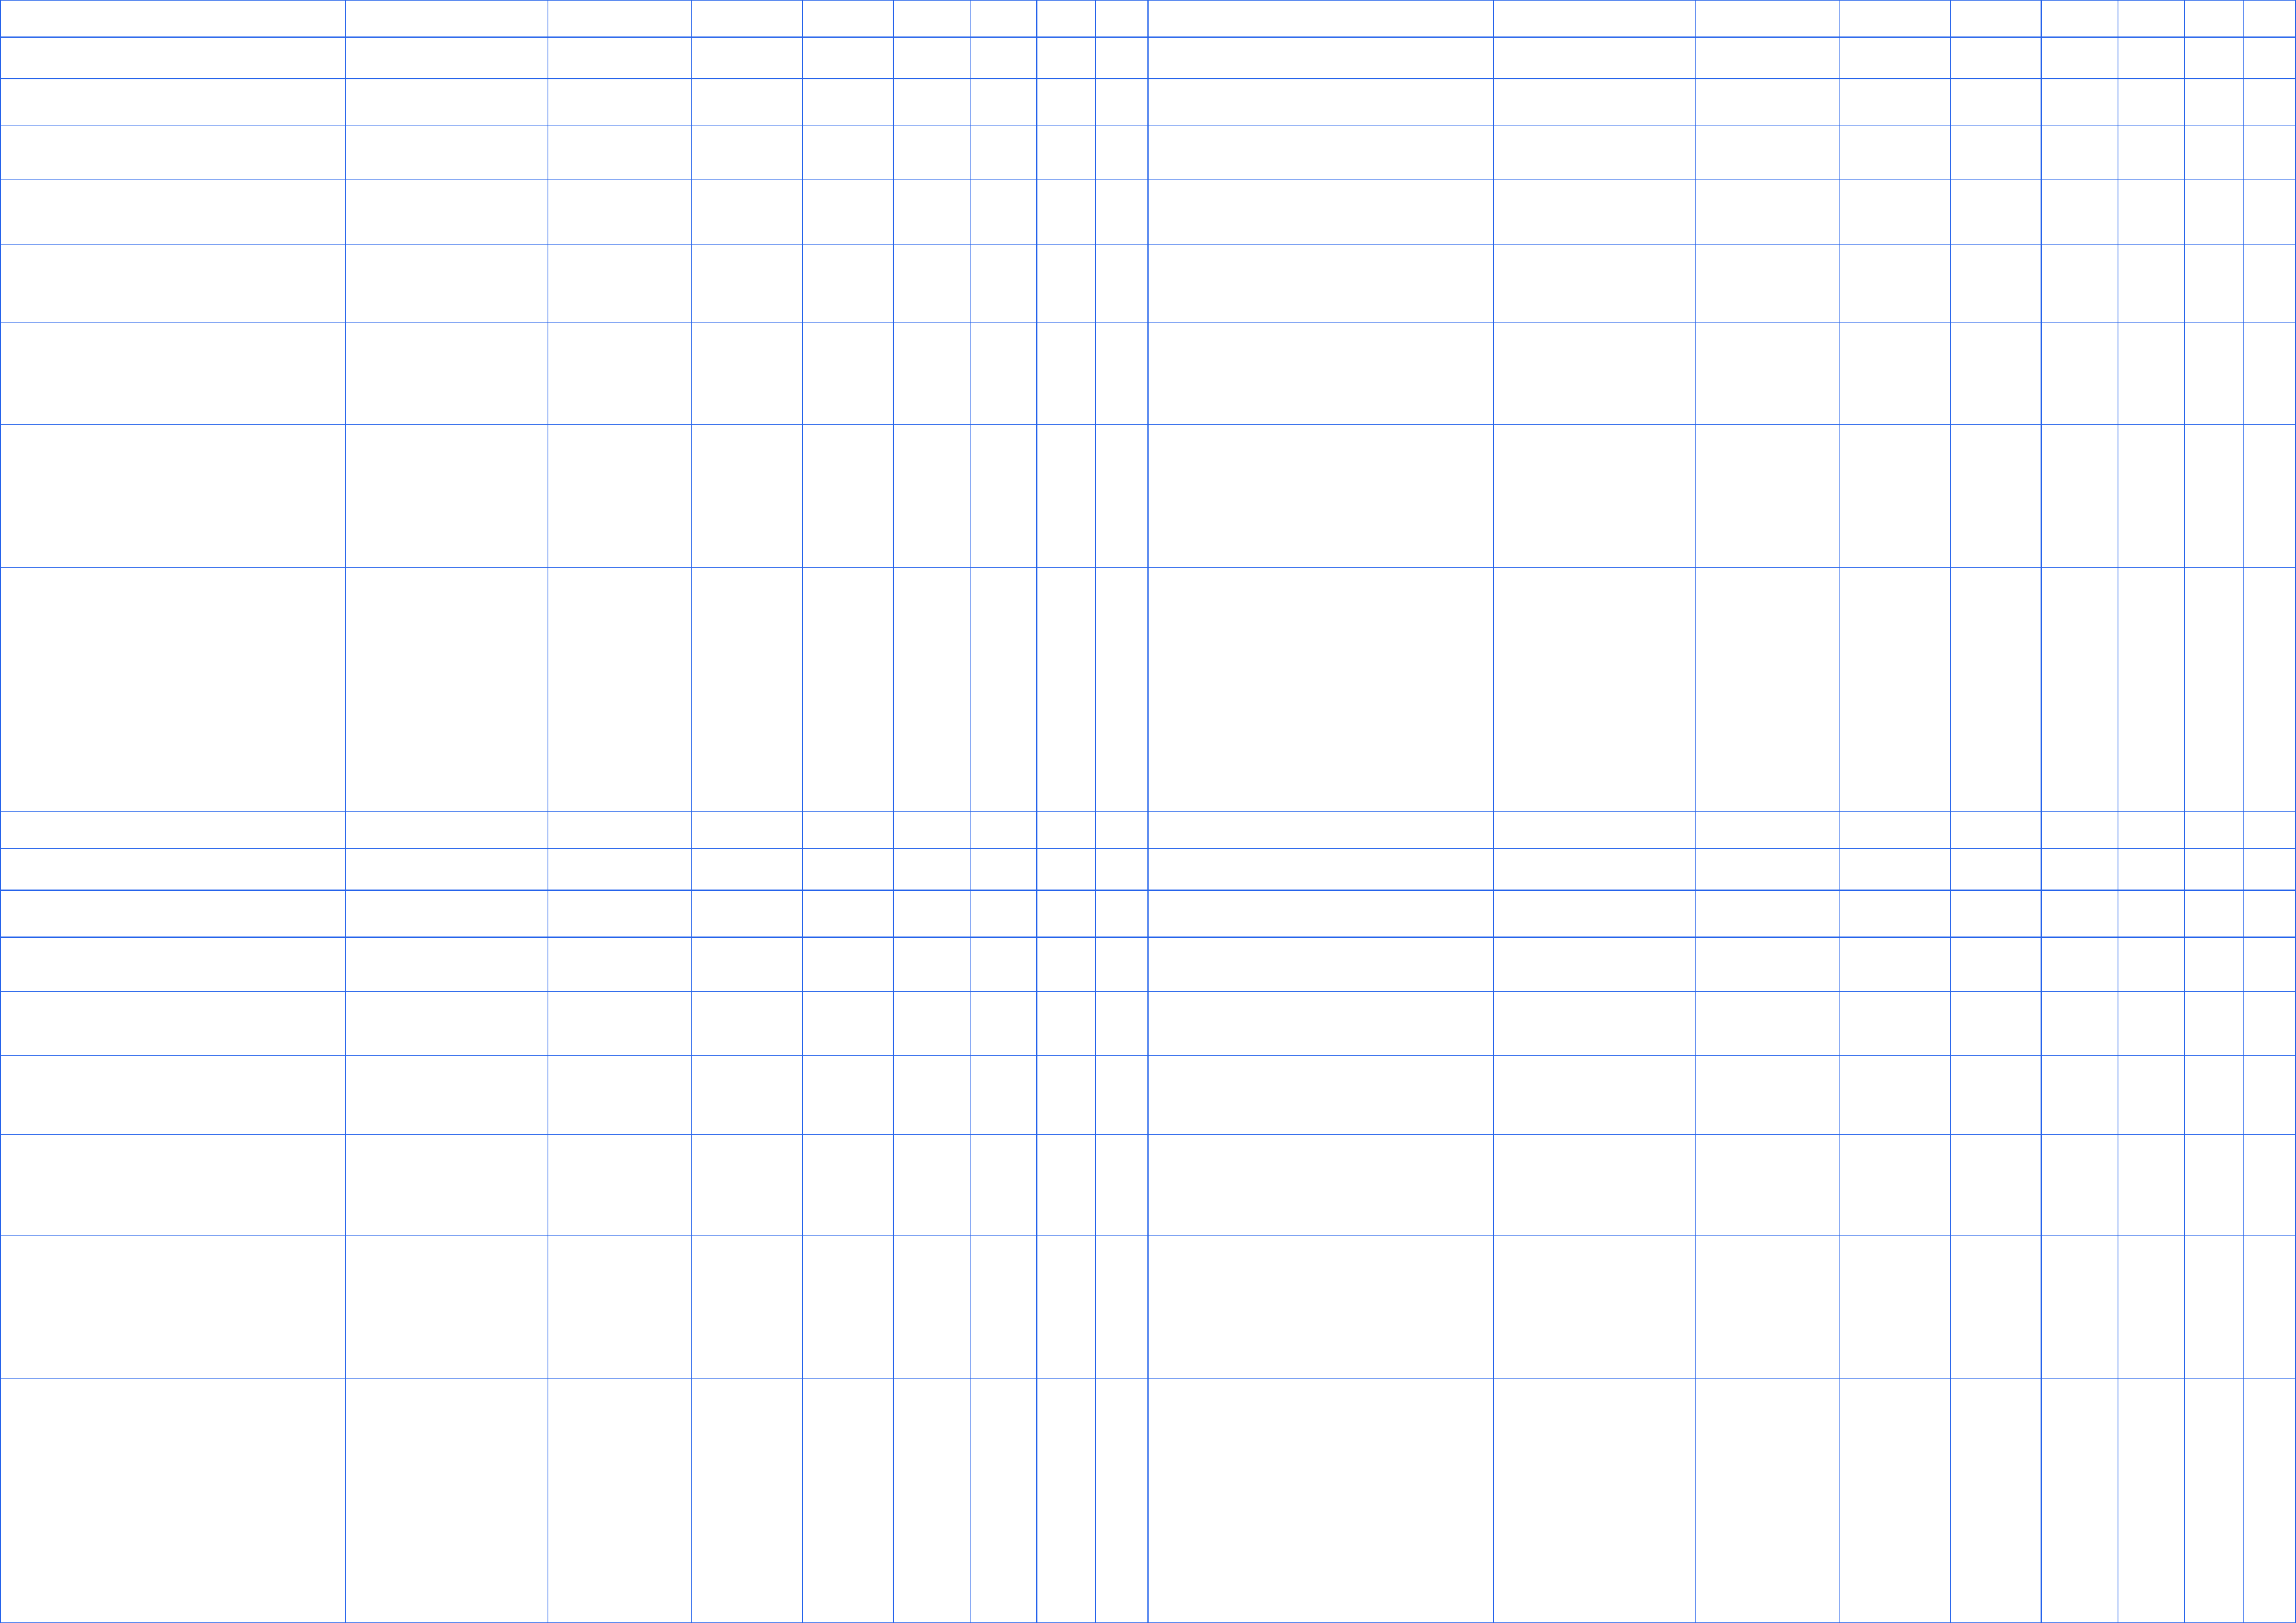
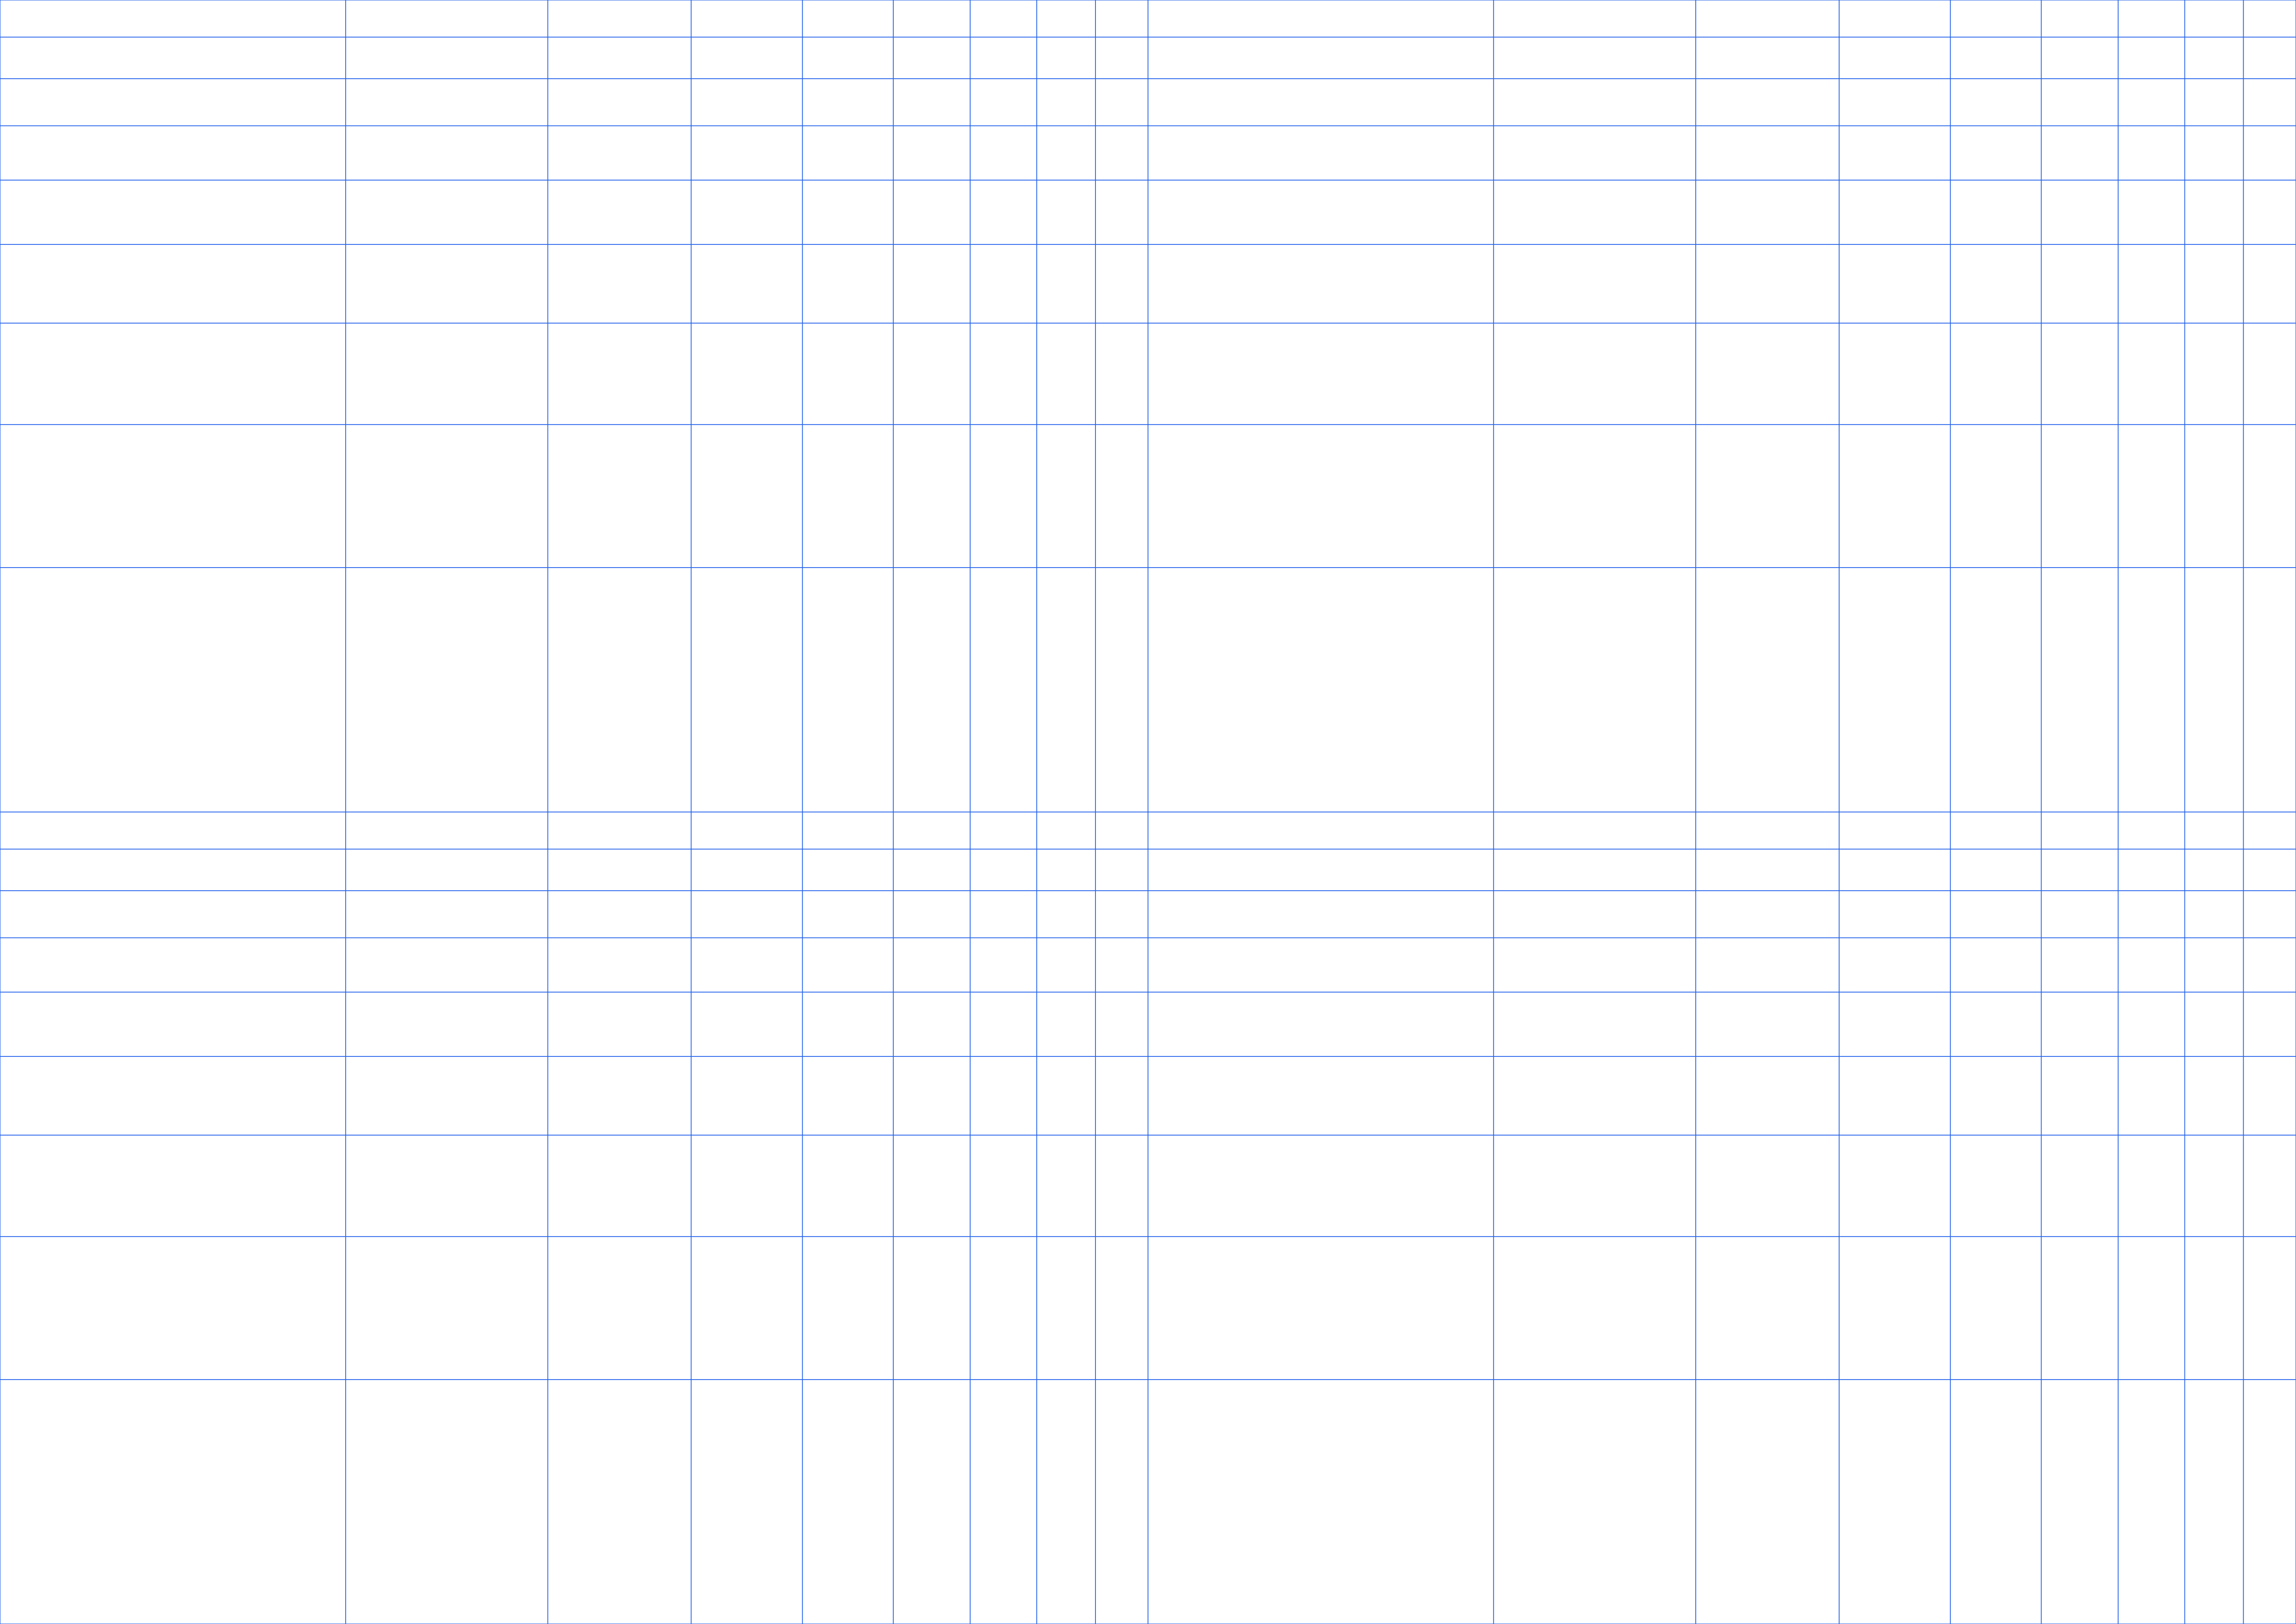
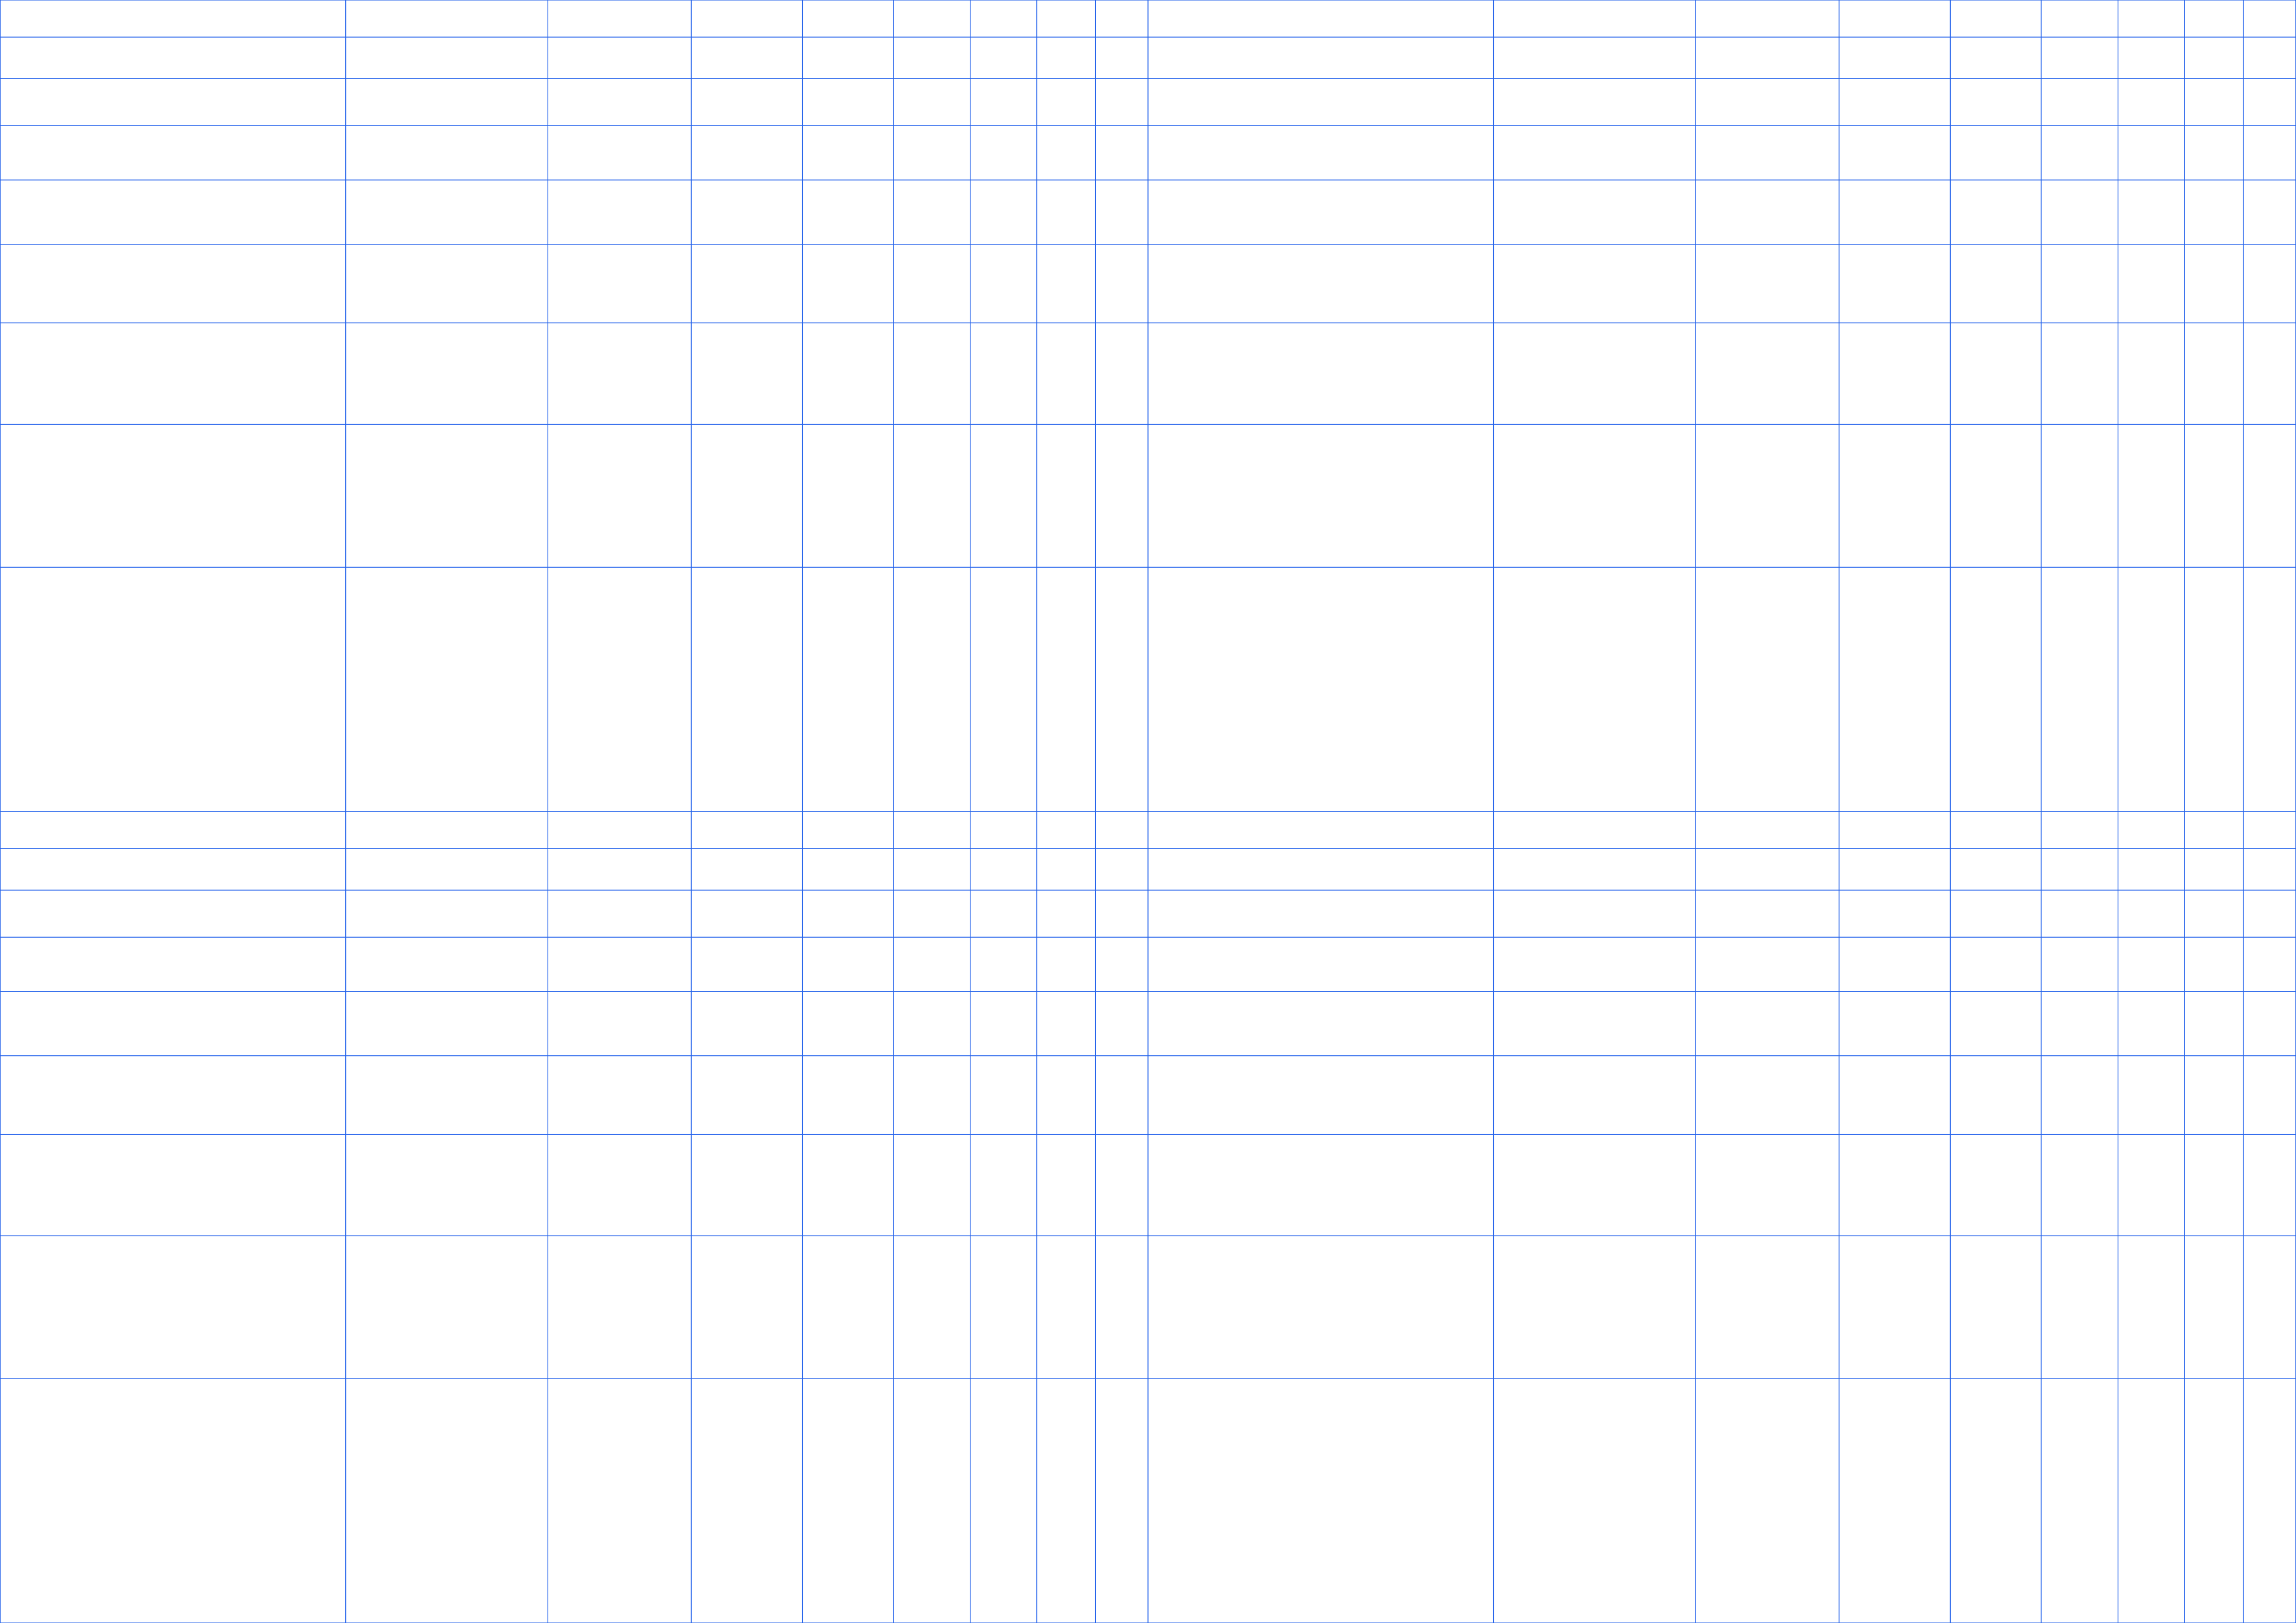
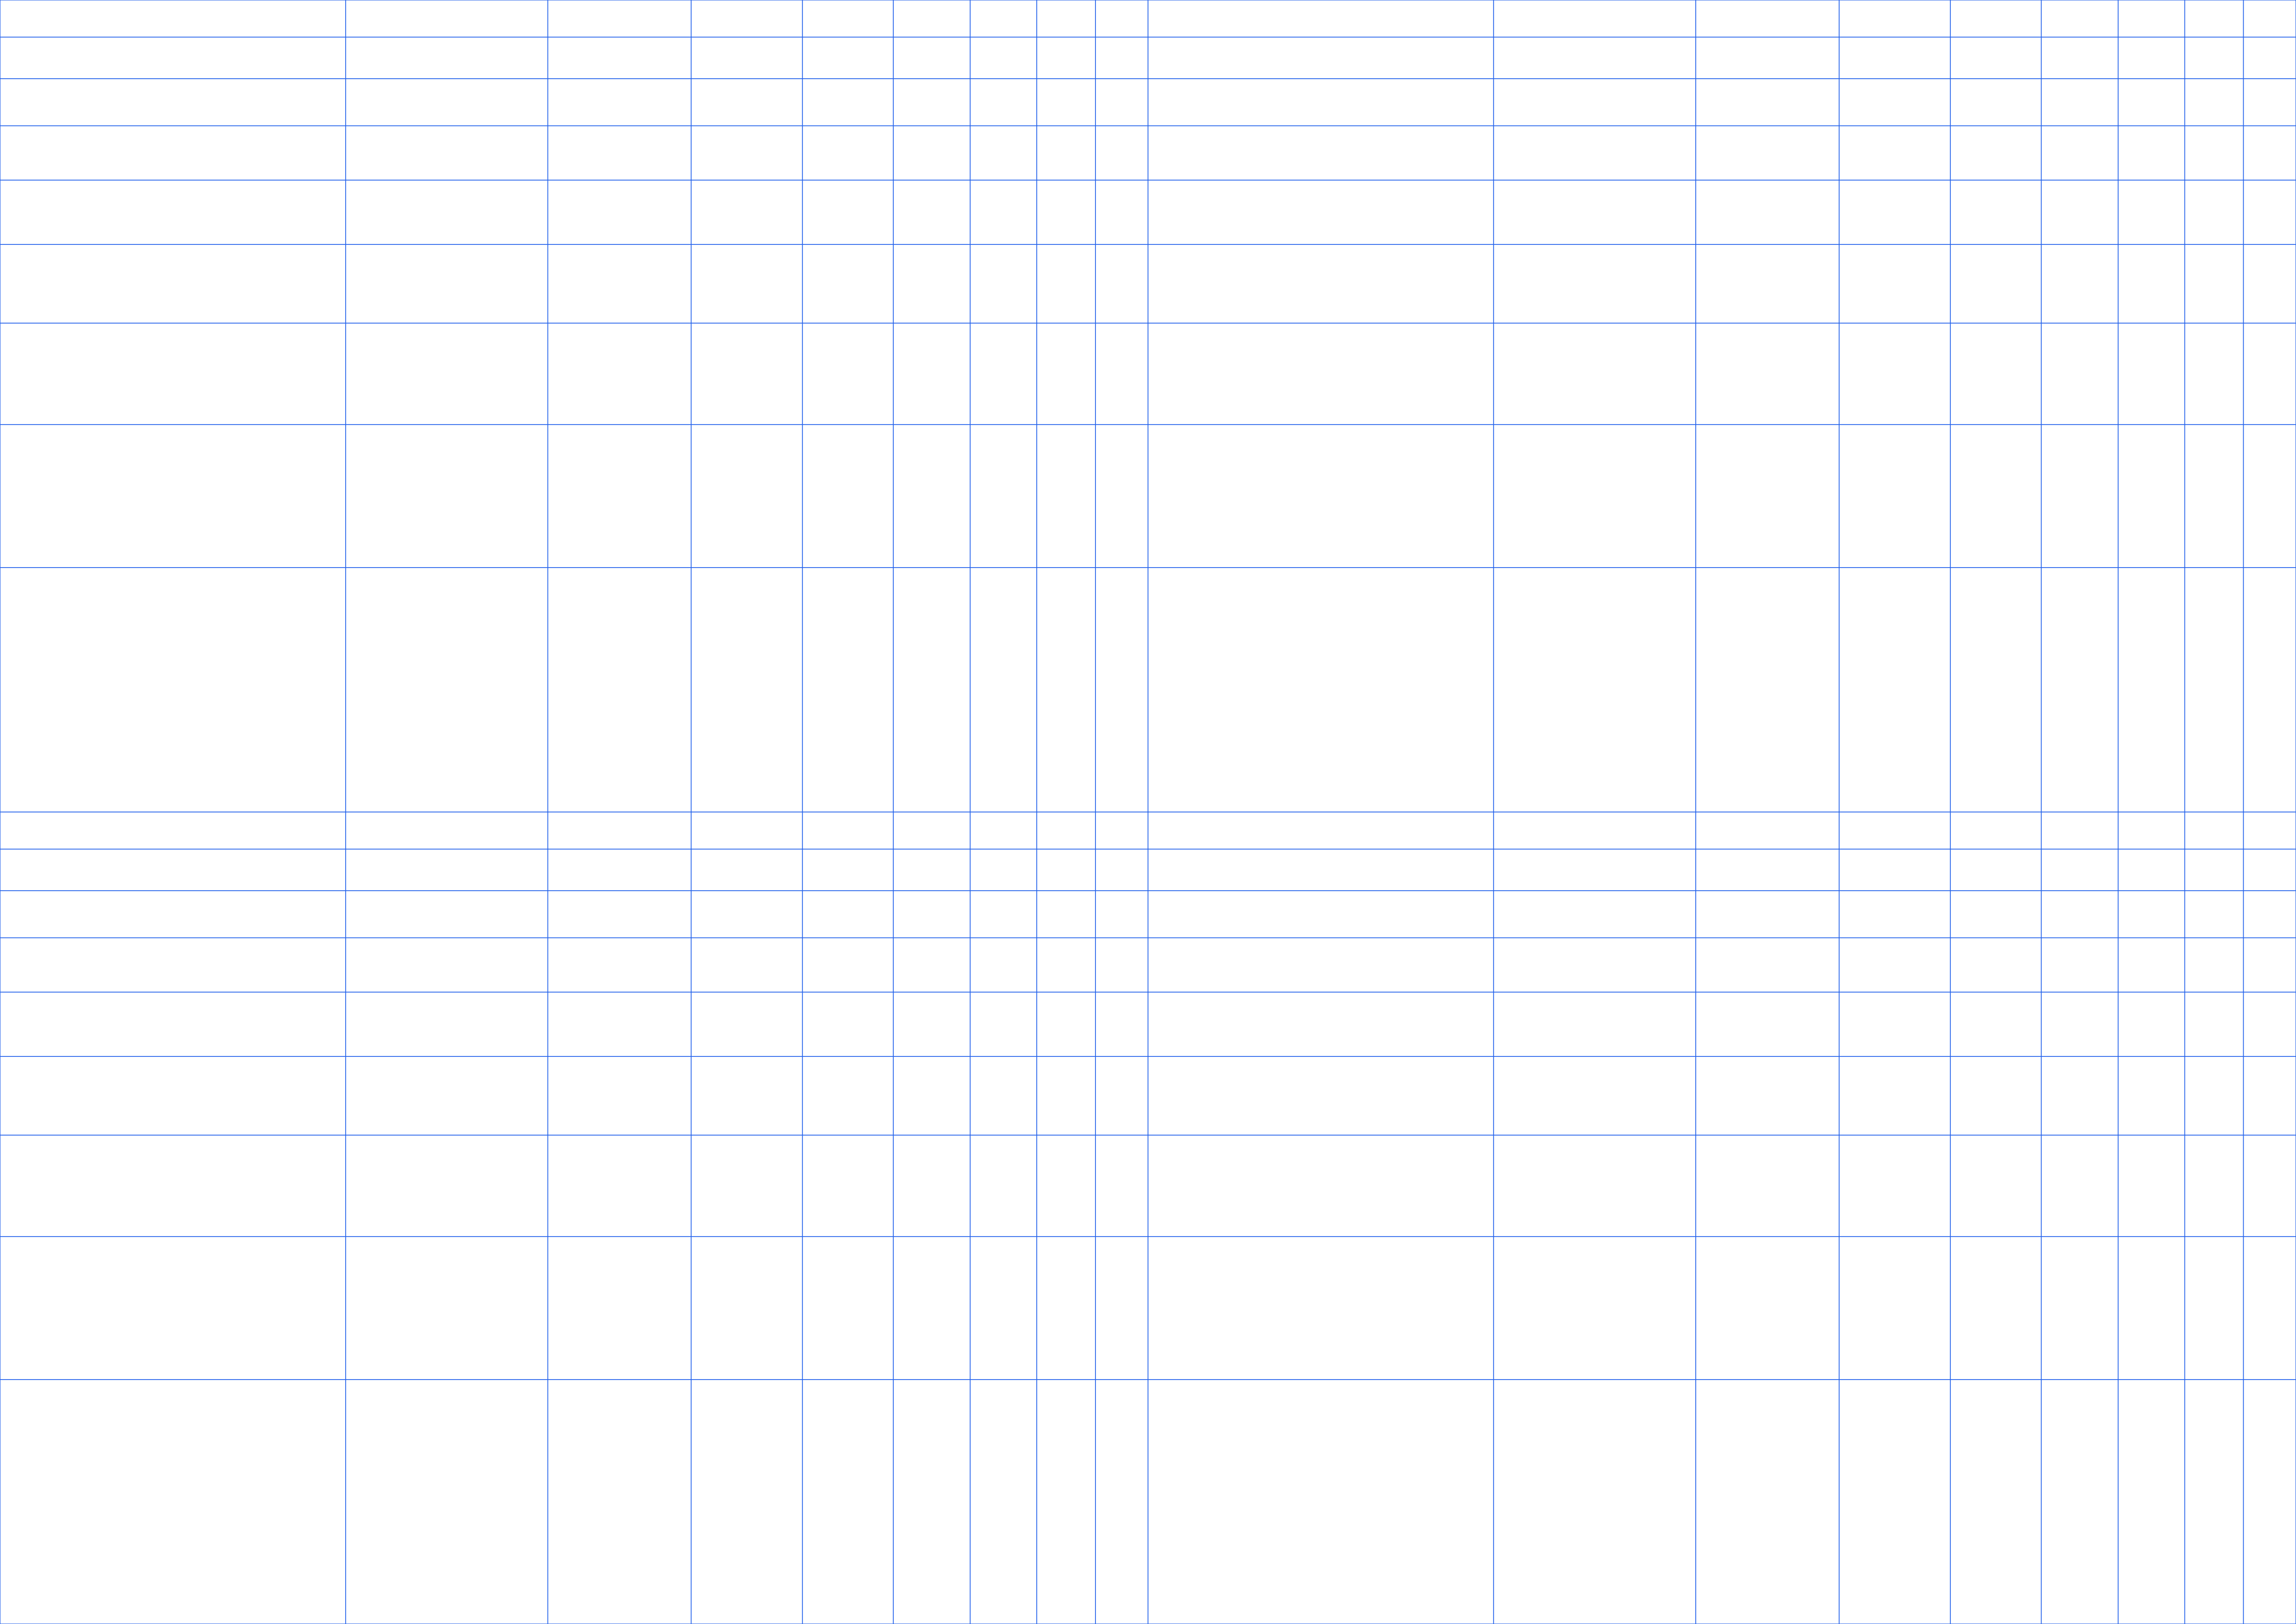
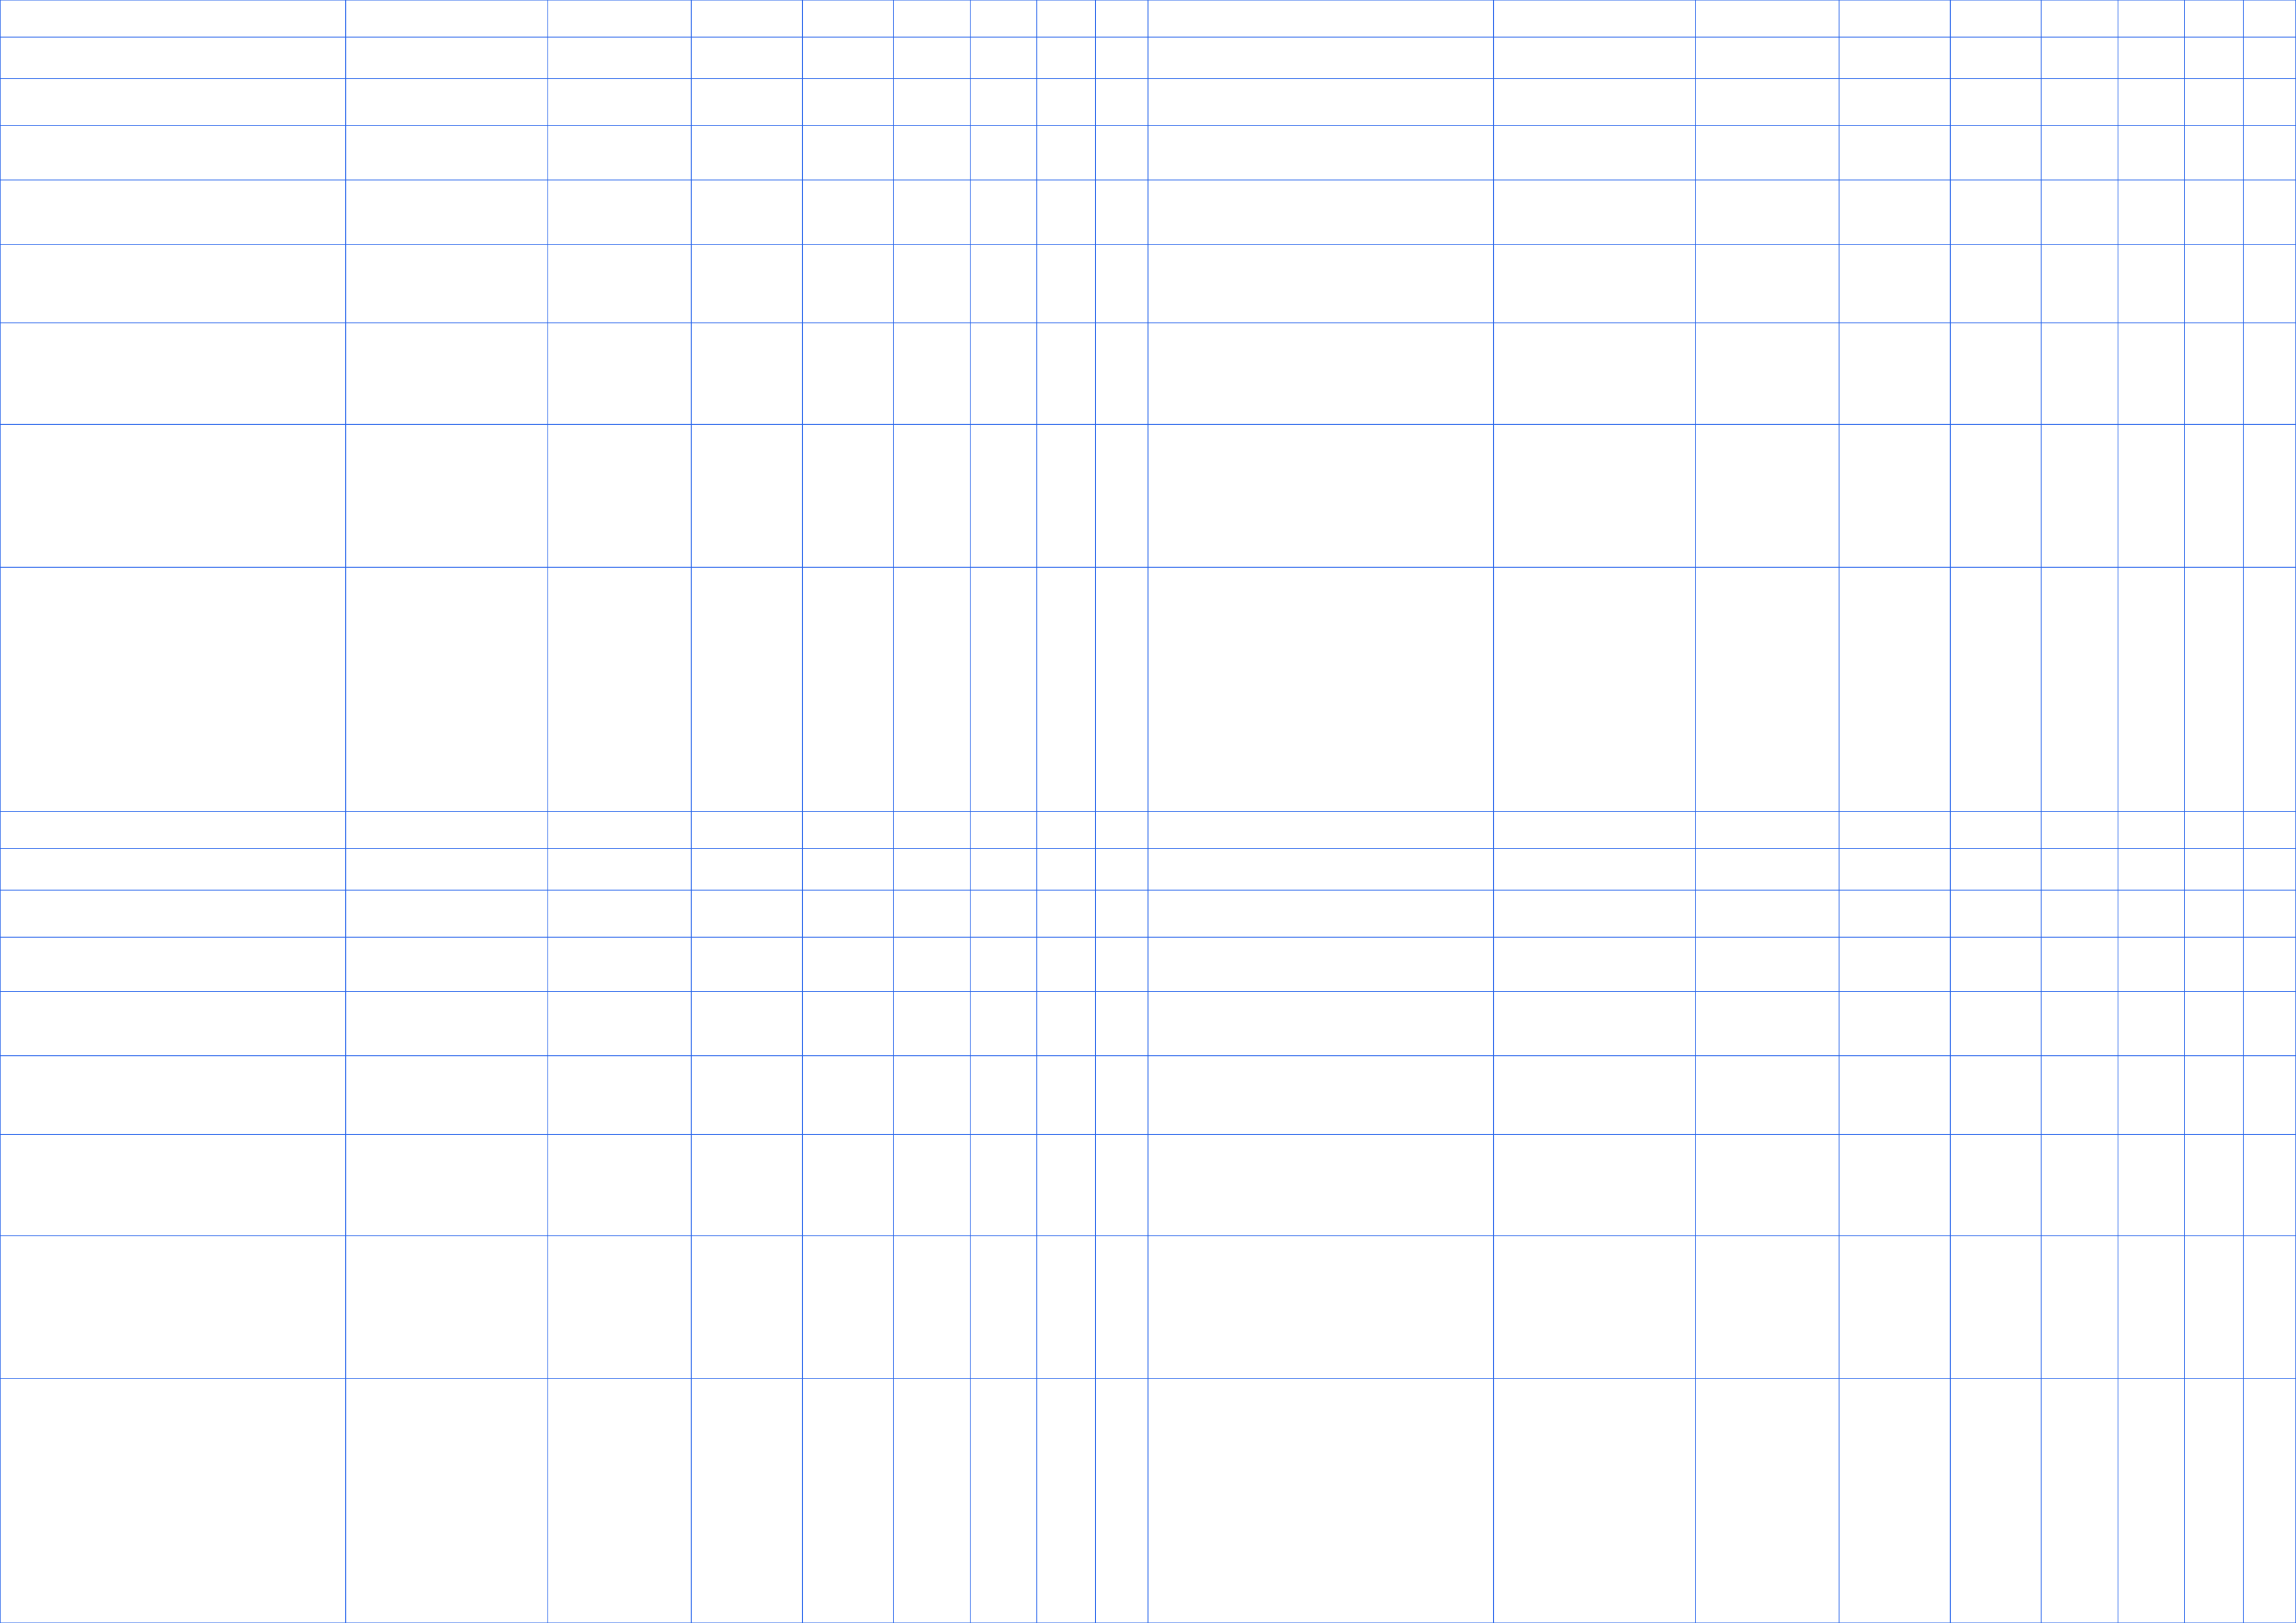
A2 — 420 × 594 mm (16.54 × 23.39 in)
Legal — 216 × 356 mm (8.5 × 14 in)
Tabloid — 279 × 432 mm (11 × 17 in)
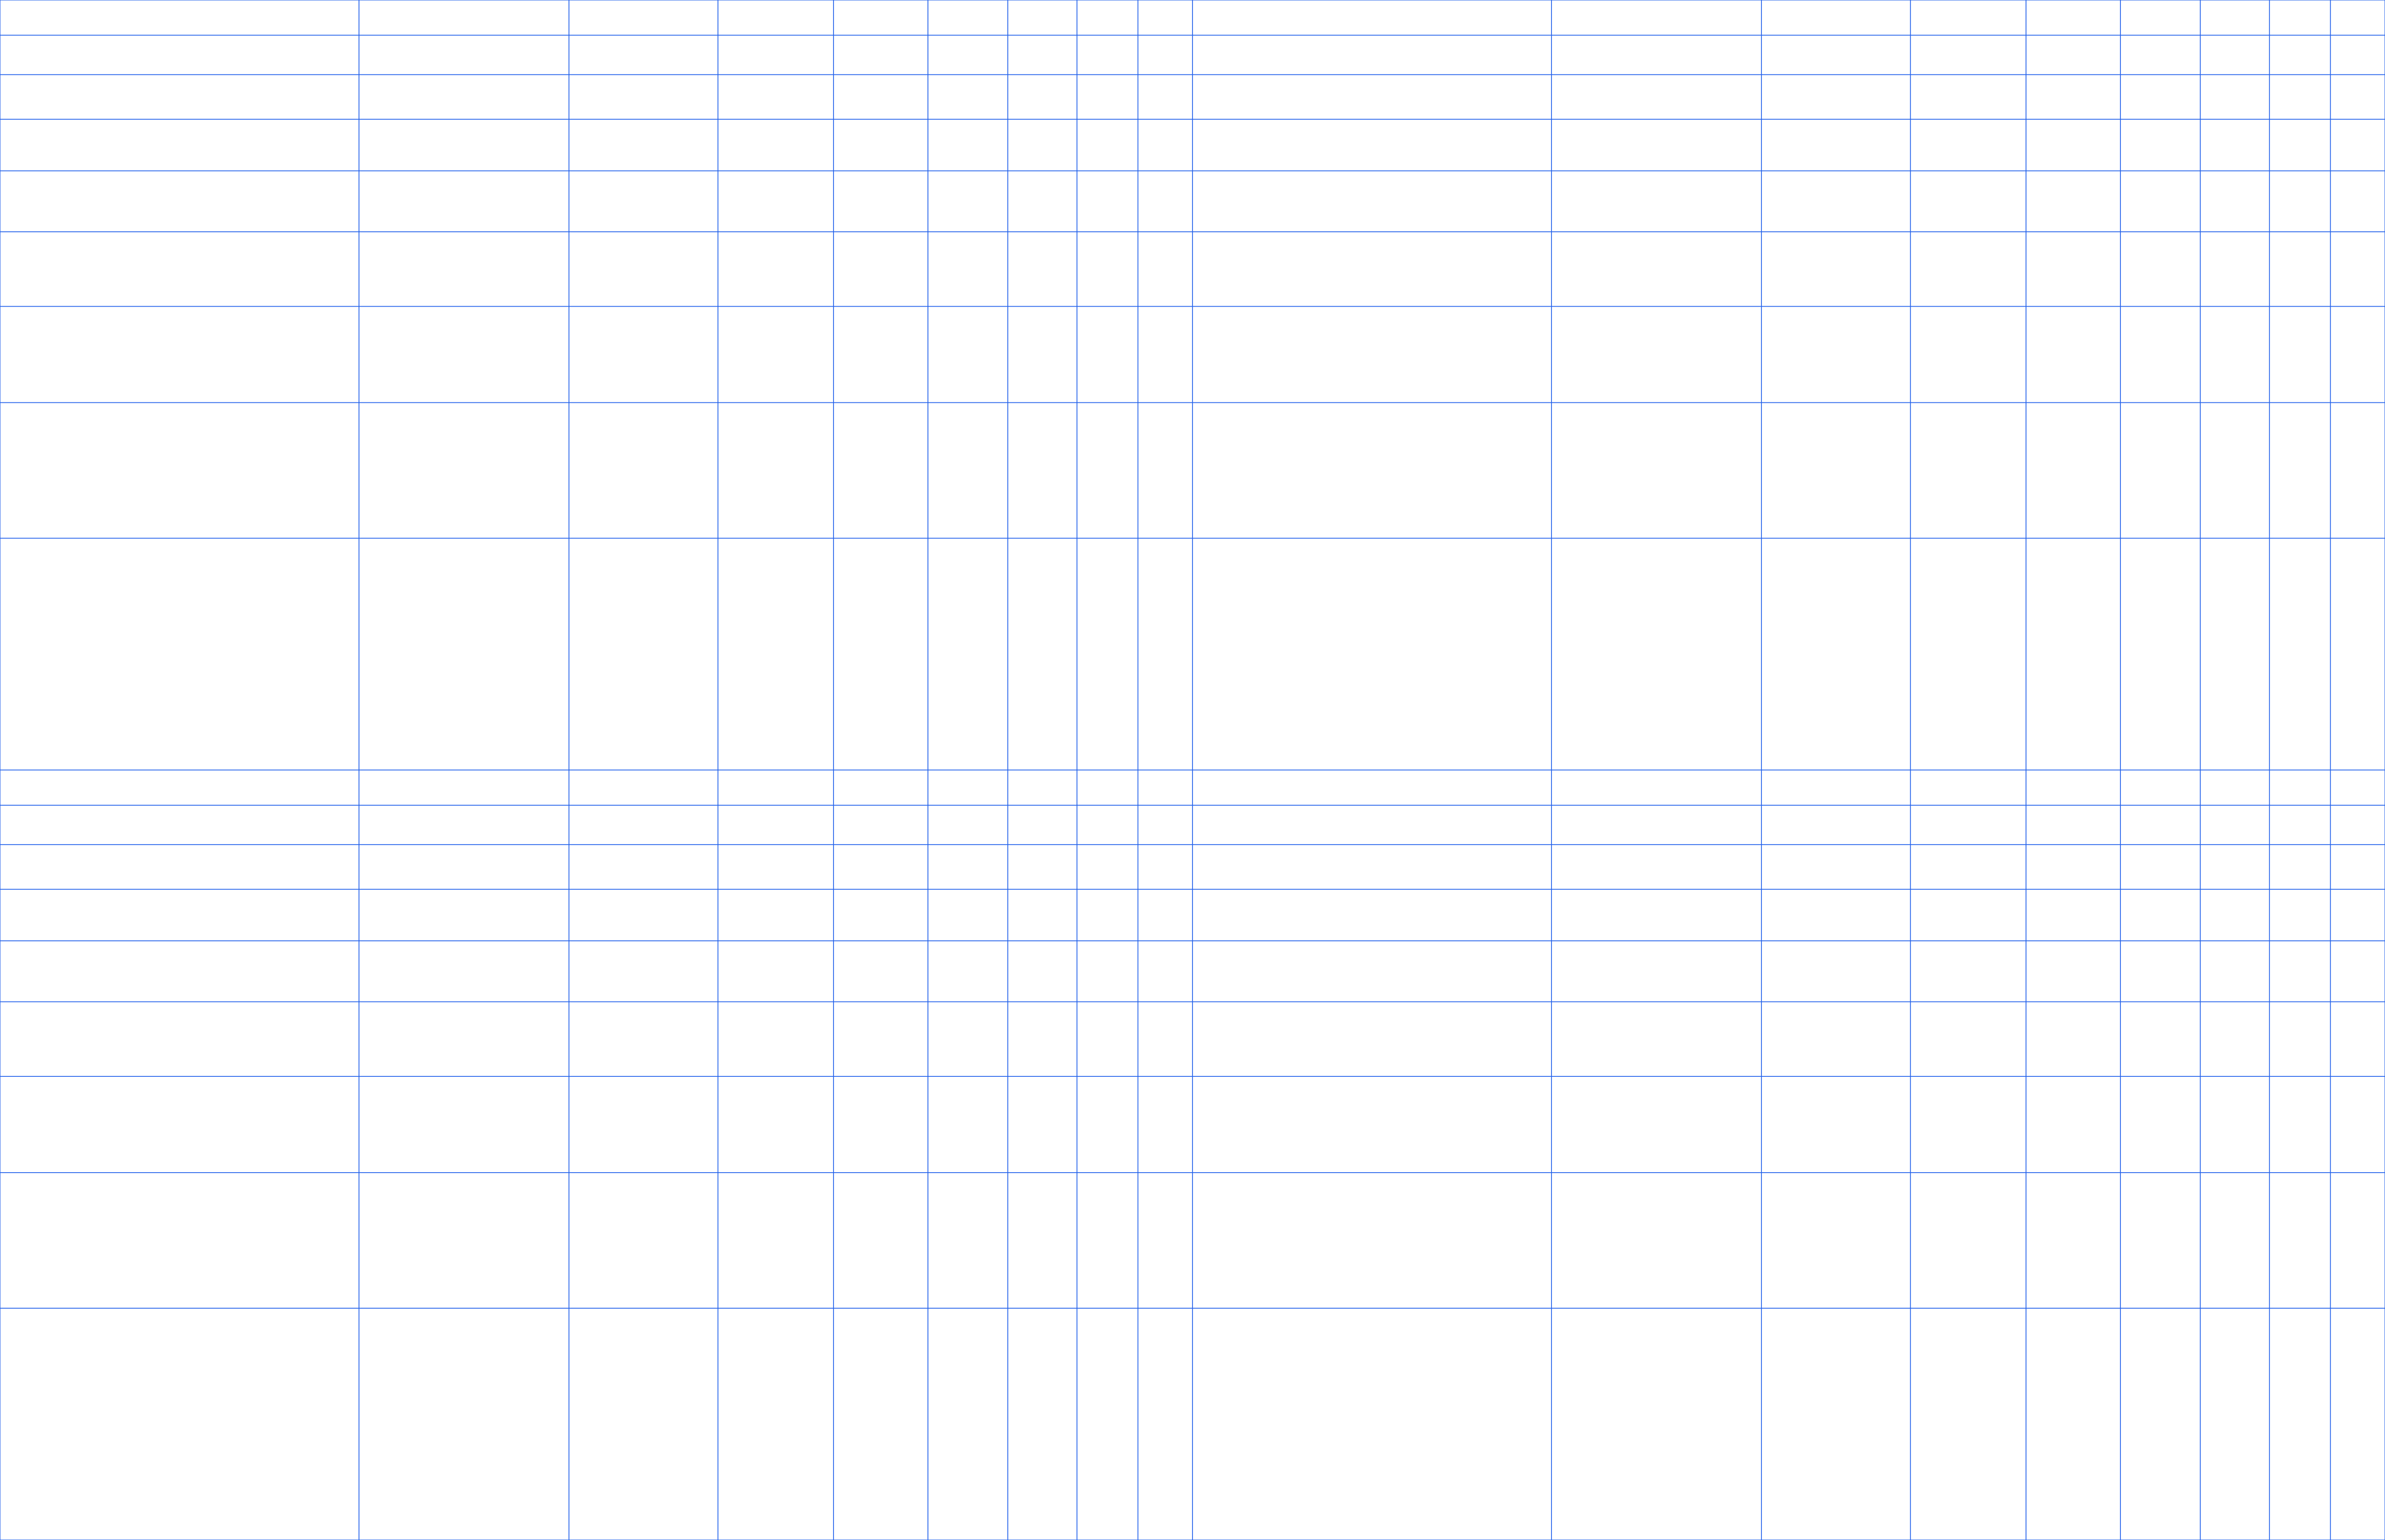
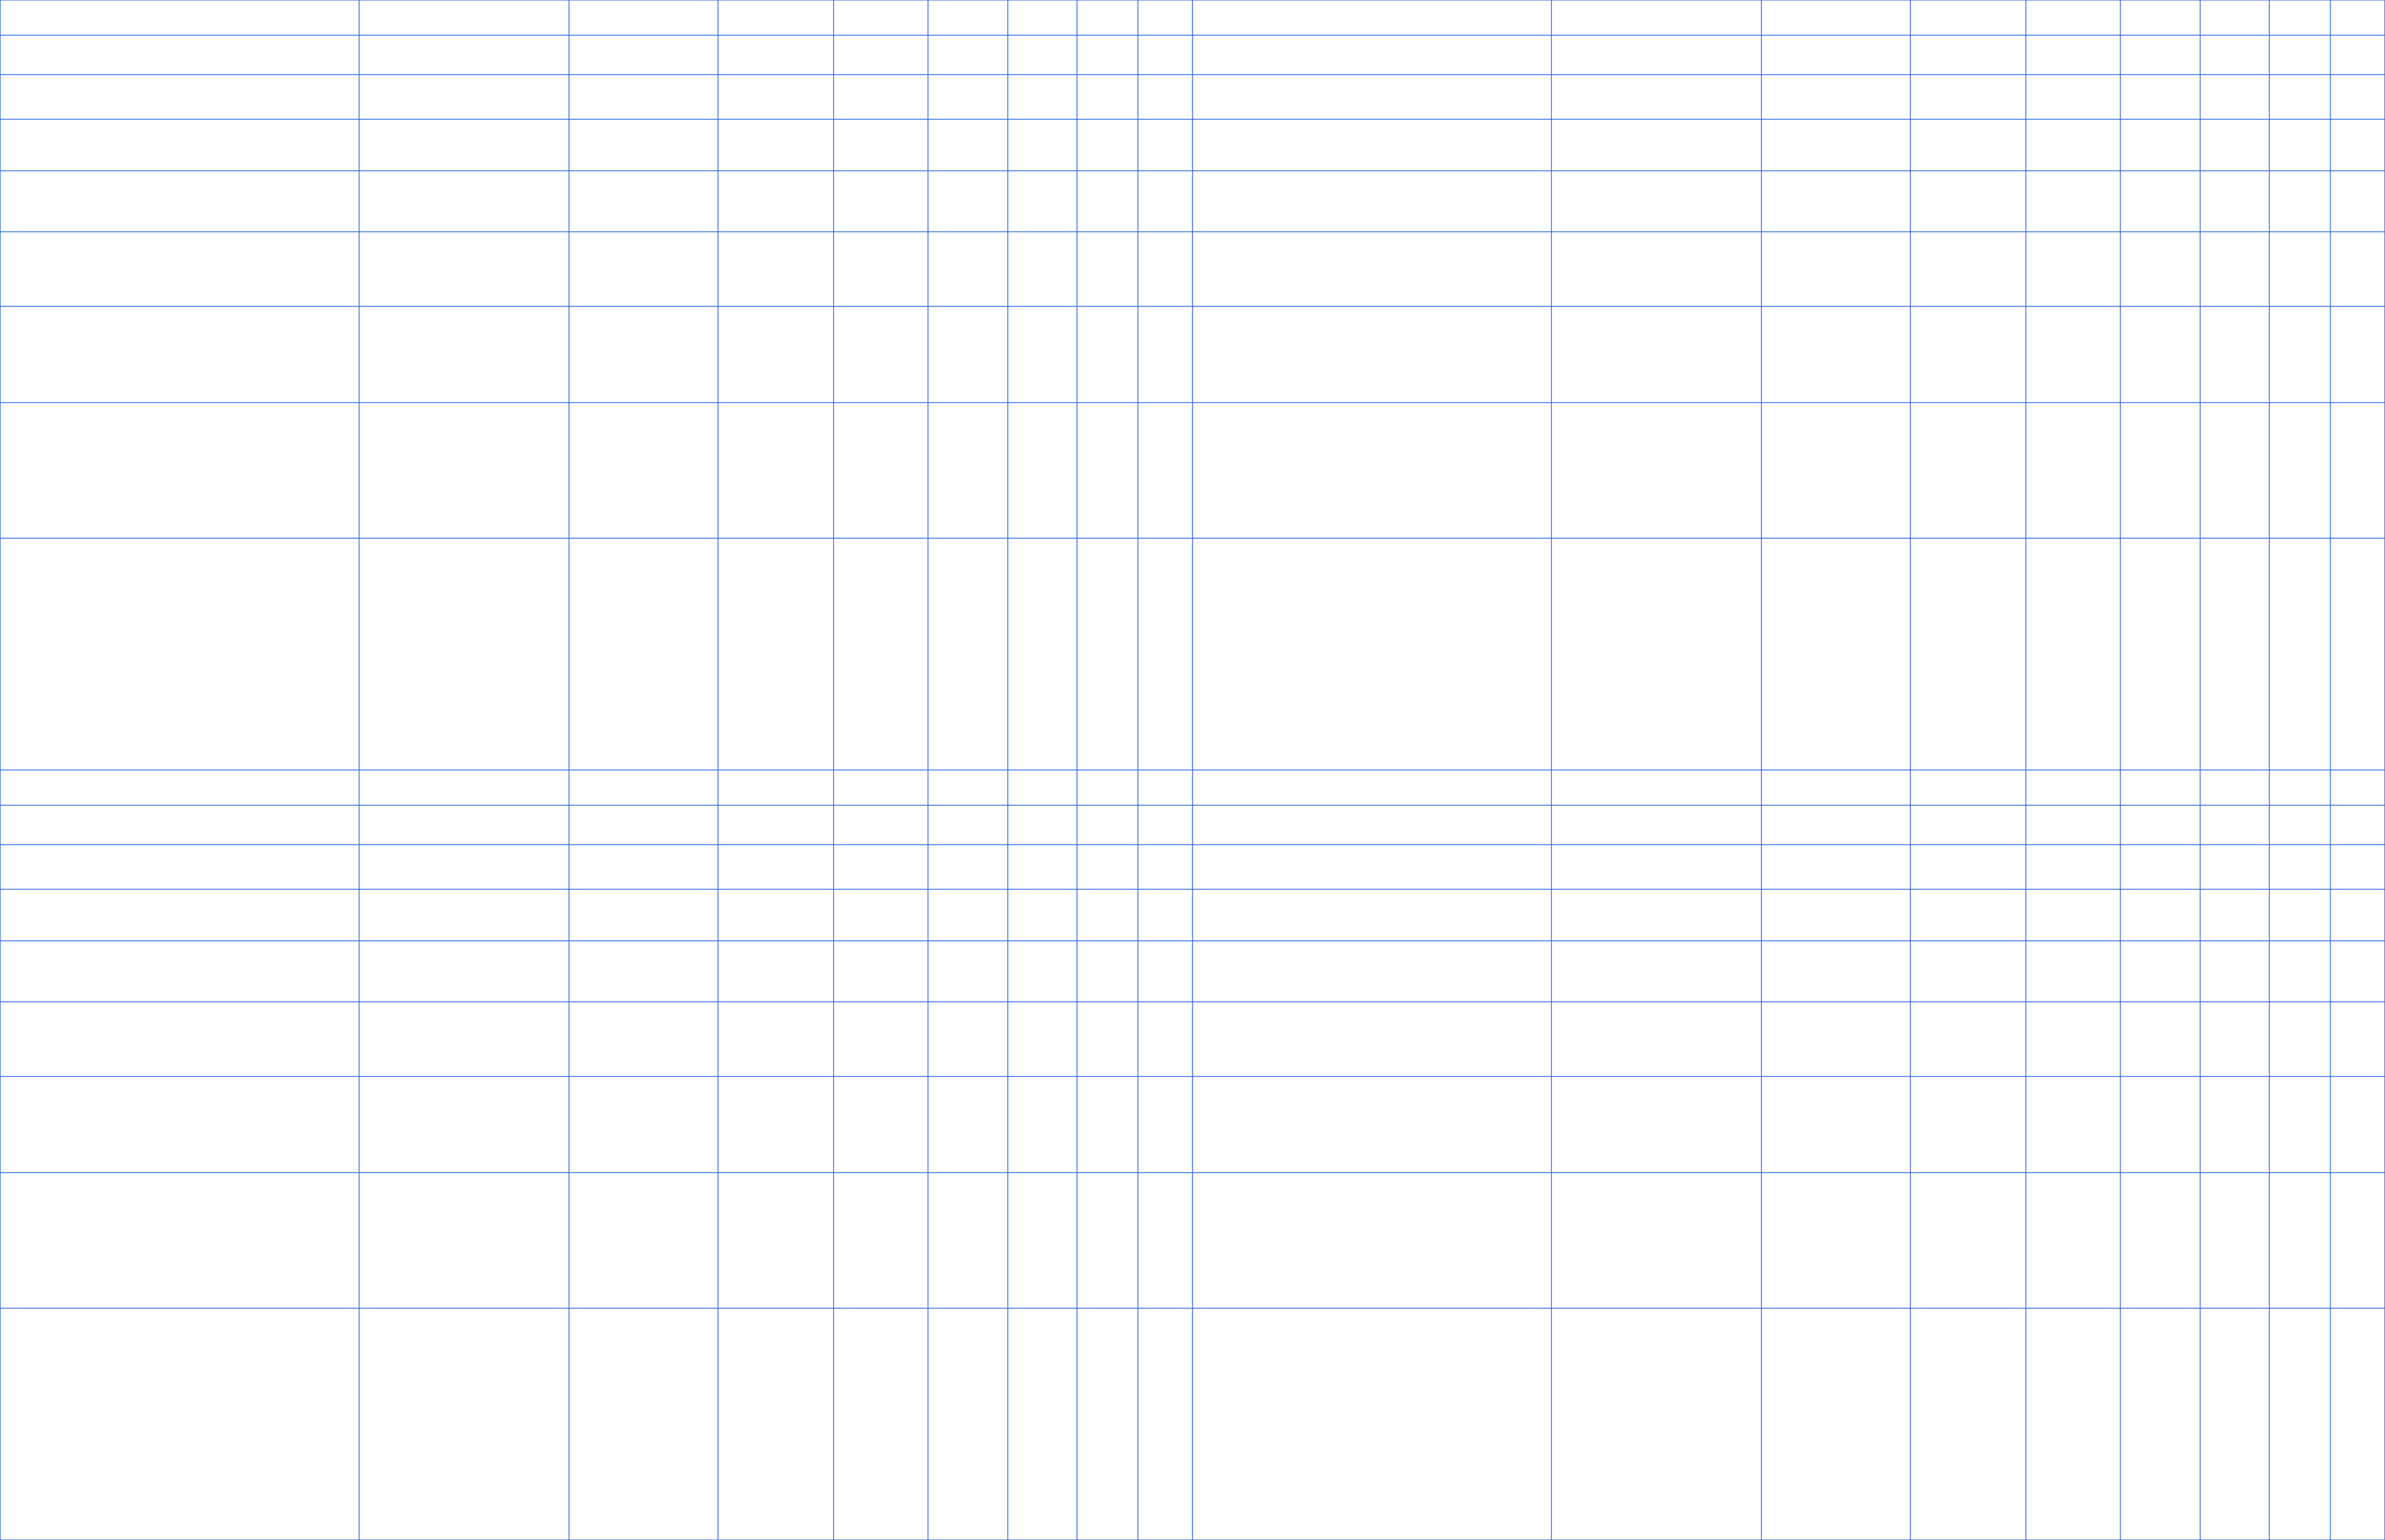
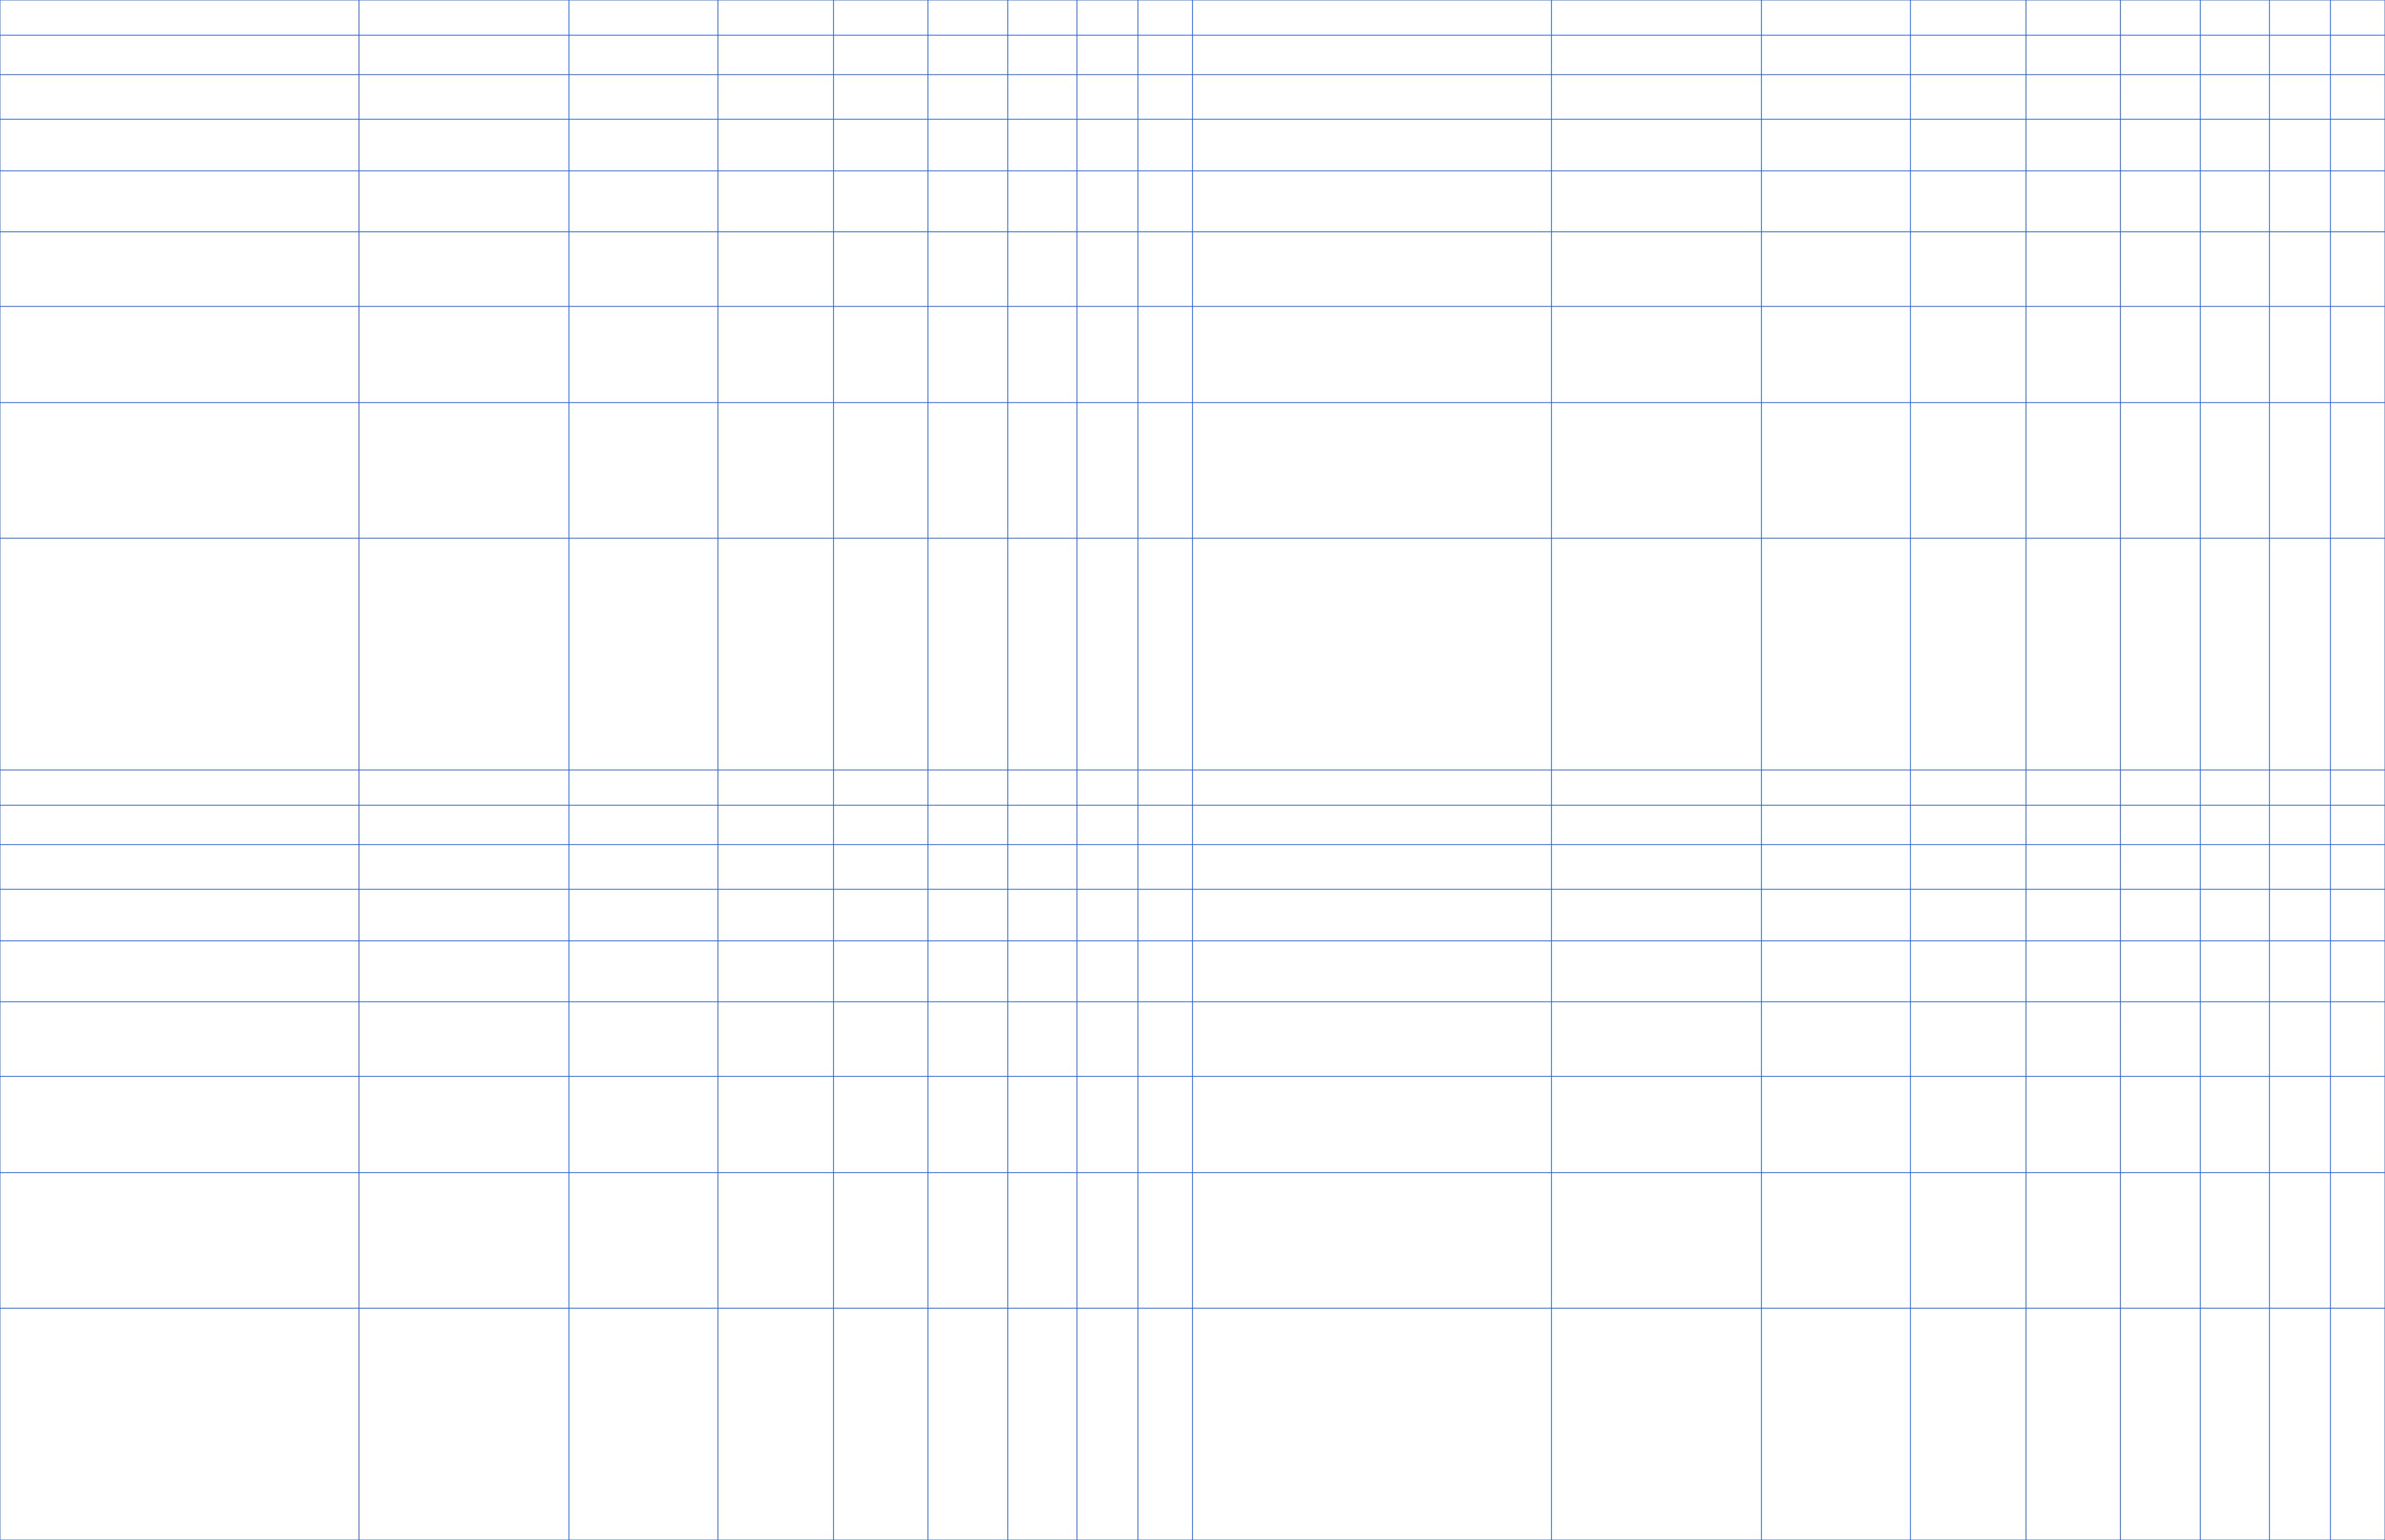
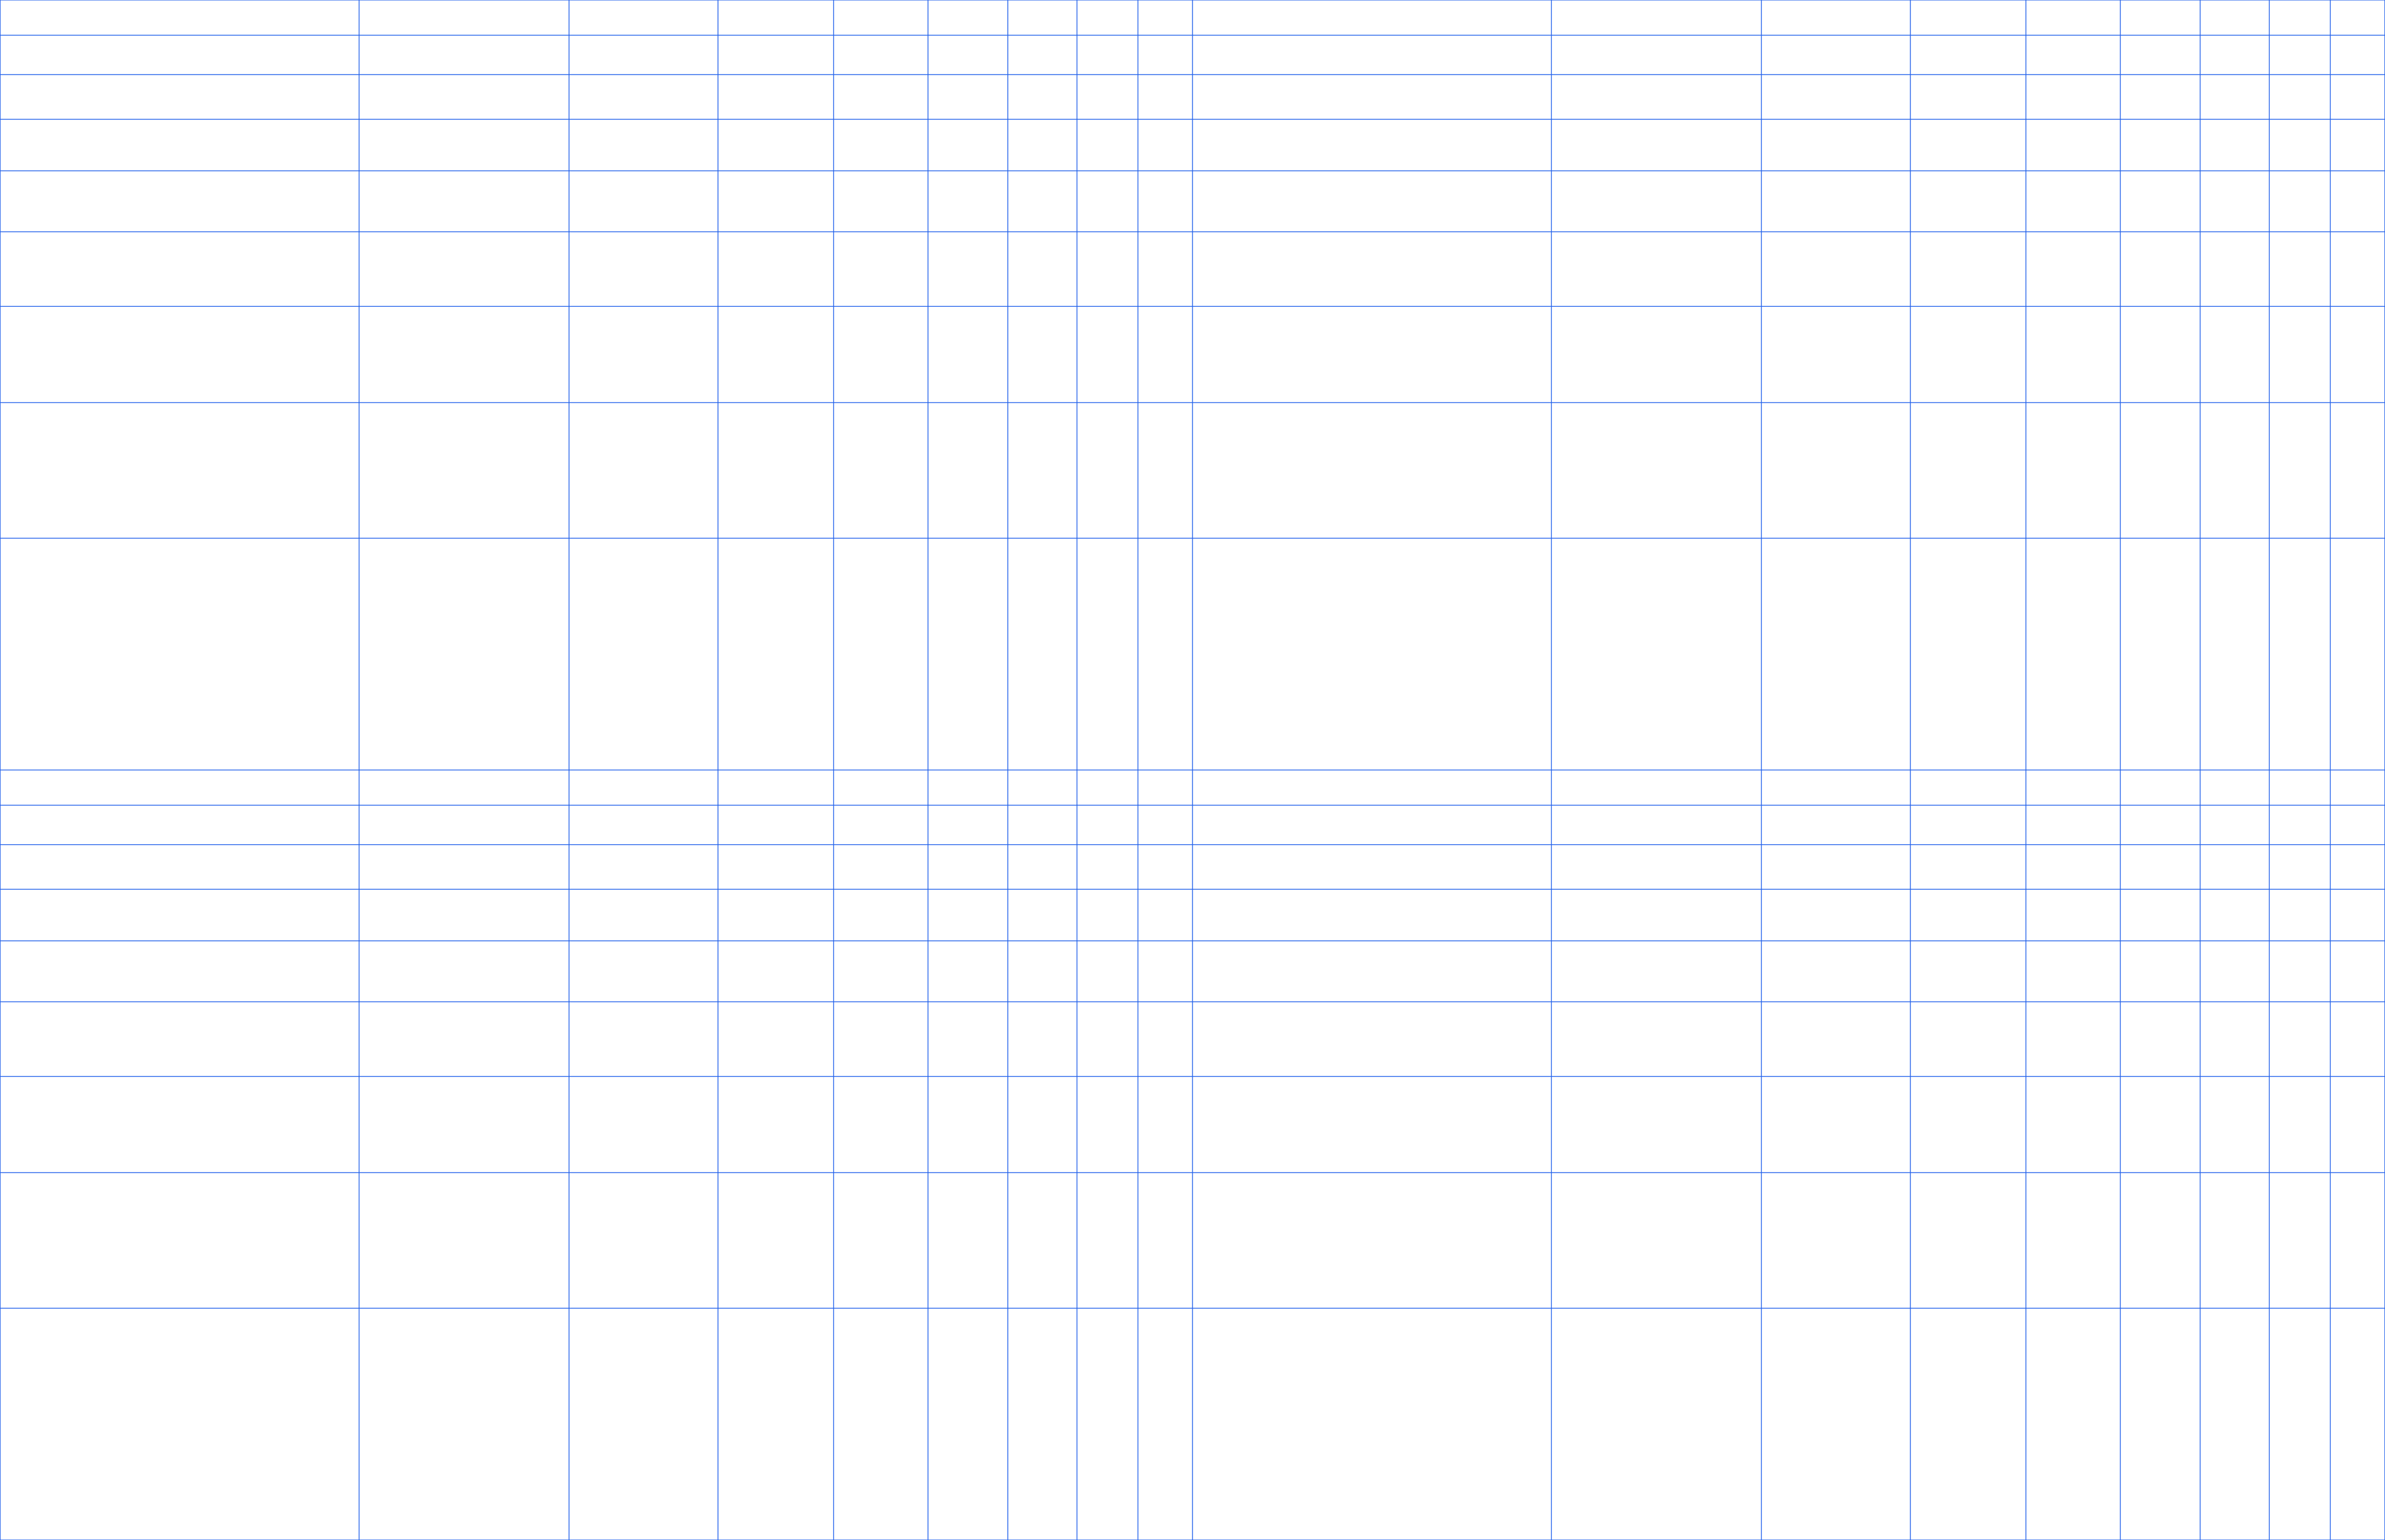
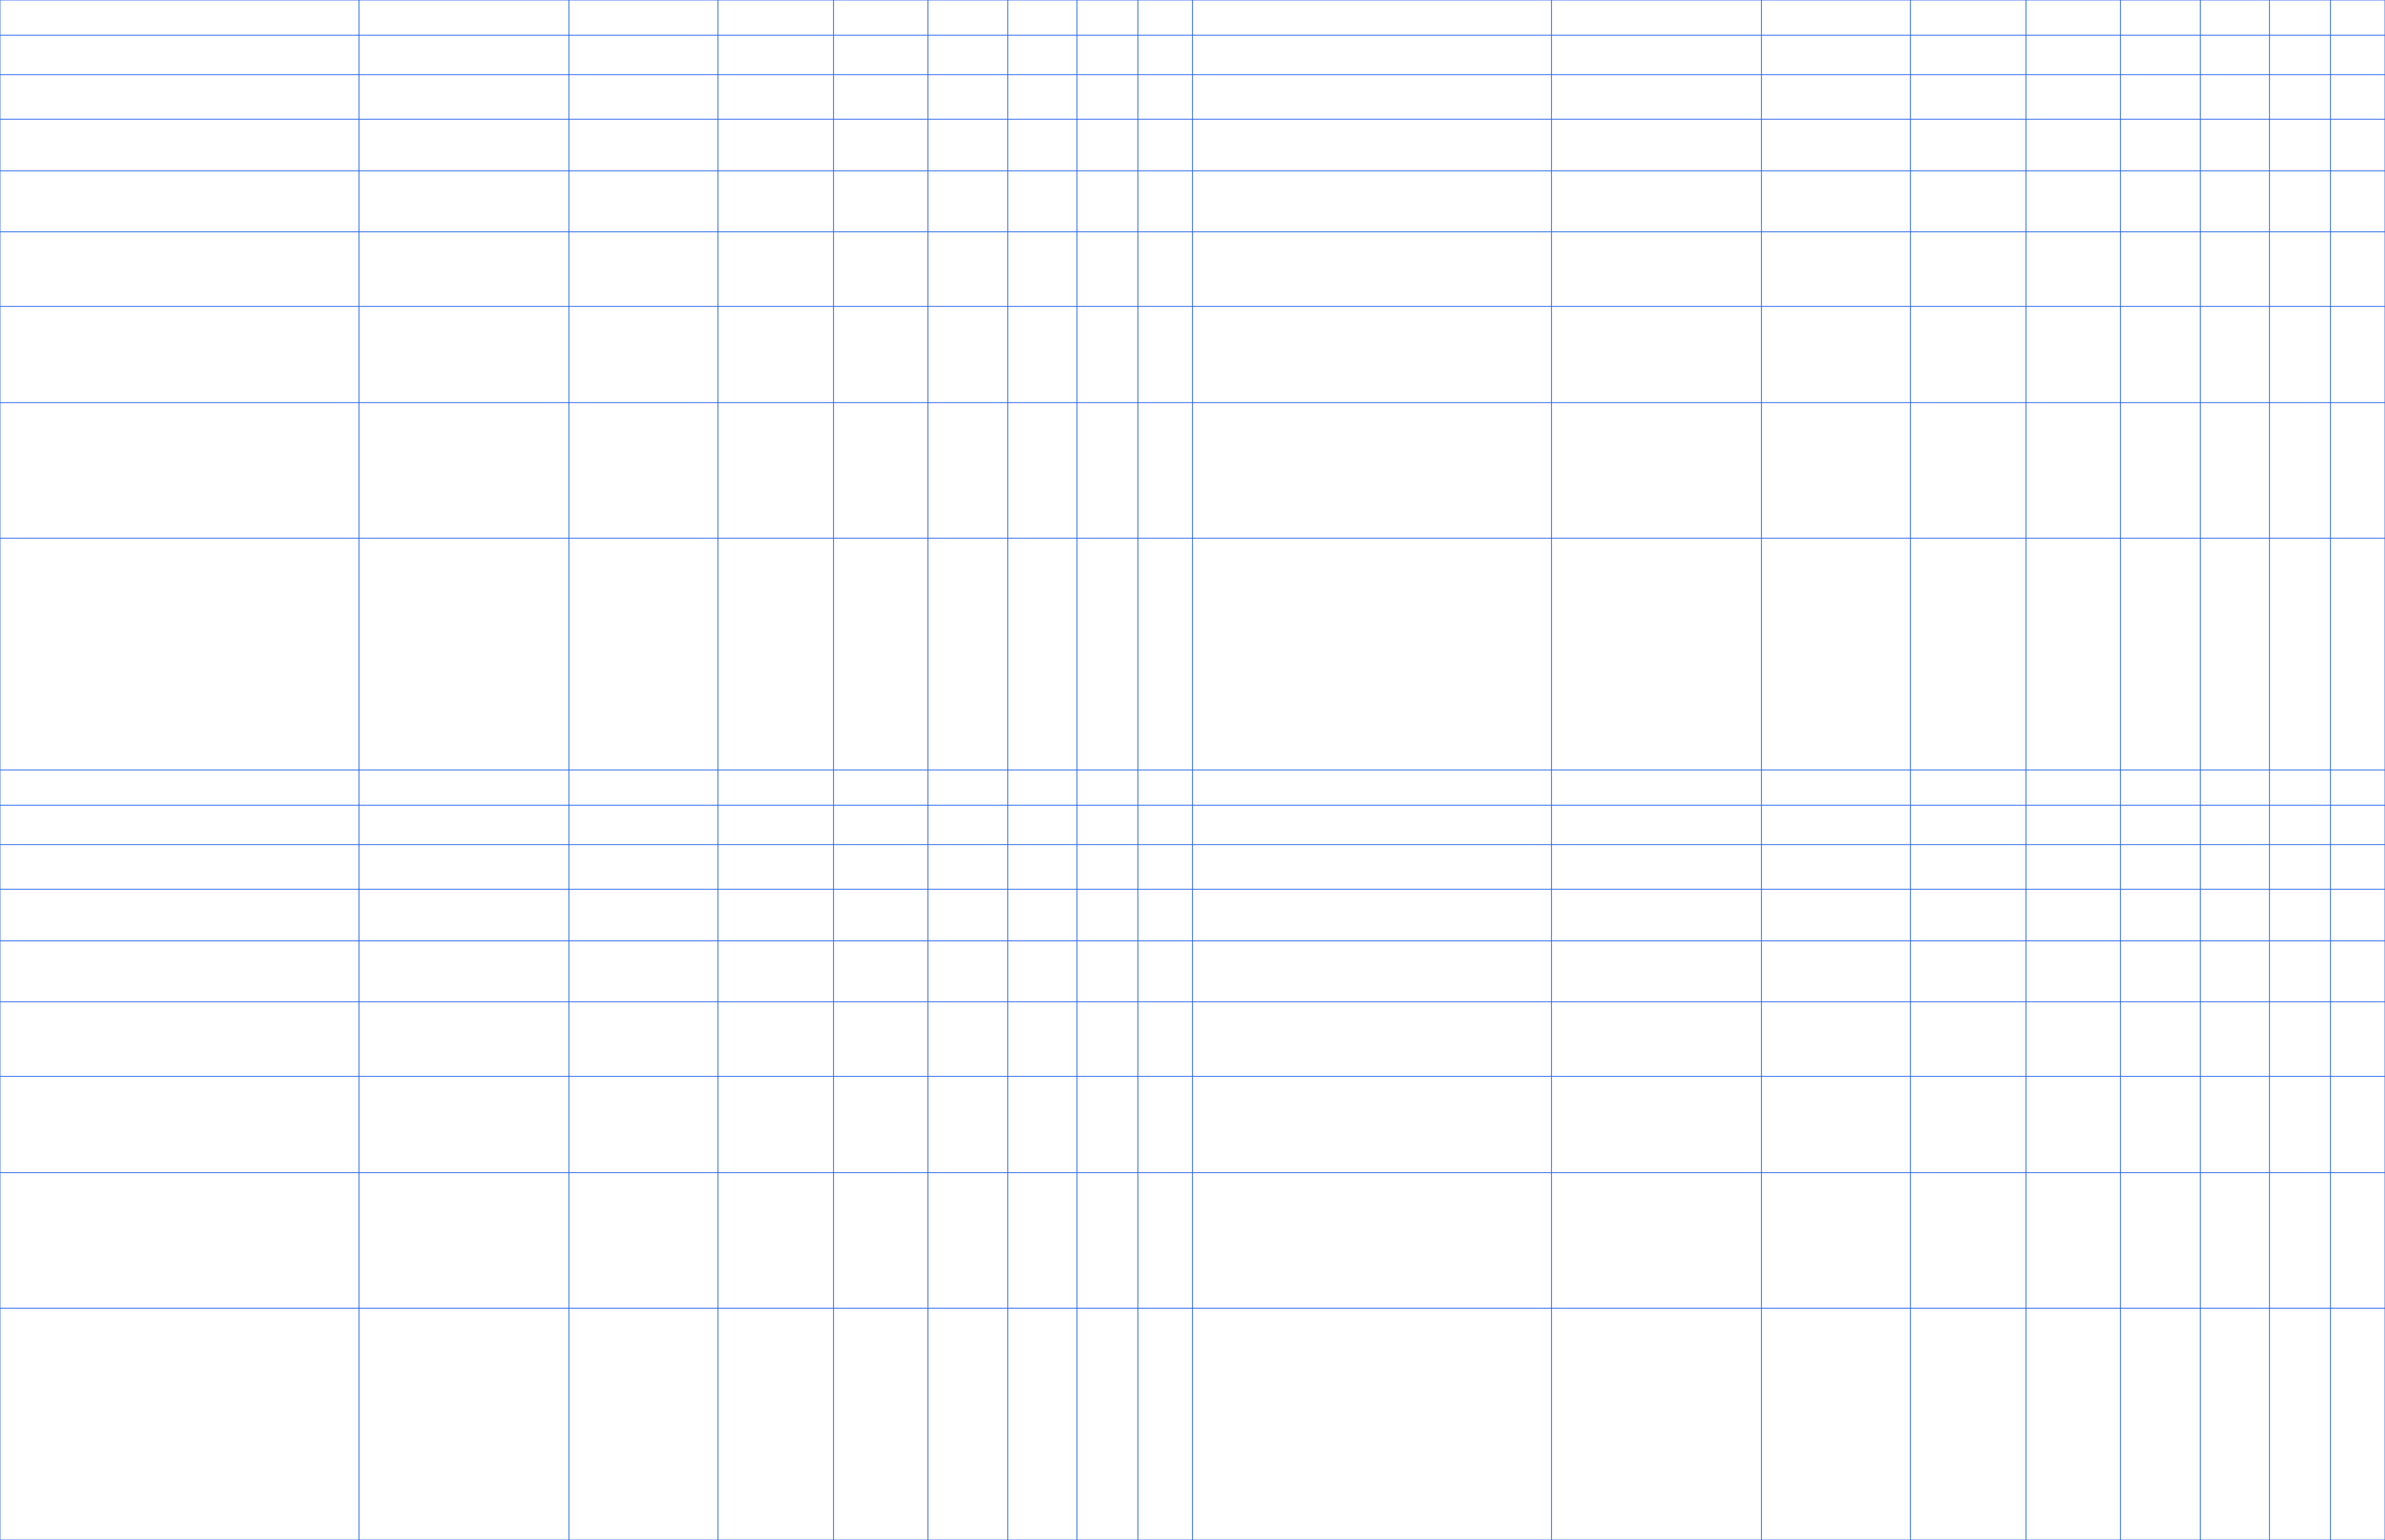
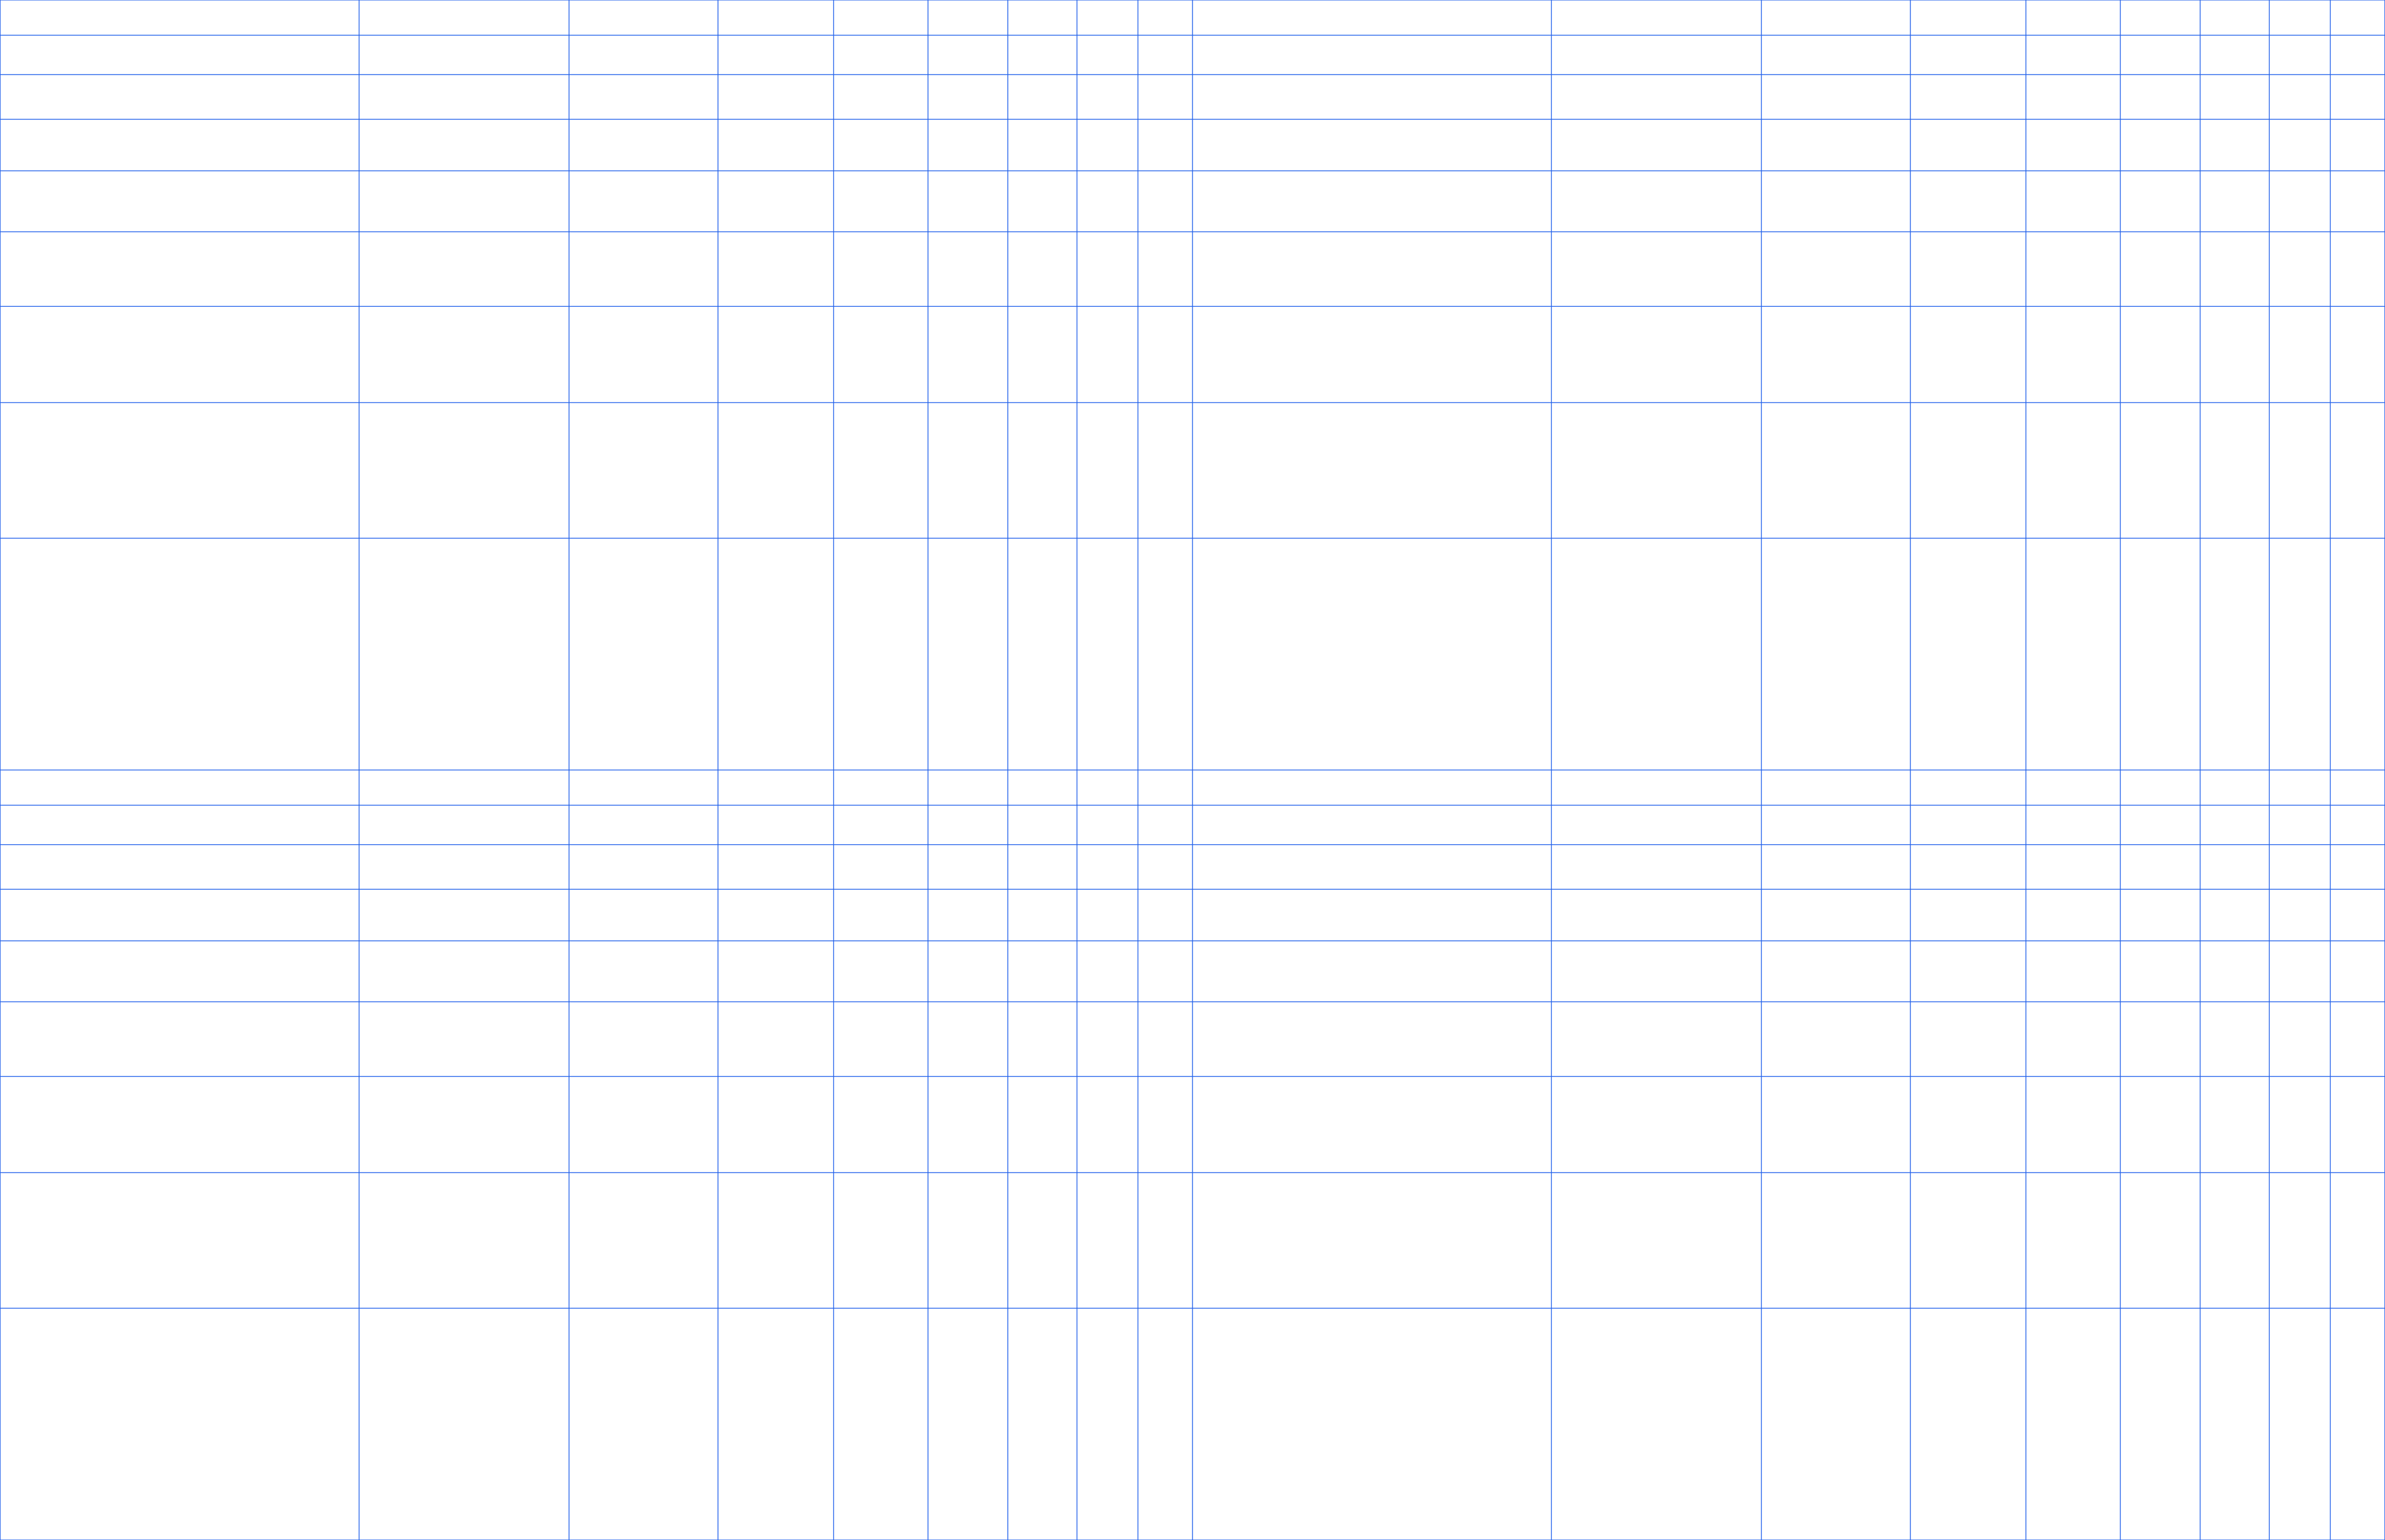
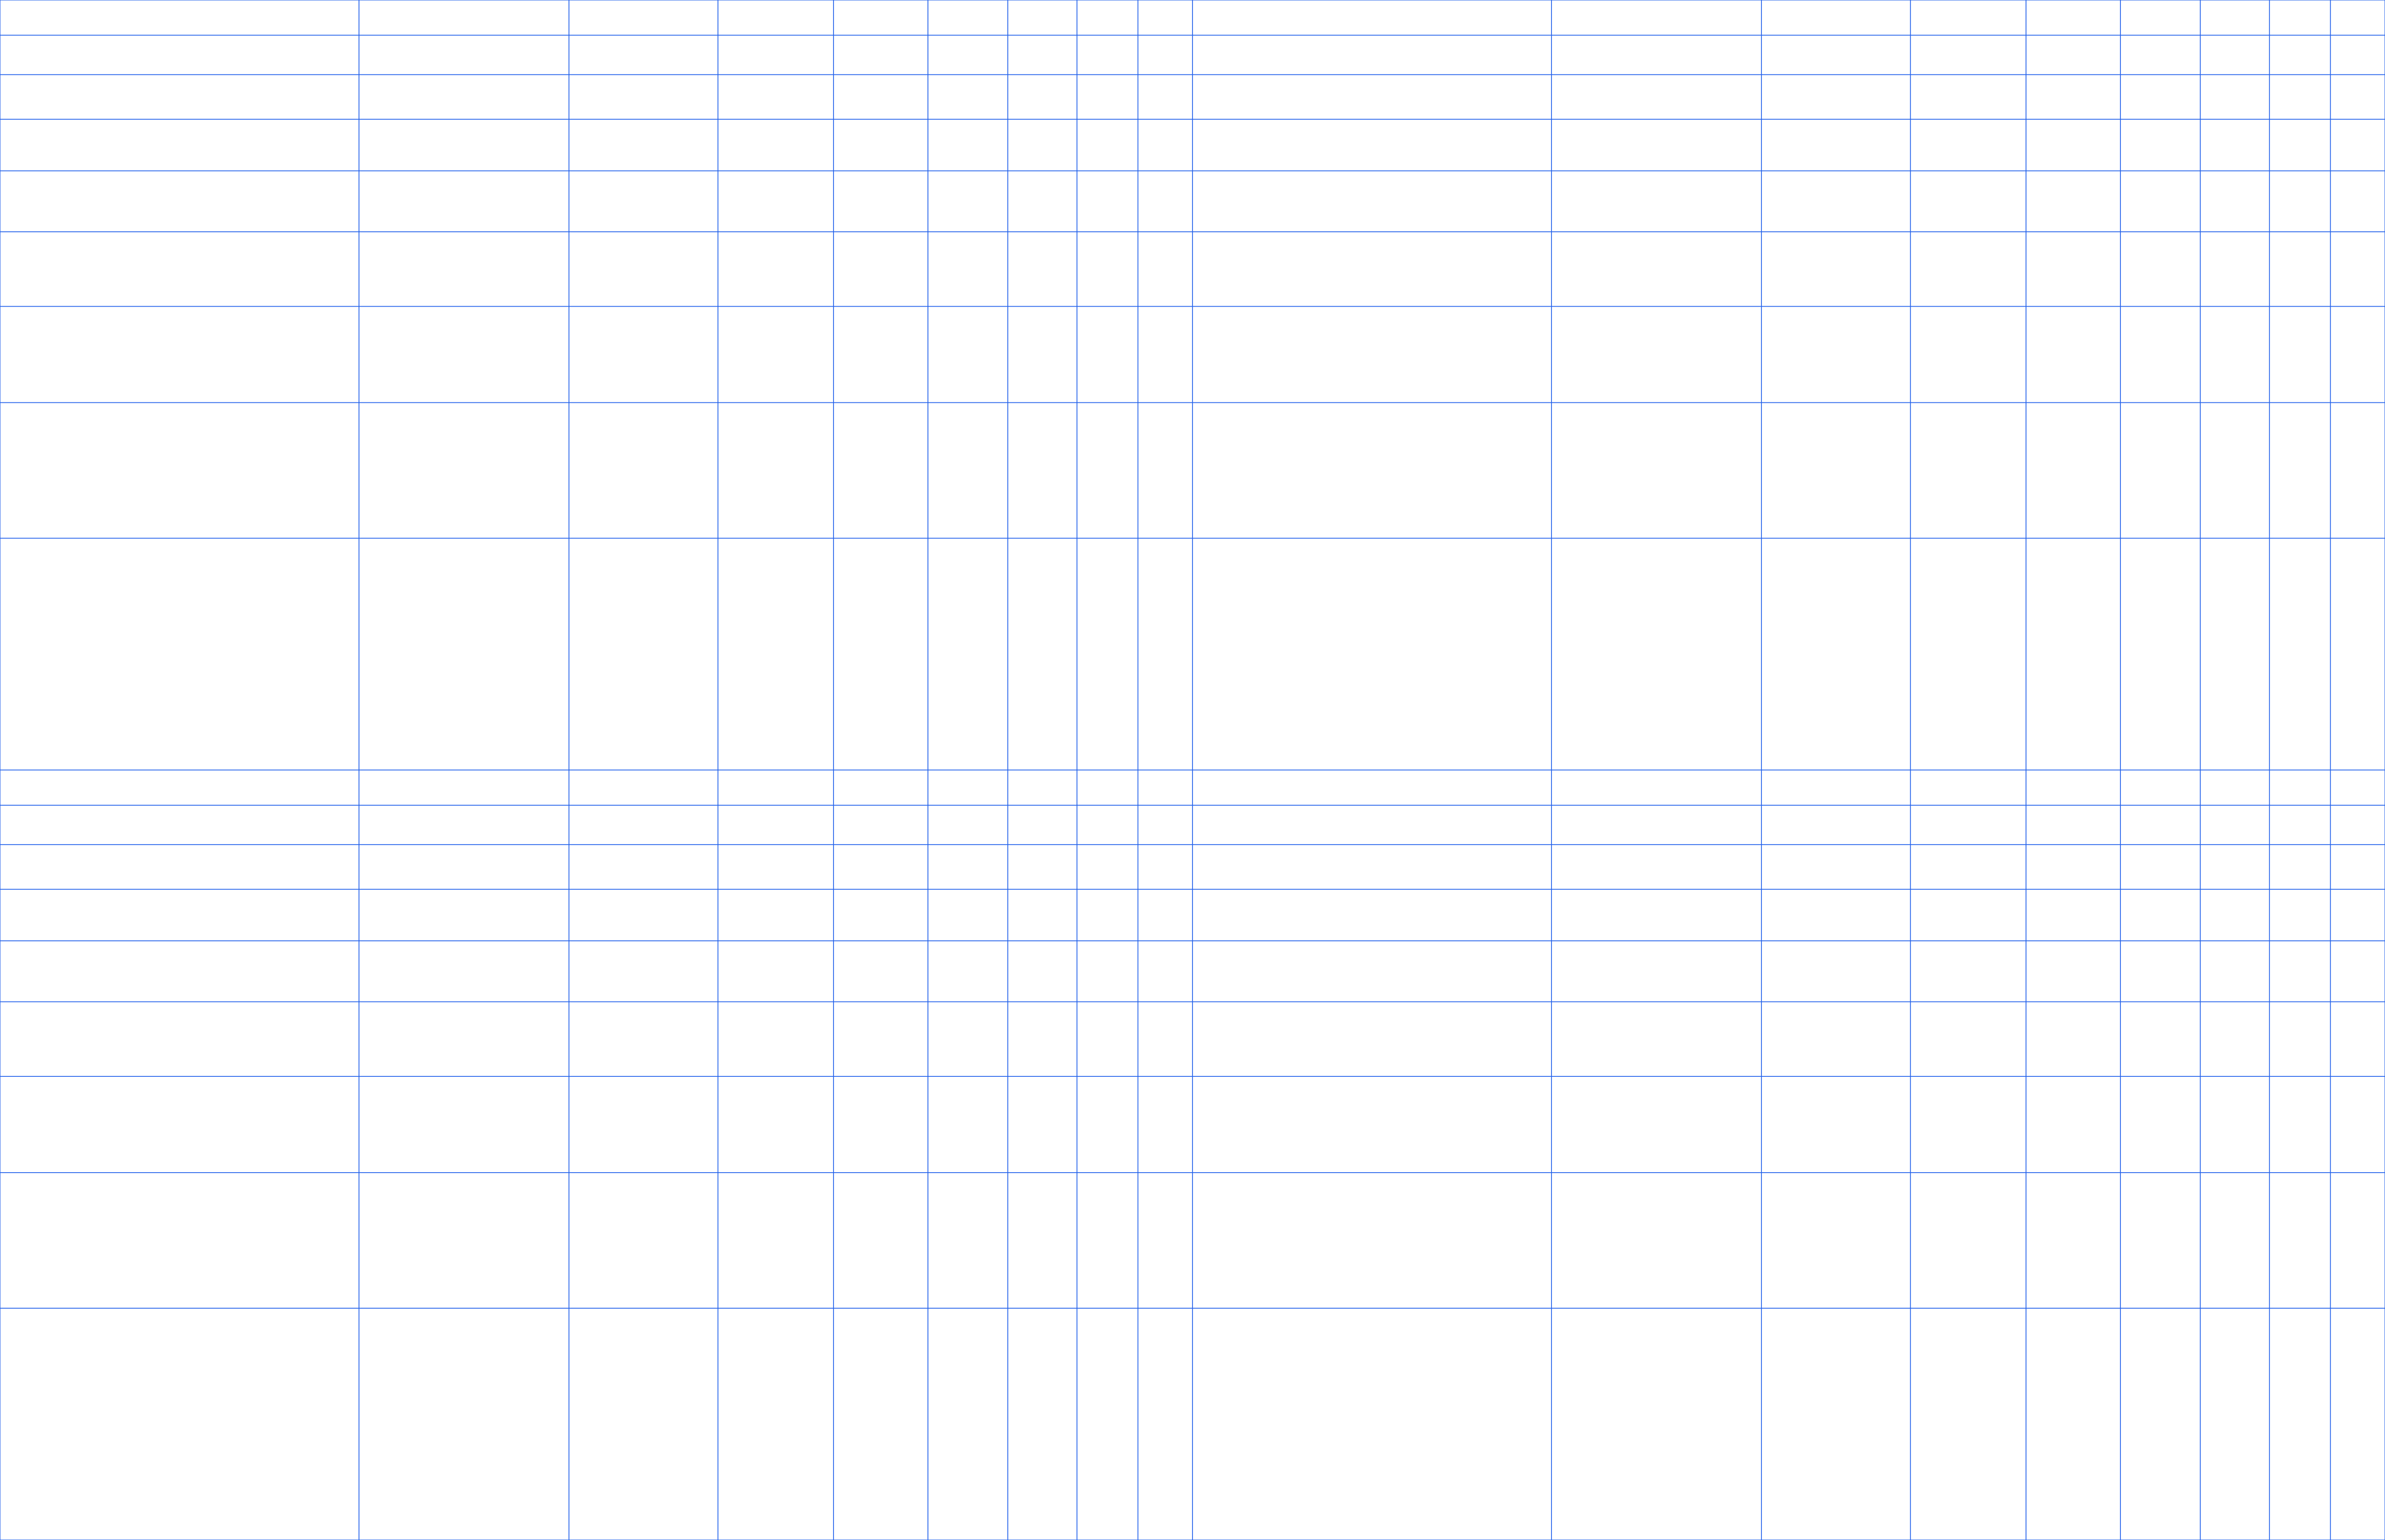
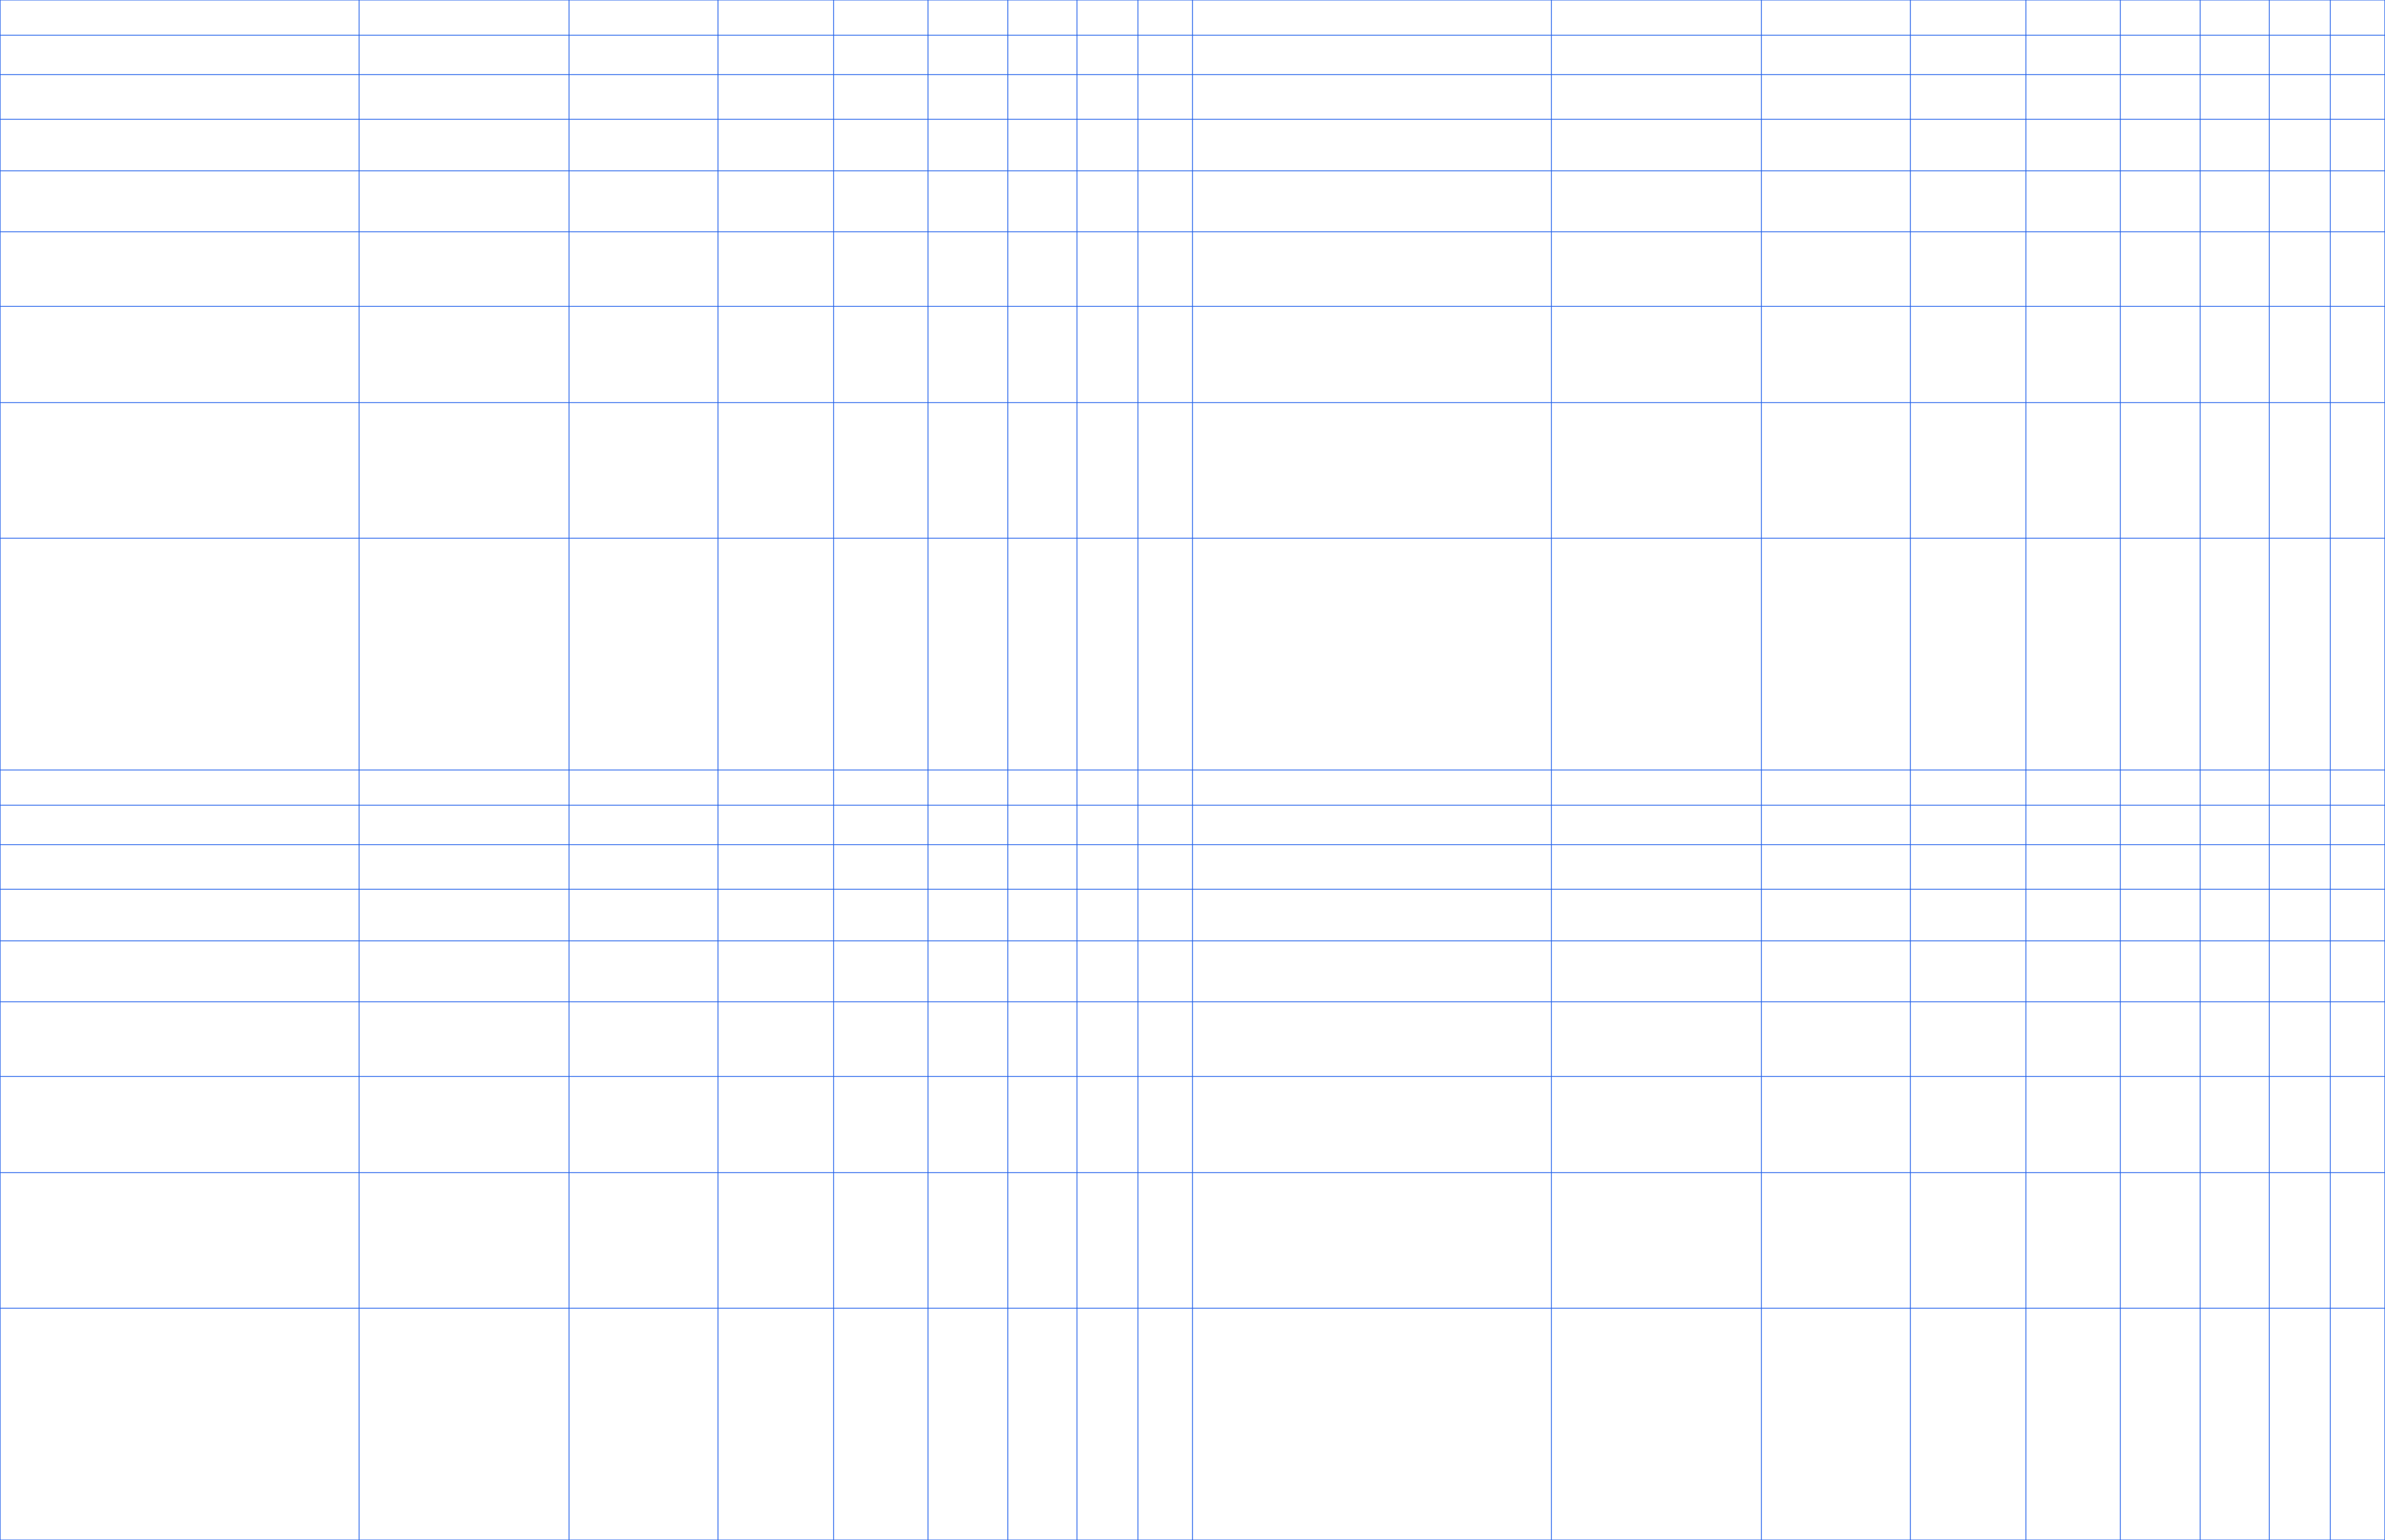
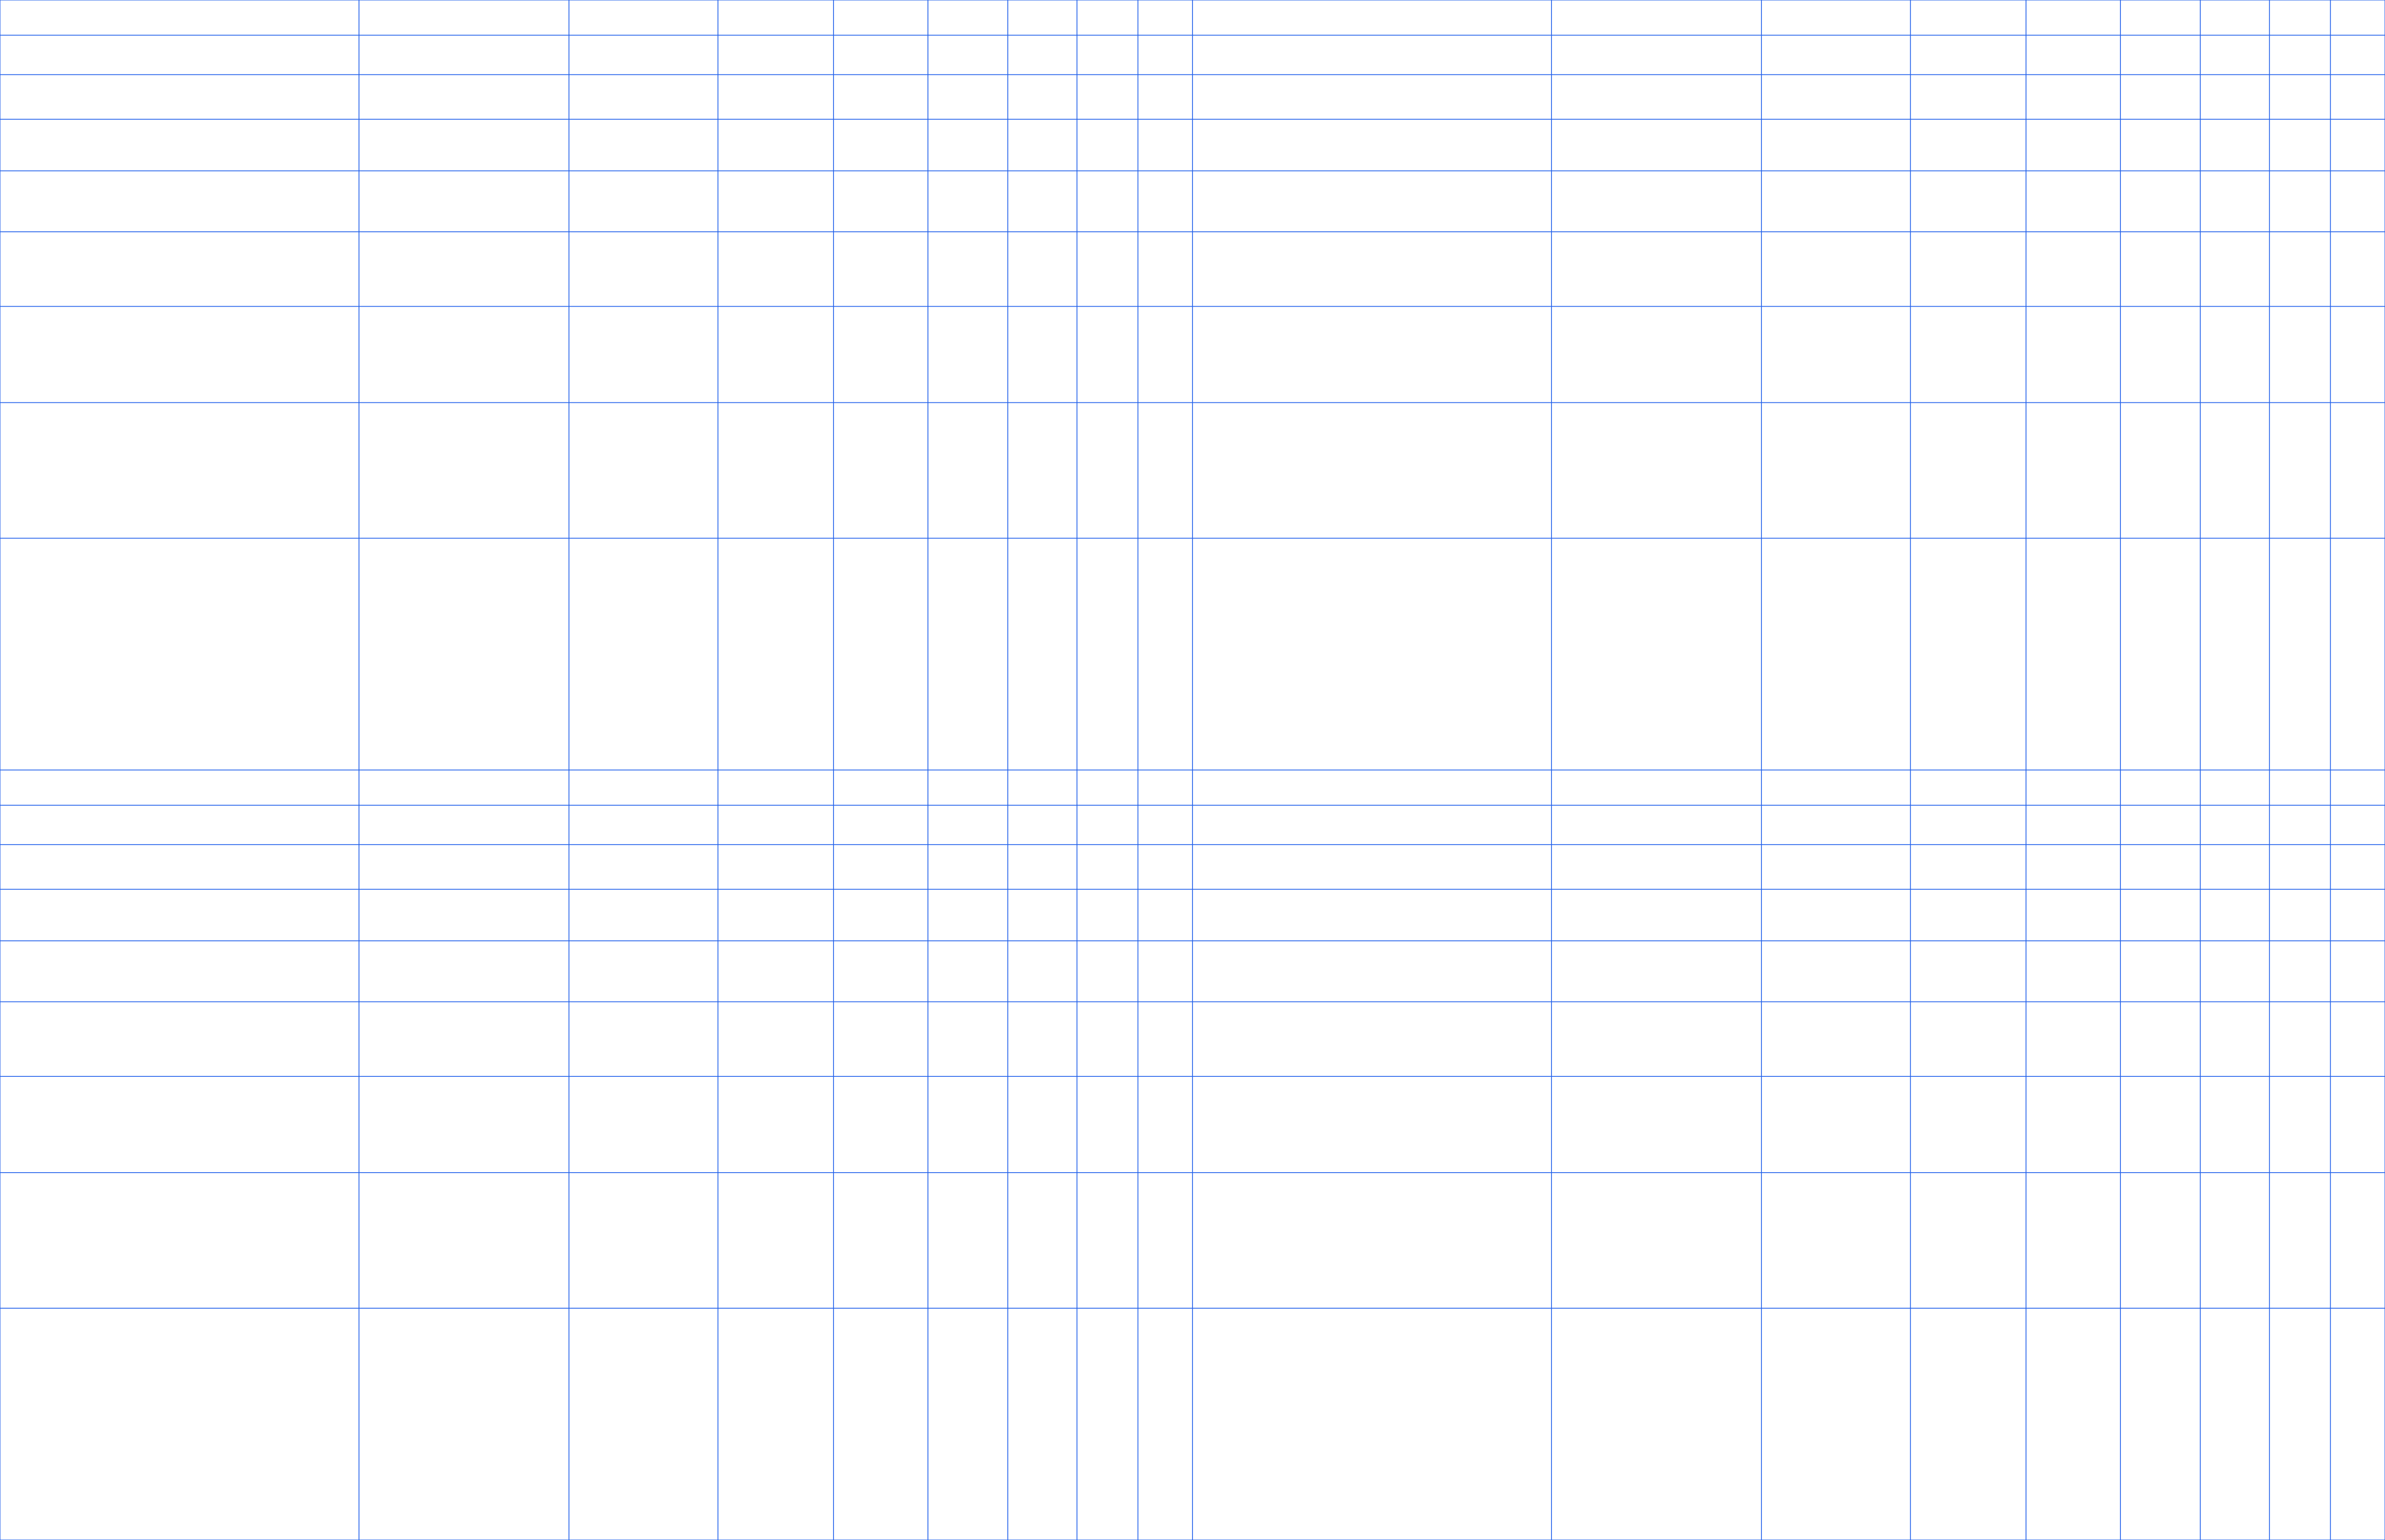
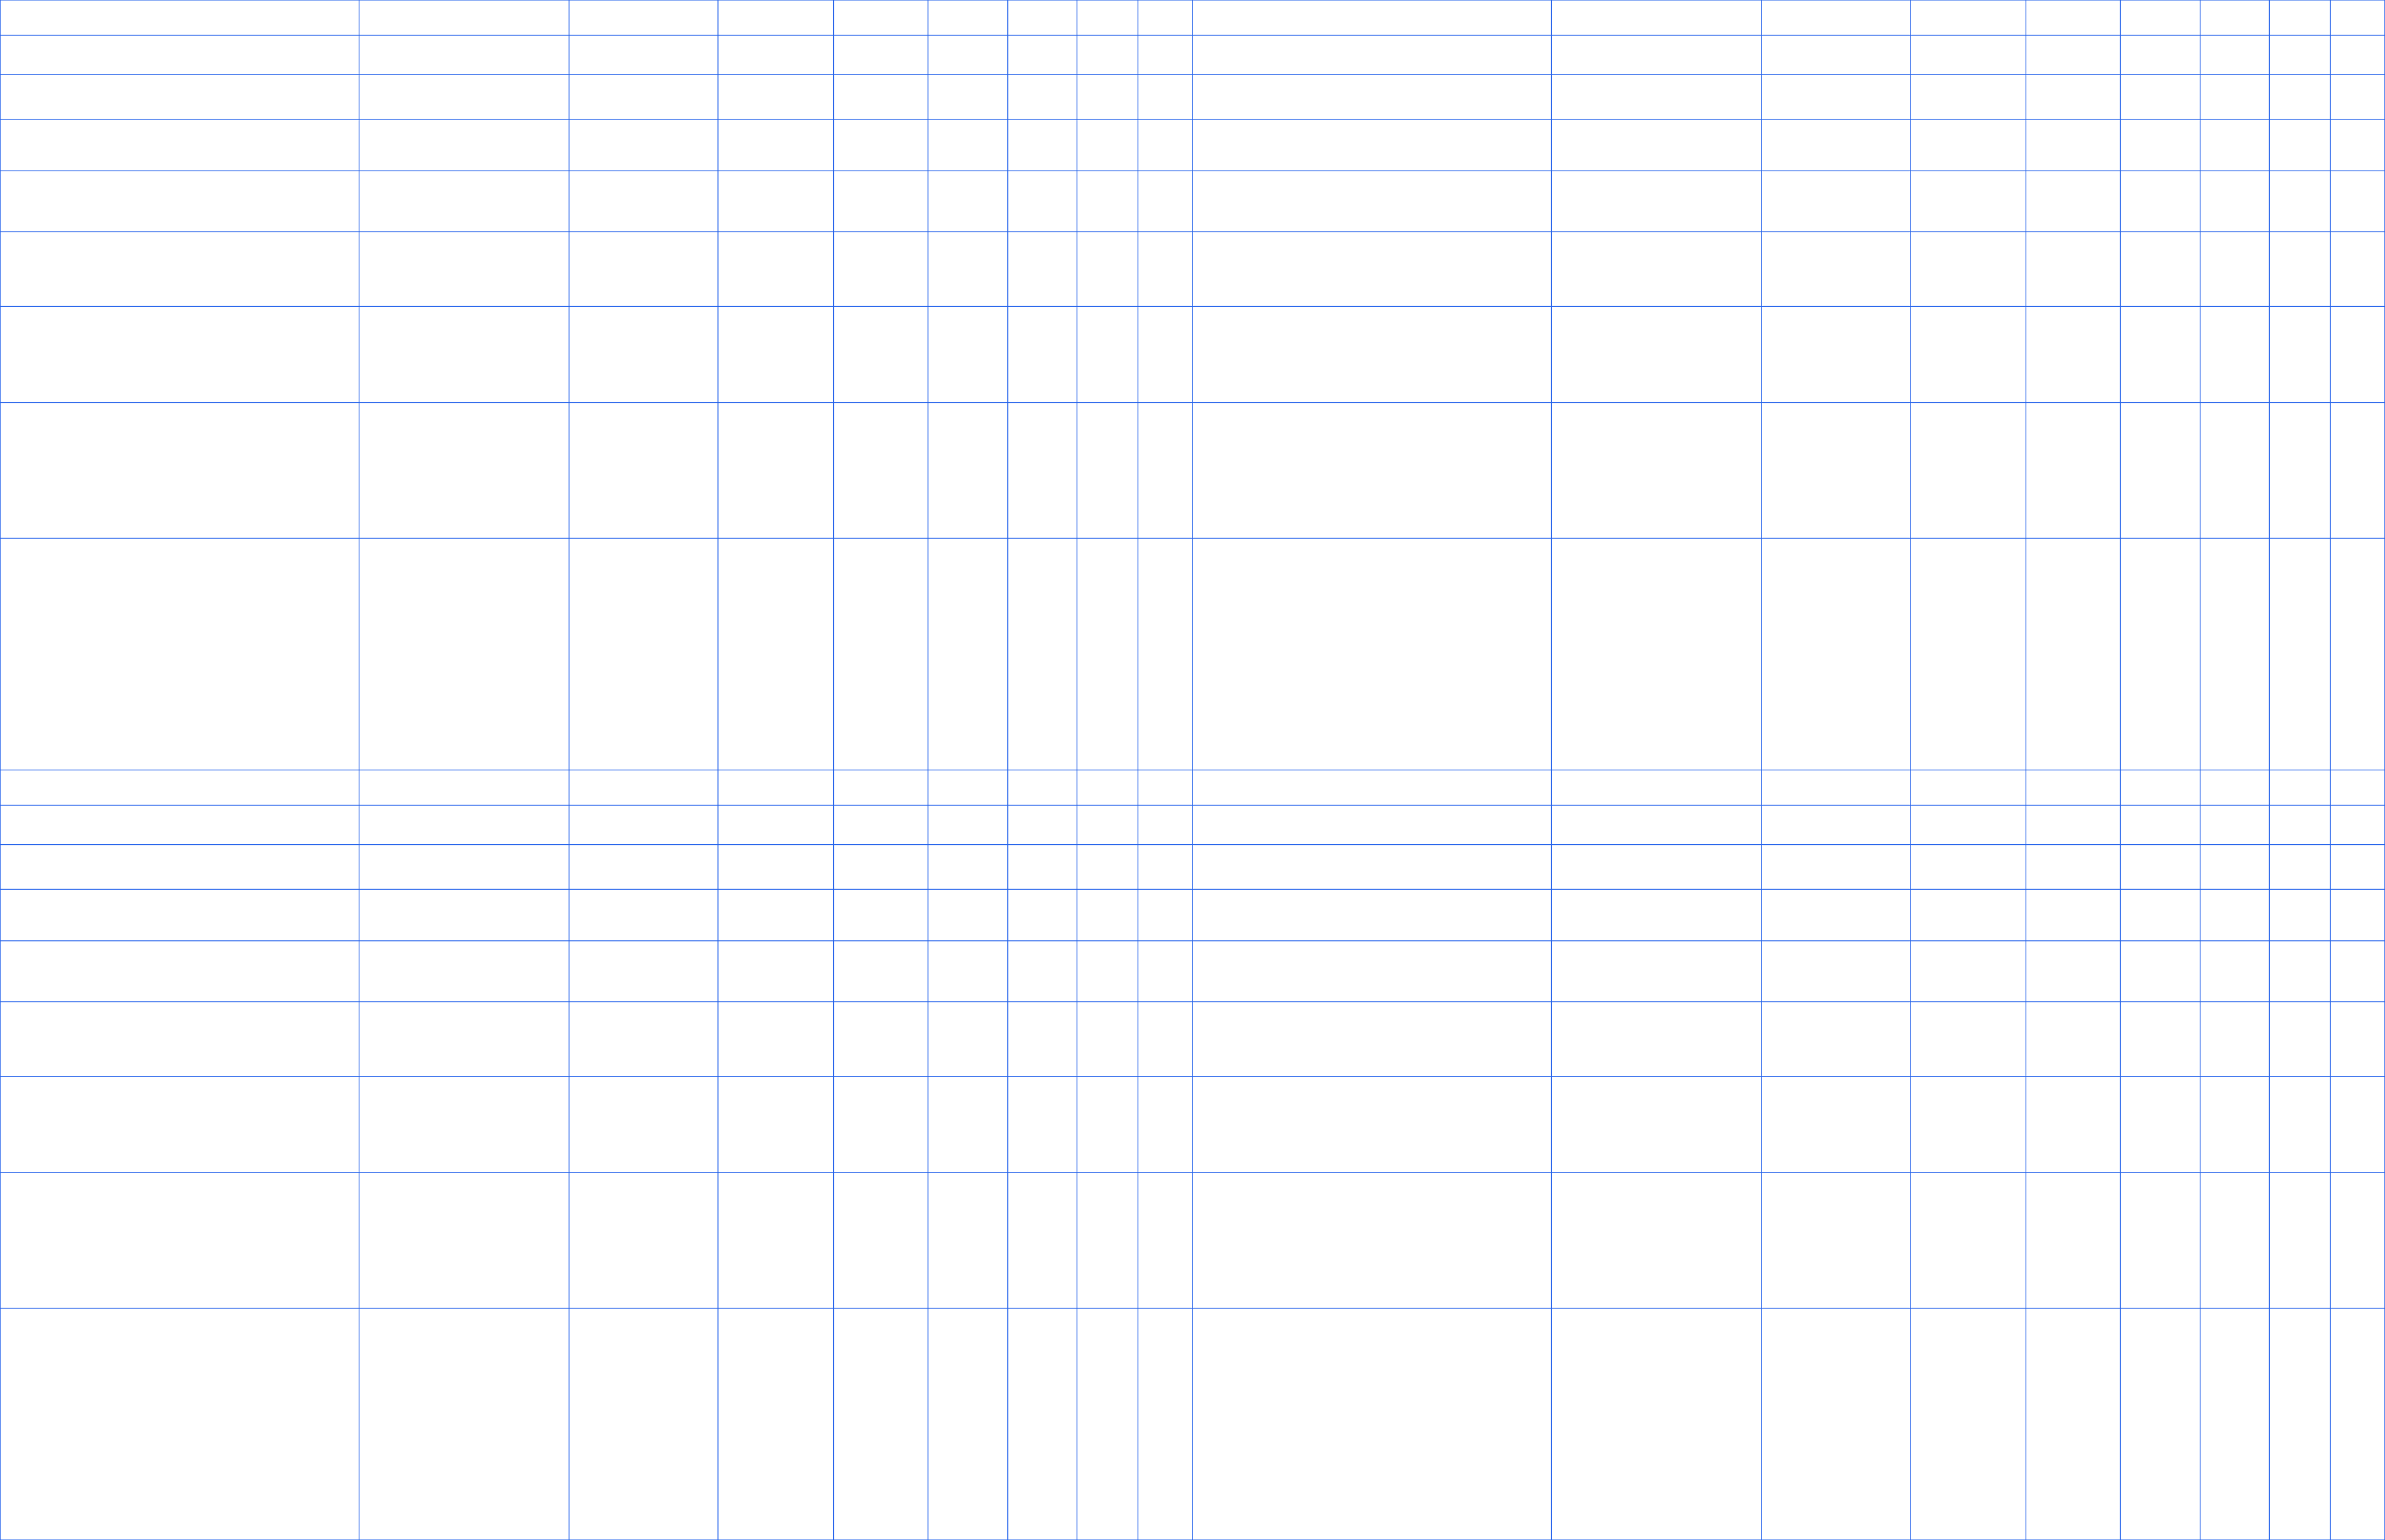
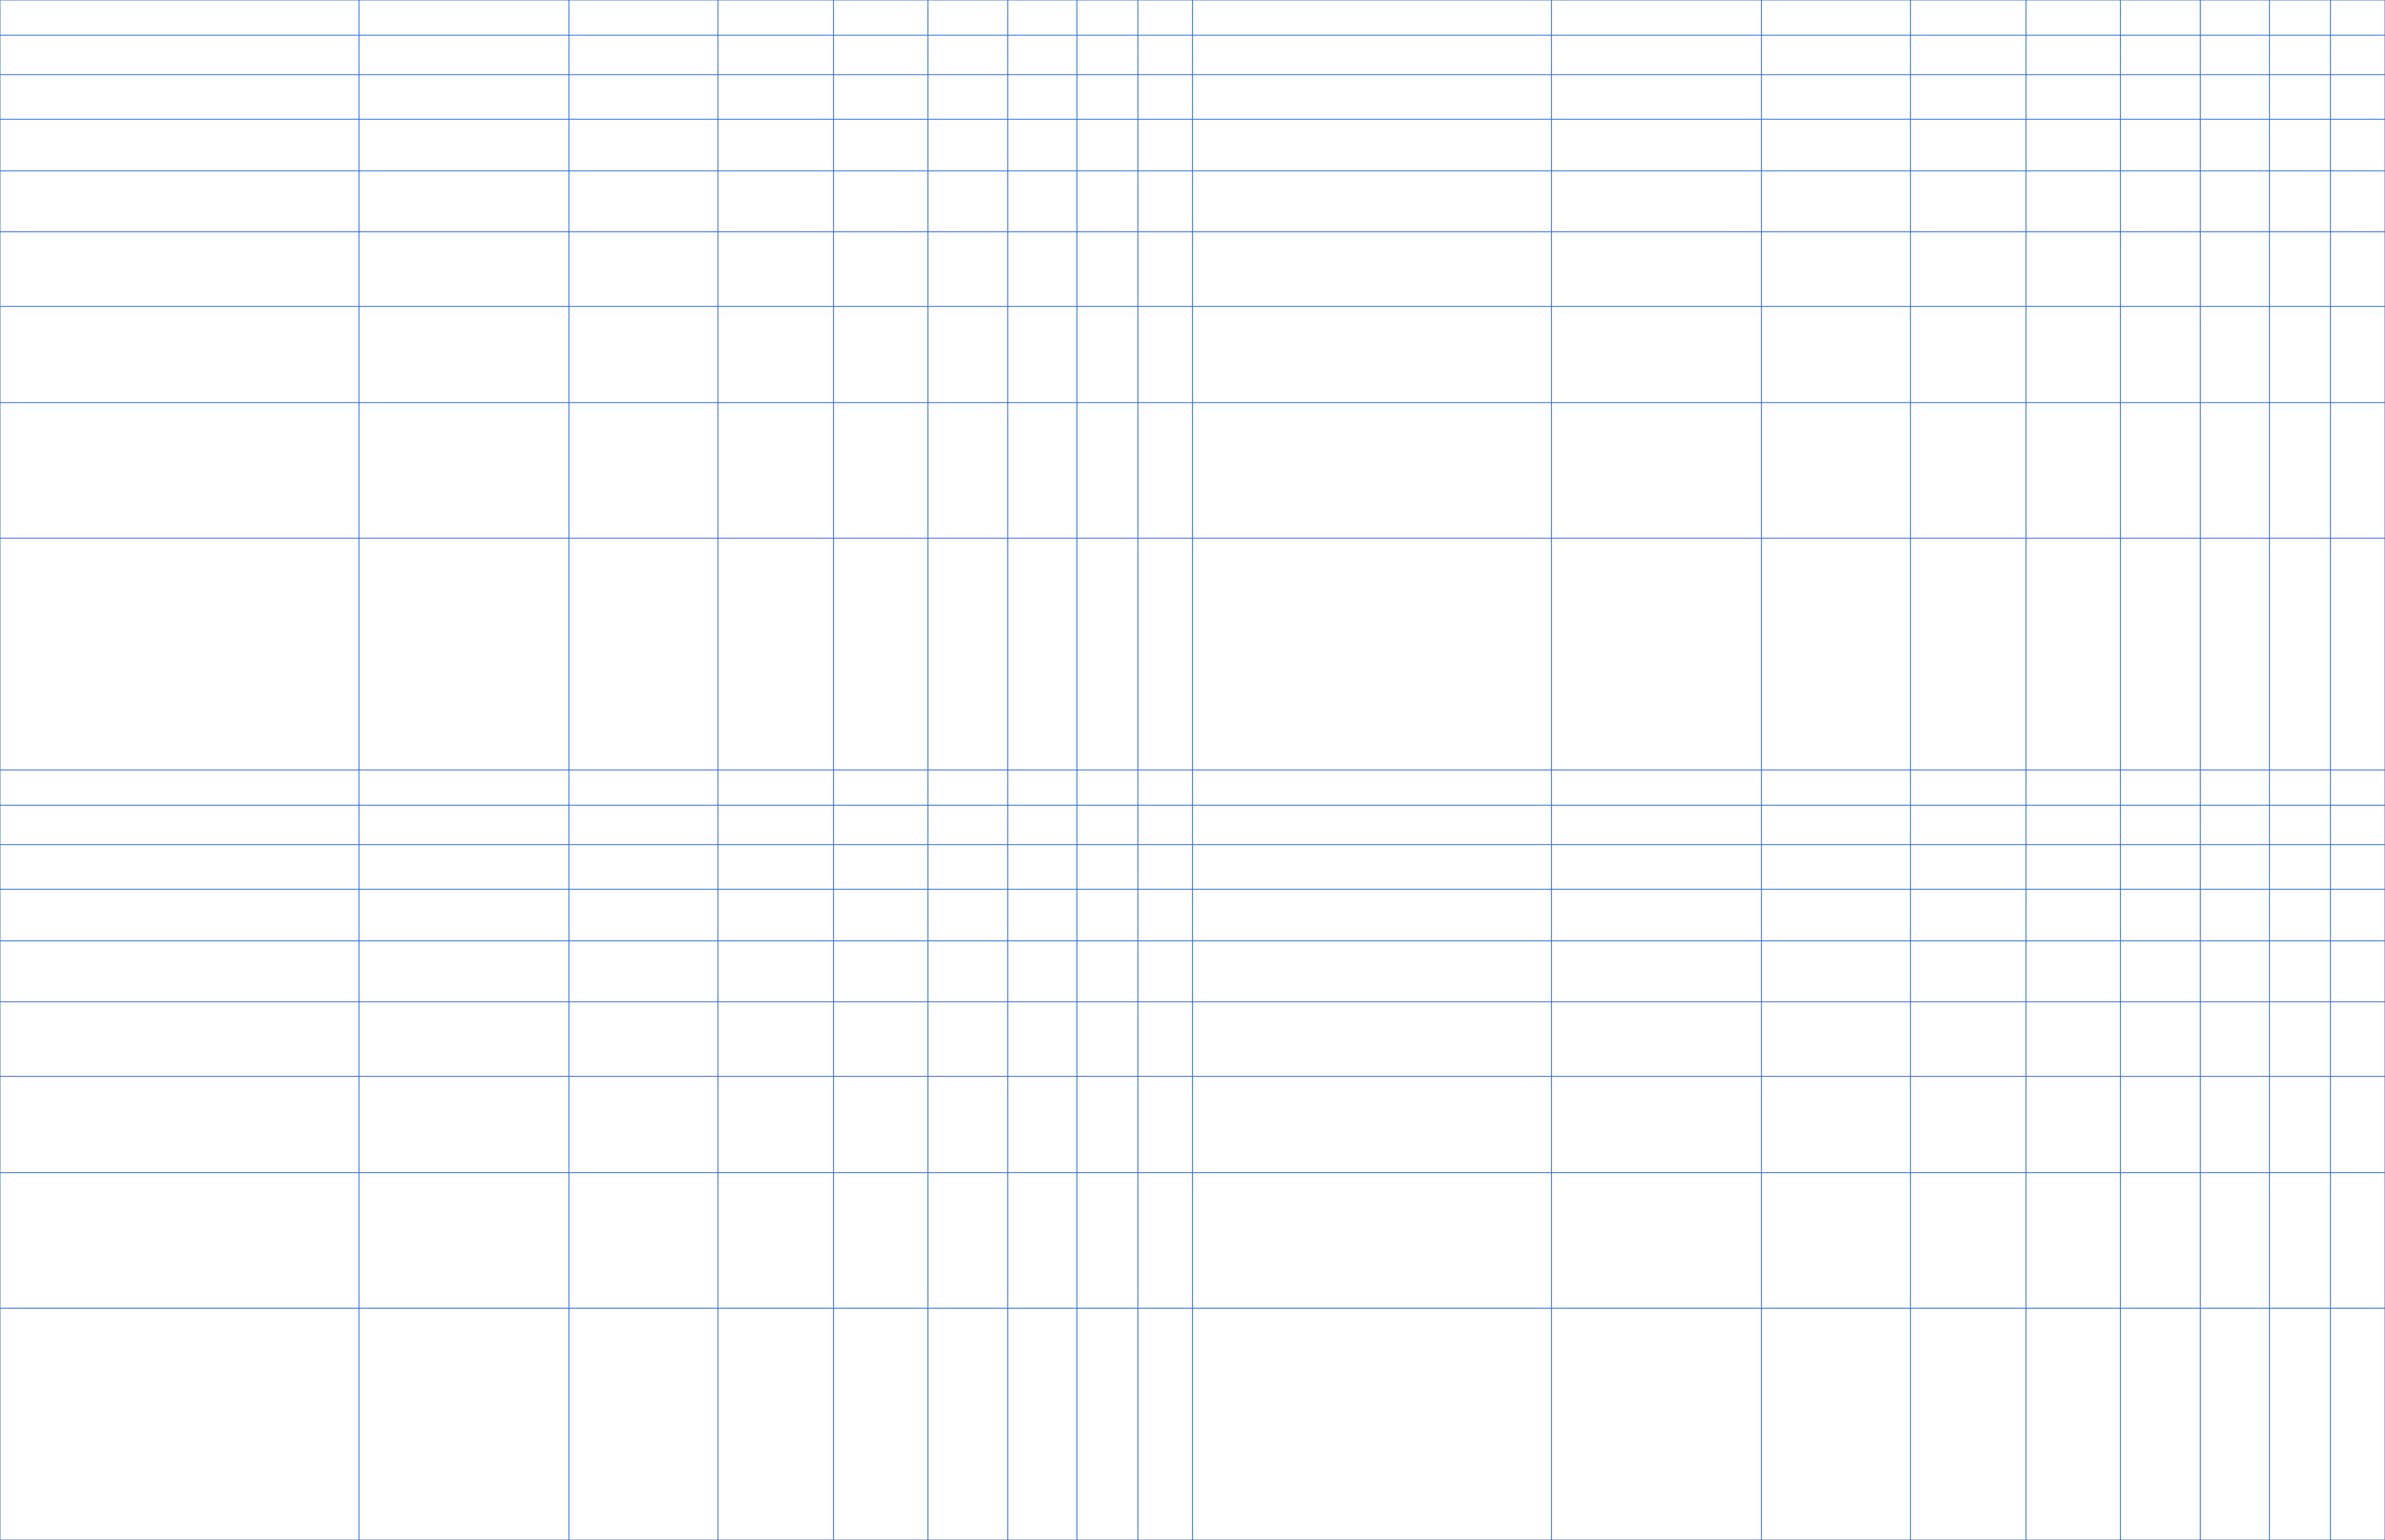
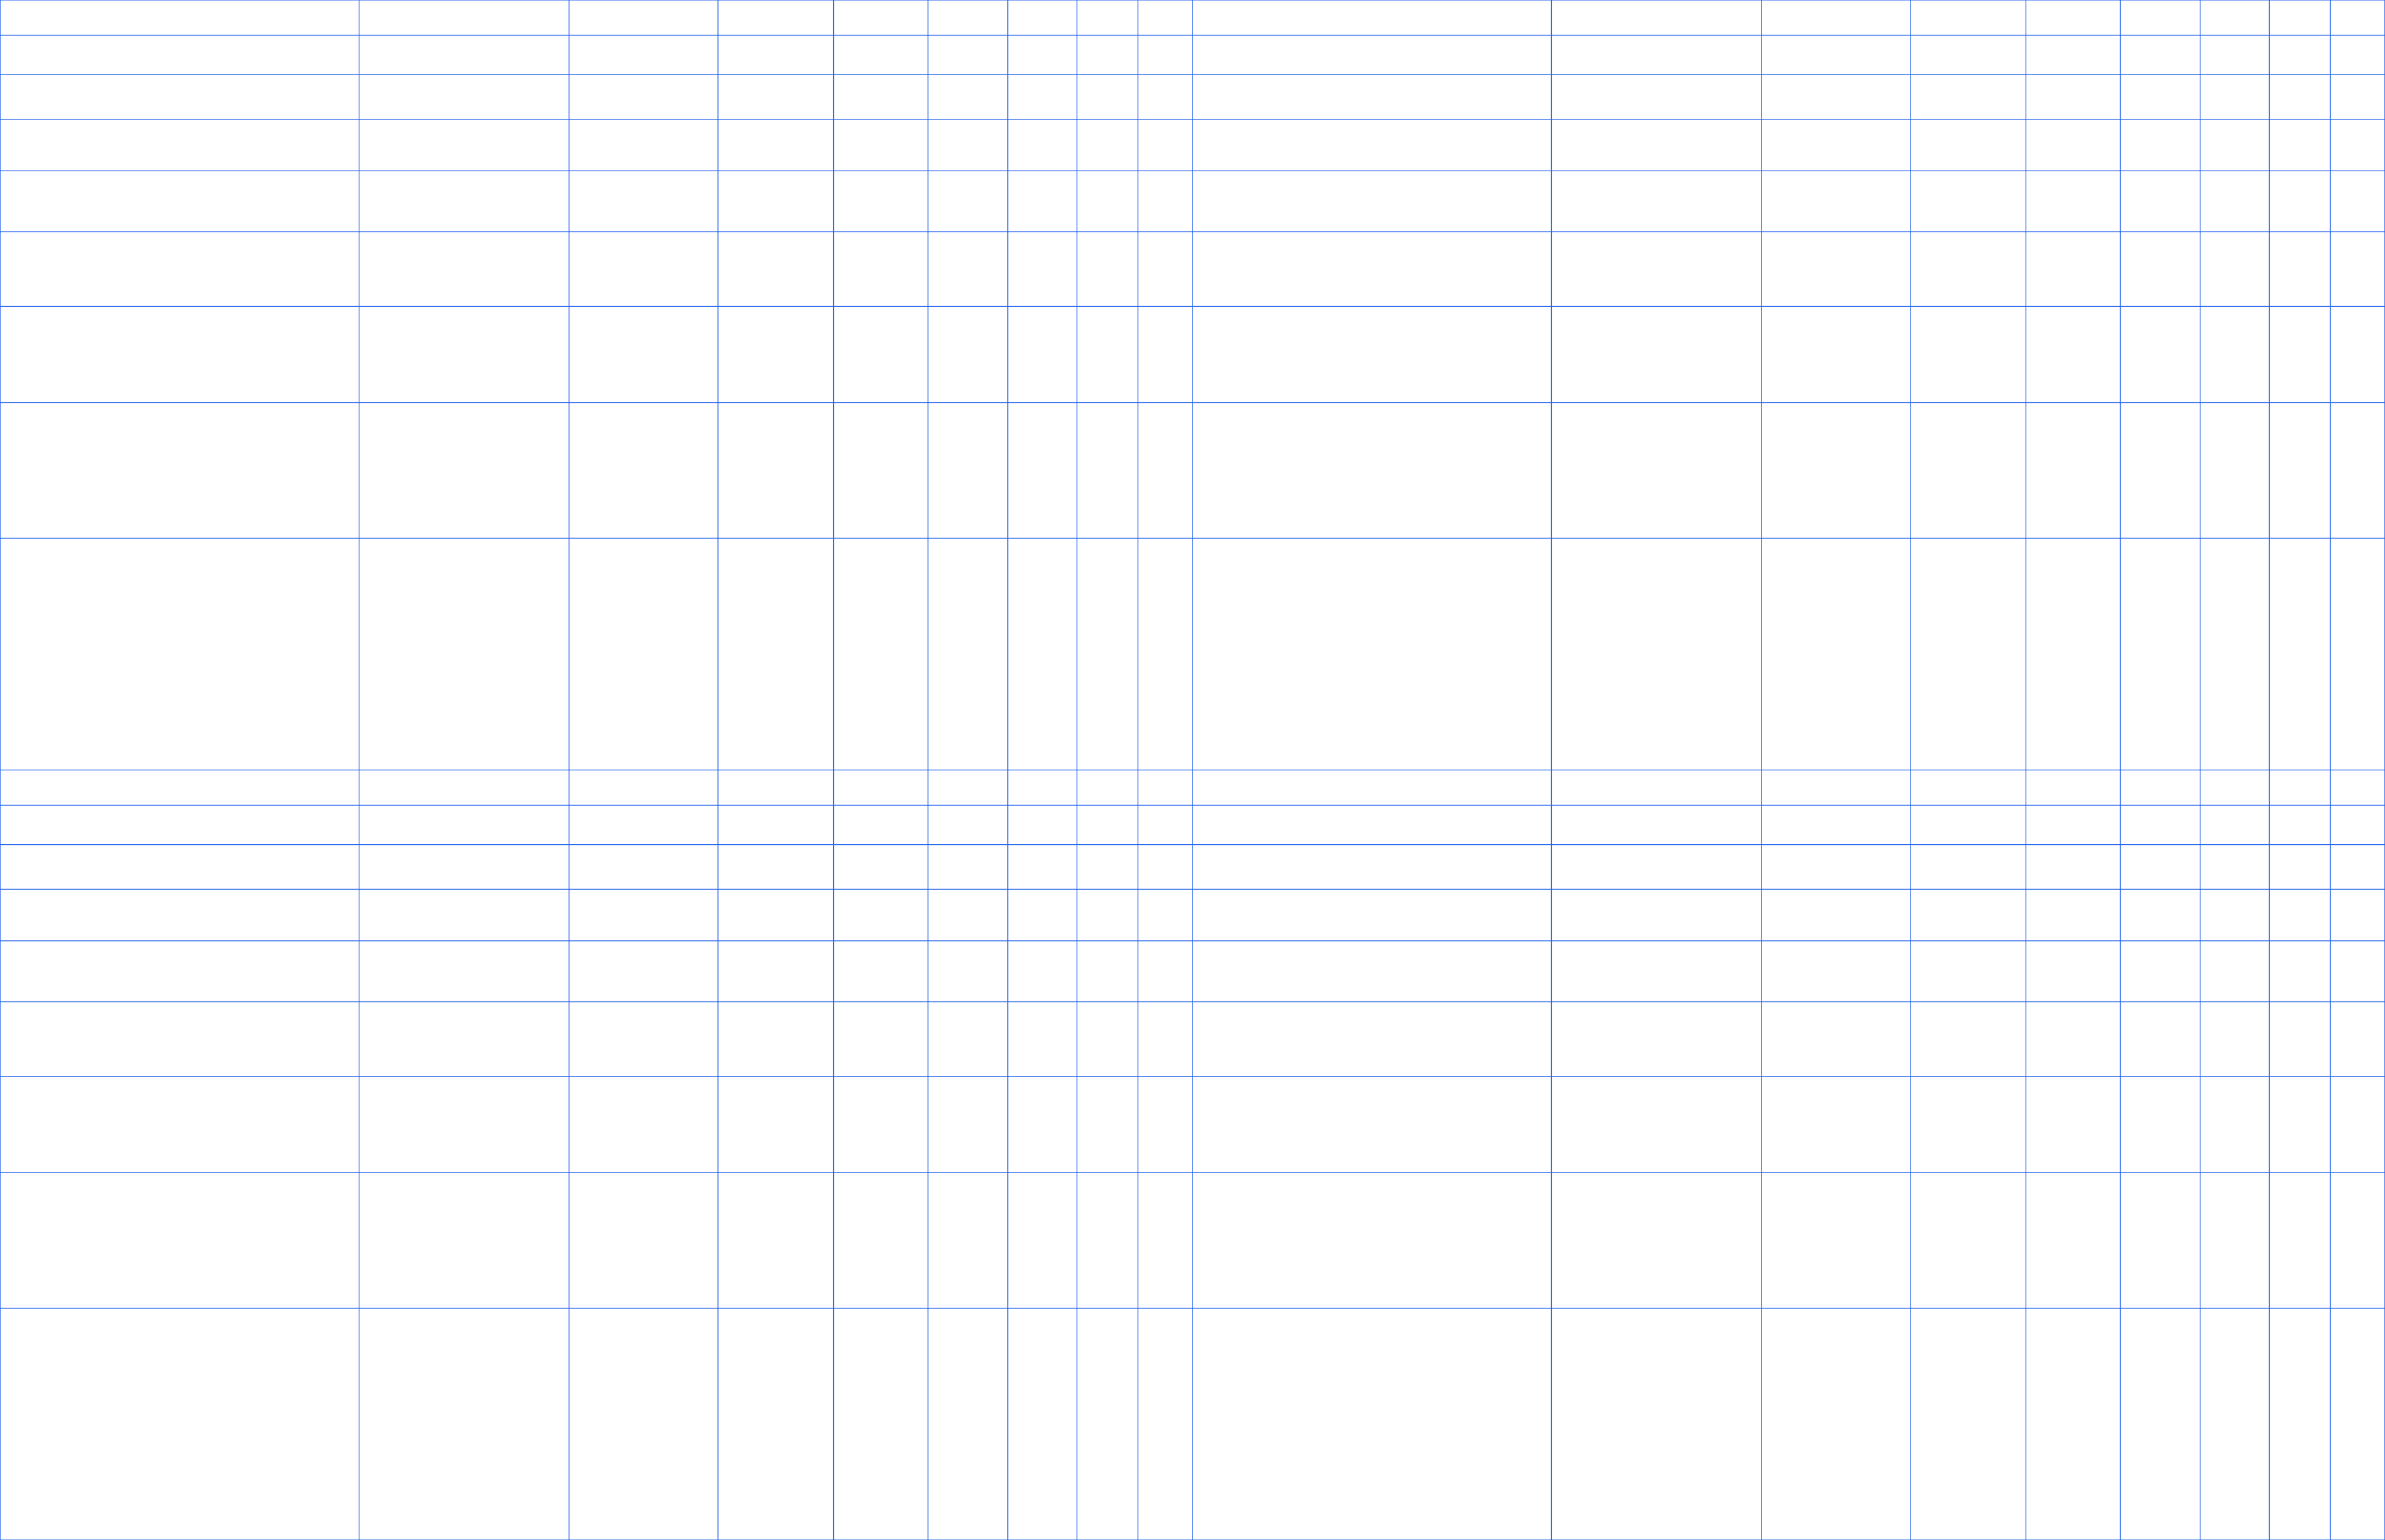
Poster — 457 × 610 mm (18 × 24 in)
How to print log-log graph paper
- Choose a paper size for your chart.
- Download the PDF for printing, or the SVG to edit.
- Pick a line color that suits your printer.
- Print at 100% scale so the log cycles stay evenly spaced.
FAQ
What is log-log graph paper used for?
It is used to plot data that follows a power law, such as frequency response, fluid flow and scaling relationships in physics and engineering.
What is the difference between log-log and semi-log paper?
Log-log paper has logarithmic scales on both axes, while semi-log has one logarithmic and one linear axis.
Why does a power law look straight on log-log paper?
Both axes are logarithmic, so a relationship of the form y equals a power of x becomes a straight line whose slope is the exponent.
Which axis is logarithmic on log-log paper?
Both. The horizontal and vertical axes both use logarithmic scales.
Are these log-log downloads free?
Yes. All log-log PDF, PNG and SVG files are free to download and print with no login.
What is a decade on a log scale?
A decade is a tenfold change, such as from 1 to 10 or from 100 to 1,000. Each decade occupies the same amount of space on a logarithmic axis.